International Journal of Advanced Research in Electrical, Electronics and Instrumentation Engineering
ISSN ONLINE(2278-8875) PRINT (2320-3765)
ISSN ONLINE(2278-8875) PRINT (2320-3765)
M.Karuna1, I. Krishna Rao2
|
| Related article at Pubmed, Scholar Google |
Visit for more related articles at International Journal of Advanced Research in Electrical, Electronics and Instrumentation Engineering
Hospitals need several measurement systems that can measure physiological parameters of the patient. Measurement systems should be able to measure accurately the vitals of patients like heart conditions, body temperature, electrical activity of the muscles etc. Approaching EMG is used to monitor the patient during the exercise and advise him to stop as he is the fatigue condition. During muscle activation, the signal is produced from small electrical currents generated by the exchange of ions across the muscle membranes using surface electrodes is amplified and recorded with instrument known as the EMG. The pc based signal acquisition is efficient and effective method for biomedical signal acquisition and monitoring. In this paper a simple and cost effective method for detecting voluntary muscle movement of human being is proposed .in this work .EMG signal is picked up from the hand biceps using simple computer interface and processed by MATLAB based filter algorithm for online clean display.
Keywords |
| electromyography, Data acquisition, muscle contractions, EMG signal |
INTRODUCTION |
| Electromyography (EMG) is a technique for evaluating and recording the electrical activity produced by skeletal muscles [1]. EMG is performed using an instrument called an electromyography, to produce a record called an electromyogram. An electromyography detects the electrical potential generated by muscle cells when these cells are electrically or neurologically activated. The signals can be analyzed to detect medical abnormalities, activation level, or recruitment order or to analyze the biomechanics of human or animal movement [1, 2]. EMG signals are used in many clinical and biomedical applications. EMG is used as a diagnostics tool for identifying neuromuscular diseases, assessing low-back pain, kinesiology, and disorders of motor control [1,2]. EMG signals are also used as a control signal for prosthetic devices such as prosthetic hands, arms, and lower limbs. EMG then acceleromyograph may be used for neuromuscular monitoring in general anesthesia with neuromuscular-blocking drugs, in order to avoid postoperative residual curarization. Electromyography and nerve conduction studies (NCS) measure nerve and muscle function, and may be indicated when there is pain in the limbs, weakness from spinal nerve compression, or concern about some other neurologic injury or disorder[4]. Spinal nerve injury does not cause neck, mid back pain or low back pain, and for this reason, evidence has not shown EMG or NCS to be helpful in diagnosing causes of axial lumbar pain, thoracic pain, or cervical spine pain. |
METHOD OF APPROACH |
| Method of approach required to detect, filter and display human EMG signal .It also explains the requirements of digital CRO computer based system to acquire biological signal. |
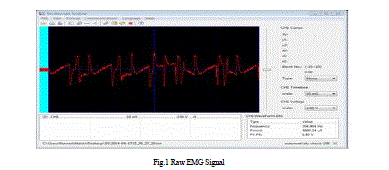
| The Raw analog EMG signal obtained is fed to the Digital Cathode Ray Oscilloscope and can be obtained into the personal computer by connecting the Universal Serial Bus(USB) cable from scope to the one USB port of PC and in PC we need to have a DSWAVE SETUP Software and drivers are to be pre-installed in our PC Once the Connection is established between PC and scope we Need to Open the DSWAVE SETUP application check for the USB connection, if a tick mark is shown at the bottom left of the window then ok else check for connection again . Now press get data button on the window and then it continuously streams the data from the scope into the PC by clicking on the save Button it can be saved as a MS EXCEL FILE which can be used for our further processing of signal in MATLAB.Figure 1 shows the raw EMG signal on DS wave setup. |
 |
BLOCK DIAGRAM |
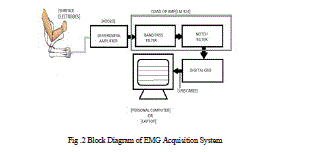
| The below fig is the EMG acquisition system with different Blocks. There are Electrodes, Differential Amplifier, Band pass filter, Notch filter, Digital CRO, Personal computer |
 |
CIRCUIT DIAGRAM |
A .PREAMPLIFIER |
| The EMG signal which is measured by electrodes is of very less its amplitude in the range of -70mV to +90mV. So We need a Pre-Amplifier network to amplify signal nearly 20 to 30 times care must be taken that gain must be in the range to avoid oscillations and also amplification of noise which is eliminated in later stages. |
| AD 620 is used as pre amplifier for amplification of signal. The signal is amplified to 20 to 30 times. The low current noise of the AD620 allows its use in EMG monitors [5]. The AD620„s low power, low supply voltage requirements, and space-saving 8-lead mini-DIP and SOIC package offerings make it an excellent choice for battery powered data recorders. Furthermore, the low bias currents and low current noise coupled with the low voltage noise of the AD620 improve the dynamic range for better performance. The gain range of AD 620 device can be varied with the help of external resistor. It ranges from1 to 1000. |
| The gain equation is |
| G=1+49.5kΩ/R. |
B. IC LM 324 |
| LM324 is a 14pin IC consisting of four independent operational amplifiers (op-amps) compensated in a single package. Op-amps are high gain electronic voltage amplifier with differential input and, usually, a single-ended output. The output voltage is many times higher than the voltage difference between input terminals of an op-amp. These op-amps are operated by a single power supply LM324 and need for a dual supply is eliminated. They can be used as amplifiers, comparators, oscillators, rectifiers etc. The conventional op-amp applications can be more easily implemented with LM324. |
C. BAND PASS FILTER |
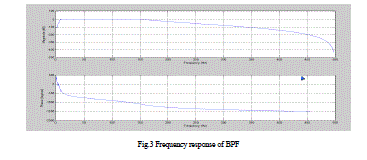
| Typical band pass frequency ranges are from between 10 and 20Hz (high pass filtering) to between 500 and 1000Hz (low-pass filtering). High-pass filtering is necessary because movement artifacts are comprised of low frequency components (typically <10Hz). Low pass filtering is desirable to remove high-frequency components to avoid signal aliasing. So to eliminate the unnecessary frequencies (i.e. below 20 and above 500 Hz) we are using band pass filter. Figure 3 shows the band pass filter model graph. |
 |
D. NOTCH FILTER |
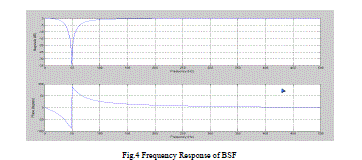
| We know that when we are using line voltage a 50 Hz (60 Hz) pick up noise is added to our signal its voltage ranges from 0.6v to 2v So to eliminate this pick up noise we have designed a notch filter which attenuates the voltage levels at 50 Hz. A narrow band reject filter often called as notch filter, is commonly used for rejection of a single frequency. The most commonly used notch filter is twin T shaped network. One T network is made up of two resistors and a capacitor, while the other use two capacitor and a resistor. The notch out frequency is the frequency at which maximum attenuation occurs. Figure shows the band stop filter range. |
| It is given by |
| fN = 1/2πRC |
| R2 = Q/2πfcC (2Q2-Af) |
| R3 =Q/πFcC. |
| Where AF is the gain at Fc given by |
| Af = R3 /2R1. |
 |
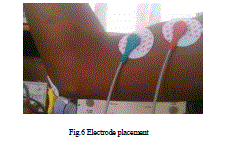
ELECTRODE PLACEMENT |
| Before placing the electrodes on skin, it must be properly cleaned to remove dead cells. Special abrasive and conductive pastes are available which remove dead cells and clean the surface from dirt and sweat. Skin can be properly cleaned with usage of pure alcohol [5] .Which ever skin preparation method and electrode application technique is used, when done properly, the skin typically receives a light red color. This indicates good skin impedance condition. |
| The EMG signal is acquired using three electrodes Fig.6 [5]. Two are placed on the biceps muscle while the third is placed on a bony part of the arm to serve as a reference or ground for our pickup circuit. The ideal location for the muscle electrodes is in the center of the muscle approximately 1cm apart [5,6]. The reference electrode is placed on the bony part underneath of the elbow below the joint apart. |
 |
RESULT AND DISCUSSION |
A. DE-NOISED EMG SIGNAL |
| The wavelet de-noised EMG signal consists only of Contraction of an active muscle and rest period the EMG signal with three active Contractions is as shown. The samples of EMG signals are given on the horizontal axis and corresponding powers are given on the vertical axis. The Muscle Fatigue of the four healthy persons is calculated after denoising the EMG signal and is shown graphically as below. |
B. POWER CALCULATION |
| The average power calculation of the EMG signal plays an important role in determining muscle fatigue of the muscle. By daily taking these muscle fatigues and saving them we can easily tell the patient condition. To calculate the muscle fatigue, we have to calculate the average power which can be calculated by using the avgpower command in MATLAB to the DSP data. |
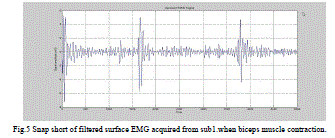 |
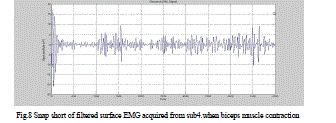
| The above figure is the snap shot of biceps muscle contraction of EMG signal. The signal plot in time period and amplitude levels. |
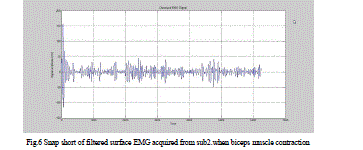 |
| The above figure is the snap shot of biceps muscle contraction of EMG signal. The signal plot in time period and amplitude levels. |
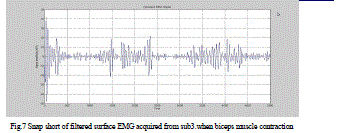 |
| The above figure is the snap shot of biceps muscle contraction of EMG signal. The signal plot in time period and amplitude levels. |
 |
| The above figure is the snap shot of biceps muscle contraction of EMG signal. The signal plot in time period and amplitude levels. |
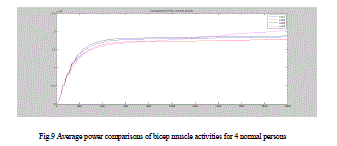 |
| The above figure is the snap shot of biceps muscle contraction of different subjects for their EMG signals avgpower. |
CONCLUSION |
| For the designed acquisition system the signal is effectively measured and is in synchronized according with basic standards. Low cost. Easy to operate. We can check our muscle activity on daily basis easily. Average power of our muscle activity can be measured. |
References |
|