ISSN ONLINE(2278-8875) PRINT (2320-3765)
ISSN ONLINE(2278-8875) PRINT (2320-3765)
E.Kanniga, Dr.M.Sundararajan
|
| Related article at Pubmed, Scholar Google |
Visit for more related articles at International Journal of Advanced Research in Electrical, Electronics and Instrumentation Engineering
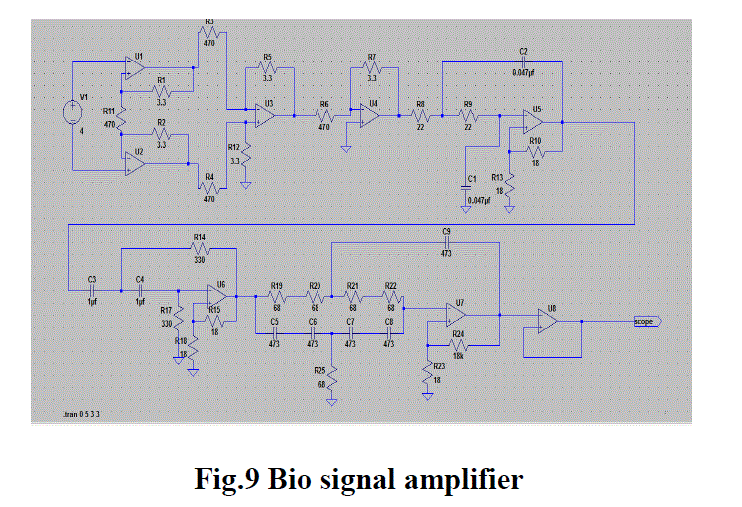
This article surveys the research of the Evolvable Systems .Bio signal amplifier is design to achieve high input impedance excellent common mode rejection ratio(CMRR) and very low noise level and EEG is obtained by measuring electrical potential between varies points of the scalp using a bio signal amplifier shown in the figure [13]. It is a means of communication between brain and machine, with the help of brain peripherals interfacing. Information of neural activities of brain can be exchanged with the machine.
I.INTRODUCTION |
| Neuro feedback interface machine is a new communication link between a functioning human brain and the outside world. These are electronic interfaces with the brain, which has the ability to send and receive signals from the brain. Neuro feedback interface machine uses brain activity to command, control, actuate and communicate with the world directly through brain integration with peripheral devices and systems. It is a means of communication between brain and machine, with the help of brain peripherals interfacing. Information of neural activities of brain can be exchanged with the machine. The computer can in turn use the information to control variety of devices or exchange the information with another neuro feedback interface machine .Thusneuro feedback interface machine extracts electrophysiological signal from suitable components of brain (motor cortices) and process them to generate control signals for machine. It involves neurology, mathematics, electronic engineering and material science with intelligent and (and emotional) devices all around us, it will become possible to just think about a task to be done and it will be done. |
| 1.1 Objective of the study: Thus Neuro feedback interface machine extracts electrophysiological signal from suitable components of brain (motor cortices) and process them to generate control signals for machine. |
| 1.2 Rational of the study: By strategically concluded the values of motor cortices randomly. |
| 1.3 detailed methodology to be used for carrying out the thesis:Linear technology corporation has launched the LT-Spice simulation .This simulation tool is effectively used for the analysis of range, sampling frequency, switched mode power supply high speed switched mode power supply high speed CMOS, data compression tuning analysis instant design files than power simulator(PSIM).Over all core simulation by LABVIEW. |
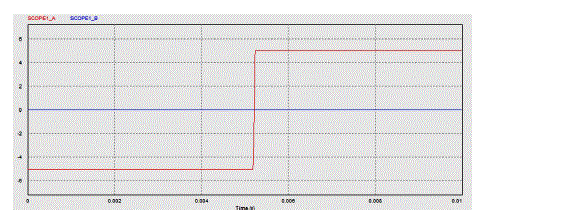
| 1.4 Thesis study: Brief description of the Bio signal amplifier model is given in the figure []. The model described in this project is primarily intended to be used for study of the amplifier step response in LT-Spice environment. The model is based on idea that step response of a real bio signal amplifier can be well modeled as a steady state response |
| 1.5 The expected contribution from the study: By selecting arbitrary values of brain signal in terms of magnitude from the technical survey report taken from various scan centers for MRI scan and CT scan. For unity gain the project achieved the goal of impulse generation. |
| 1.6 Hardware required: Proposed model hardware(1) Bio signal sensor which is not available, under research activity(2) Only like scanner helmet available with probes to measure various potential on the scalp (3)Signal extractor(4) Processor (5) Transceiver (6) Actuators with memory |
| 1.7 Software required: LT-SPICE – linear step analysis, LABVIEW – signal processing and extraction analysis, PSIM – Power supply unit analysis |
II.THESIS ANALYSIS FLOW CHART |
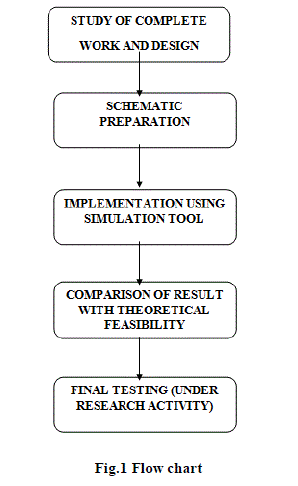 |
| 2.1 LIST OF ACTIVITIES TO BE CARRIED OUT TO COMPLETE THE WORK |
| (1) Literature survey |
| (2) Understanding the circuit |
| (3) Exploring theoretical feasibility and obtaining the oscillating frequency |
| (4) steady state analysis |
| (5) Proposing the model for experimentation and implementation |
| (6) Choosing the simulation tool required |
| (7) Project window creation and schematics capture |
| (8) Assigning initial and final values for passives and sources |
| (9) Running simulation |
| (10) Modifying the inputs and the arbitrary values |
| (11) Simulation data analysis and interpretation. |
III. DIFFERENT WAVE PATTERNS |
| 3.1 ALPHA WAVES: Alpha is the frequency range from 8 Hz to 12 Hz. Hans Berger named the first rhythmic EEG activity he saw as the "alpha wave". This was the "posterior basic rhythm" (also called the "posterior dominant rhythm" or the "posterior alpha rhythm"), seen in the posterior regions of the head on both sides, higher in amplitude on the dominant side. It emerges with closing of the eyes and with relaxation, and attenuates with eye opening or mental exertion. |
 |
| 3.2 BETA WAVES:Beta is the frequency range from 12 Hz to about 30 Hz. It is seen usually on both sides in symmetrical distribution and is most evident frontally. Beta activity is closely linked to motor behavior and is generally attenuated during active movements. Low amplitude beta with multiple and varying frequencies is often associated with active, busy or anxious thinking and active concentration. Rhythmic beta with a dominant set of frequencies is associated with various pathologies and drug effects, especially benzodiazepines. It may be absent or reduced in areas of cortical damage. |
 |
| 3.3 THETA WAVES:Theta is the frequency range from 4 Hz to 7 Hz. Theta is seen normally in young children. It may be seen in drowsiness or arousal in older children and adults; it can also be seen in meditation. Excess theta for age represents abnormal activity. It can be seen as a focal disturbance in focal sub cortical lesions; it can be seen in generalized distribution in diffuse disorder or metabolic encephalopathy or deep midline disorders or some instances of hydrocephalus. On the contrary this range has been associated with reports of relaxed, meditative, and creative states. |
 |
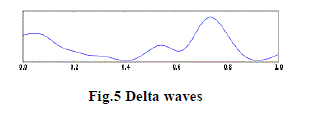
| 3.4 DELTA WAVE:Delta is the frequency range up to 4 Hz. It tends to be the highest in amplitude and the slowest waves. It is seen normally in adults in slow wave sleep. It is also seen normally in babies. It may occur focally with sub cortical lesions and in general distribution with diffuse lesions, metabolic encephalopathy hydrocephalus or deep midline lesions. It is usually most prominent frontally in adults (e.g. FIRDA - Frontal Intermittent Rhythmic Delta) and posterior in children (e.g. OIRDA - Occipital Intermittent Rhythmic Delta). |
 |
| 3.5 GAMMA WAVES |
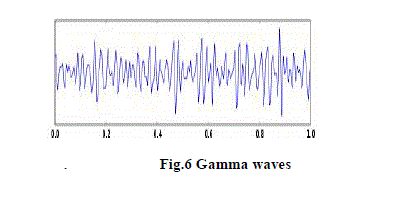
| Gamma is the frequency range approximately 30–100 Hz. Gamma rhythms are thought to represent binding of different populations of neurons together into a network for the purpose of carrying out a certain cognitive or motor function. Mu ranges 8–13 Hz. and partly overlaps with other frequencies. It reflects the synchronous firing of motor neurons in rest state. Mu suppression is thought to reflect motor mirror neuron systems, because when an action is observed, the pattern extinguishes, possibly because of the normal neuronal system and the mirror neuron system "go out of sync”, and interfere with each other |
 |
IV.NEURONS |
| A neuron is an electrically excitable cell that processes and transmits information by electrical and chemical signaling. Chemical signaling occurs via synapses, specialized connections with other cells. Neurons connect to each other to form neural network. Neurons are the core components of the nervous system, which includes the brain, spinal cord peripheral ganglia. |
V.PRINCIPLE OF THE WORK |
| Main principle behind this interface is the bioelectrical activity of nerves and muscles. It is now well established that the human body, which is composed of living tissues, can be considered as a power station generating multiple electrical signals with two internal sources, namely muscles and nerves. We know that brain is the most important part of human body. It controls all the emotions and functions of the human body. The brain is composed of millions of neurons. These neurons work together in complex logic and produce thought and signals that control our bodies. When the neuron fires, or activates, there is a voltage change across the cell, (~100mv) which can be read through a variety of devices. When we want to make a voluntary action, the command generates from the frontal lobe. Signals are generated on the surface of the brain. These electric signals are different in magnitude and frequency. |
| By monitoring and analyzing these signals we can understand the working of brain. When we imagine ourselves doing something, small signals generate from different areas of the brain. These signals are not large enough to travel down the spine and cause actual movement. These small signals are, however, measurable. A neuron depolarizes to generate an impulse; this action causes small changes in the electric field around the neuron. These changes are measured as 0 (no impulse) or 1 (impulse generated) by the electrodes. We can control the brain functions by artificially producing these signals and sending them to respective parts. This is through stimulation of that part of the brain, which is responsible for a particular function using implanted electrodes. |
| 5.1 Neuro Feedback Interface Machine Components |
| A NEUROFEEDBACK INTERFACE MACHINE in its scientific interpretation is a combination of several hardware and software components trying to enable its user to communicate with a computer by intentionally altering his or her brain waves. The task of the hardware part is to record the brainwaves– in the form of the EEG signal – of a human subject, and the software has to analyze that data. In other words, the hardware consists of an EEG machine and a number of electrodes scattered over the subject‘s skull. The EEG machine, which is connected to the electrodes via thin wires, records the brain-electrical activity of the subject, yielding a multi-dimensional (analog or digital) output. The values in each dimension (also called channel) represent the relative differences in the voltage potential measured at two electrode sites. |
| The software system has to read, digitize (in the case of an analog EEG machine), and preprocess the EEG data (separately for each channel), understand the subject‘s intentions, and generate appropriate output. To interpret the data, the stream of EEG values is cut into successive segments, transformed into a standardized representation, and processed with the help of a classifier. There are several different possibilities for the realization of a classifier; one approach – involving the use of an artificial neural network (ANN) – has become the method of choice in recent years. |
| 5.2 Implant Device |
| The EEG is recorded with electrodes, which are placed on the scalp. Electrodes are small plates, which conduct electricity. They provide the electrical contact between the skin and the EEG recording apparatus by transforming the ionic current on the skin to the electrical current in the wires. To improve the stability of the signal, the outer layer of the skin called stratum cornea should be at least partly removed under the electrode. Electrolyte gel is applied between the electrode and the skin in order to provide good electrical contact. |
| Usually small metal-plate electrodes are used in the EEG recording. Neural implants can be used to regulate electric signals in the brain and restore it to equilibrium. The implants must be monitored closely because there is a potential for almost anything when introducing foreign signals into the brain. |
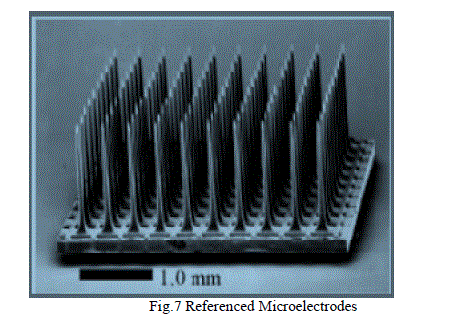 |
| There are a few major problems that must be addressed when developing neural implants. These must be made out of biocompatible material or insulated with biocompatible material that the body won‘t reject and isolate. They must be able to move inside the skull with the brain without causing any damage to the brain. The implant must be chemically inert so that it doesn‘t interact with the hostile environment inside the human body. All these factors must be addressed in the case of neural implants; otherwise it will stop sending useful information after a short period of time. There are simple single wire electrodes with a number of different coatings to complex three-dimensional arrays of electrodes, which are encased in insulating biomaterials. Implant rejection and isolation is a problem that is being addressed by developing biocompatible materials to coat or incase the implant. |
| A microscopic glass cone contains a neurotrophic factor that induces neuritis to grow into the cone, where they contact one of several gold recording wires. Neuritis that is induced to grow into the glass cone makes highly stable contacts with recording wires. Signal conditioning and telemetric electronics are fully implanted under the skin of the scalp. An implanted transmitter (TX) sends signals to an external receiver (RX), which is connected to a computer. |
| 5.3 External Device |
| The classifier‘s output is the input for the device control. The device control simply transforms the classification to a particular action. The action can be, e.g., an up or down movement of a cursor on the screen or a selection of a letter in a writing application. However, if the classification feedback was nothingïÿýïÿý or rejectïÿýïÿý, no action is performed, although the user may be informed about the rejection. It is the device that subject produce and control motion. |
| 5.4feedback |
| Real-time feedback can dramatically improve the performance of a brain–machine interface. Feedback is needed for learning and for control. Real-time feedback can dramatically improve the performance of a brain–machine interface. In the brain, feedback normally allows for two corrective mechanisms. One is the online ‘control and correction of errors during the execution of a movement. The other is learning: the gradual adaptation of motor commands, which takes place after the execution of one or more movements. |
| In the BMIs based on the operant conditioning approach, feedback training is essential for the user to acquire the control of his or her EEG response. The BMIs based on the pattern recognition approach and using mental tasks do not definitely require feedback training. However, feedback can speed up the learning process and improve performance. Cursor control has been the most popular type of feedback in BMIs. Feedback can have many different effects, some of them beneficial and some harmful. Feedback used in BMIs has similarities with biofeedback, especially EEG biofeedback ref [1]. |
| 5.5 Signal Processing |
| Signal processing is an area of system engineering, electrical engineering and applied mathematics that deals with operations on or analysis of signals, in either discrete or continuous time. Signals of interest can include sound, image time, time-varying measurement values and sensor data, for example biological data. Signals are analog or digital electrical representations of time-varying or spatial-varying physical quantities. |
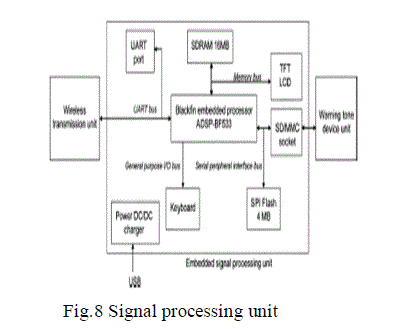
| The embedded signal-processing module was designed as a platform which performs a real-time EEG-based drowsiness detection algorithm. It contains powerful computations and can support various peripheral interfaces. The embedded module mainly consists of an embedded signal-processing unit, wireless transmission unit, and a warning tone device unit. The received EEG data will be real time processed, analyzed, and displayed by the embedded signal-processing unit. When the drowsy state is detected, the warning tone device unit will be triggered to alarm the driver. Reference [7] |
 |
| Analog signal processing: Analog signal processing is for signals that have not been digitized, as in legacy radio, telephone, radar, and television systems. This involves linear electronic circuits such as passive filters, active filters, additive mixers, integrators and delay lines. It also involves non-linear circuits such as comprators,multiplicators (frequency mixers and voltage-controlled amplifiers), voltage-controlled filters, voltage-controlled oscillators and phase-locked loops. |
| The bio signal amplifier used to measure the EEG includes: differential amplifier, isolation and filter. |
| BIO SIGNAL AMPLIFIER |
 |
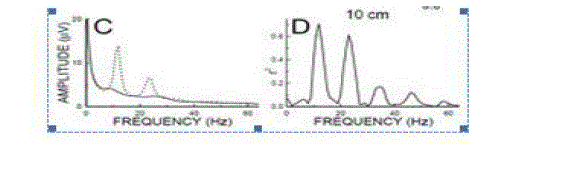
| RESULT FOR BIO SIGNAL AMPLIFIER |
 |
 |
| DESCRIPTION |
| An electrocardiogram is obtained by measuring electrical potential between various points of the body using a bio signal amplifier.The bio signal amplifier is a basic signal- conditioning element designed specifically for electro physiological applications, to establish bio signal data acquisition and real time analysis. It features high input impedance, excellent CMRR and very low noise level. The electrical signal measured from the surface has amplitude between 10uV to 5uV and bandwidth from 0.5 to 150Hz. The electrodes are traditionally placed on arms and legs, making it easy to position the electrodes. |
VI. CONCLUSION |
| The Signal Extractor is a simple tool that lets you extract signals or data from one input bus/signal and output the extracted data onto new Buses/signals. |
| The extractor algorithm file defines output buses/signals and specifies how data should be extracted by identifying patterns and listing the commands to execute when those patterns are found. |
ACKNOWLEDGEMENT |
| I would like to express my sincere gratitude to our esteemed Bharath University for their encouragement and motivation that propelled me to submit my article. I sincerely thank Dr.M.Rajani and Dr.sridhar, Director - Research and my supervisor Dr.M.Sundararajan and Dr. Khanna for their able guidance and suggestions that helped me in achieving the aim of this research work. |
References |
|