International Journal of Advanced Research in Electrical, Electronics and Instrumentation Engineering
ISSN ONLINE(2278-8875) PRINT (2320-3765)
ISSN ONLINE(2278-8875) PRINT (2320-3765)
Swati Singh1, Lini Mathew2, Shimi S.L.2
|
| Related article at Pubmed, Scholar Google |
Visit for more related articles at International Journal of Advanced Research in Electrical, Electronics and Instrumentation Engineering
This paper presents a new fuzzy logic based Maximum Power Point Tracking (MPPT) algorithm for solar panel. The solar panel is modelled and analysed in MATLAB/SIMULINK. The Solar panel can produce maximum power at a particular operating point called Maximum Power Point (MPP).To produce maximum power and to get maximum efficiency, the entire photovoltaic panel must operate at this particular point. Maximum power point of PV panel keeps on changing with changing environmental conditions such as solar irradiance and cell temperature. Thus to extract maximum available power from a PV module, MPPT algorithms are implemented. In this paper, Perturb and Observe (P&O) MPPT and fuzzy logic based MPPT are developed and compared. Simulation results show the effectiveness of the fuzzy based technique to produce a more stable power.
Keywords |
| MPPT, Fuzzy Logic, PV Modeling, Boost Converter, Perturb and Observe |
I. INTRODUCTION |
| Renewable energy also called non-conventional type of energy sources are the sources which are continuously replenished by natural processes. Solar energy, bio-energy (bio-fuels grown sustainably), wind energy and hydropower etc., are some of the examples of renewable energy sources [1]. A renewable energy system convert the energy found in sunlight, falling-water, wind, sea-waves, geothermal heat, or biomass into a form, which we can use in the form of heat or electricity. The majority of the renewable energy comes either directly or indirectly from sun and wind and can never be fatigued, and therefore they are called renewable. |
| However, the majority of the world's energy sources came from conventional sources- fossil fuels such as coal, natural gases and oil. These fuels are often termed as non-renewable energy sources. Though, the available amount of these fuels are extremely large, due to decrease in level of fossil fuel and oil level day by day after a few years it will end. Hence the demand for renewable energy sources increases as it is environmental friendly and pollution free which reduces the greenhouse effect. |
II. SOLAR ENERGY |
| Solar energy is a non-conventional type of energy. Solar energy has been harnessed by humans since ancient times using a variety of technologies. Solar powered electrical generation relies on photovoltaic system and heat engines. To harvest the solar energy, the most common way is to use photo voltaic panels which will receive photon energy from sun and convert to electrical energy. Solar technologies are broadly classified as either passive solar or active solar depending on the way they detain, convert and distribute solar energy. |
| Active solar techniques include the use of PV panels and solar thermal collectors to strap up the energy. Passive solar techniques include orienting a building to the sun, selecting materials with favourable thermal mass or light dispersing properties and design spaces that naturally circulate air. Solar energy has a vast area of application such as electricity generation for distribution, heating water, lighting building, crop drying etc. |
| The comparison between different photovoltaic cells can be done on the basis of their performance and characteristic curve. The parameters are always given in datasheet. The datasheet make available the notable parameter regarding the characteristics and performance of PV cells with respect to standard test condition. Standard test conditions are as follows: |
| Temperature (Tn) = 250C |
| Irradiance (Gn) = 1000 W/m2 |
III. PHOTOVOLTAIC CELL |
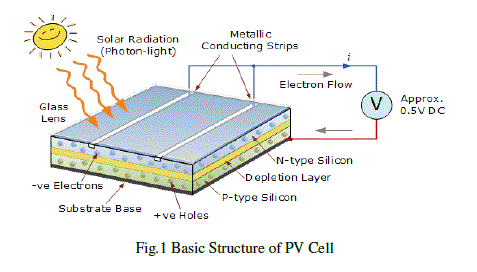
| PV cells are made of semiconductor materials, such as silicon. For solar cells, a thin semiconductor wafer is specially treated to form an electric field, positive on one side and negative on the other. When light energy strikes the solar cell, electrons are knocked loose from the atoms in the semiconductor material. If electrical conductors are attached to the positive and negative sides, forming an electrical circuit, the electrons can be captured in the form of an electric current that is, electricity .This electricity can then be used to power a load. The basic structure of a PV cell is shown in Fig.1. |
 |
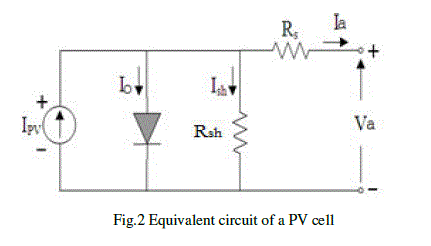 |
| An ideal solar cell is modelled by a current source in parallel with a diode. However no solar cell is ideal and thereby shunt and series resistances are added to the model as shown in the Fig.2. The current source Ipv represents the cell photo current, Rsh and Rs are used to represent the intrinsic series and shunt resistance of the cell respectively. Usually the value of Rsh is very large and that of Rs is very small, hence they may be neglected to simplify the analysis. The PV mathematical model used to simplify our PV array is represented by the equation [1]: |
| Output current ( Ia ) of PV module is given by: |
 |
| Both K and Tc should have the same temperature unit, either Kelvin or Celsius. When the ambient temperature and irradiation levels change, the cell operating temperature also changes, resulting in a new output voltage and a new photocurrent value. The solar cell operating temperature varies as a function of solar irradiation level and ambient temperature. The variable ambient temperature Ta affects the cell output voltage and cell photocurrent. |
IV. SIMSCAPE MODEL OF SOLKAR 36 WATT |
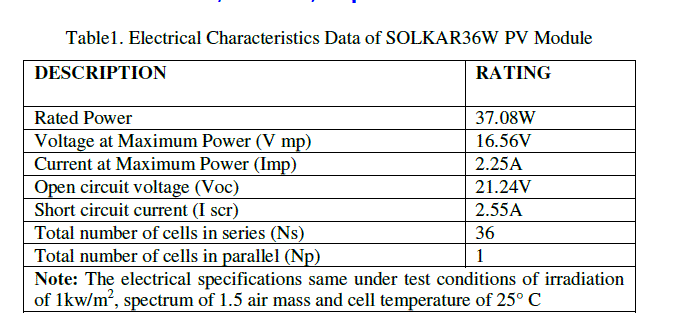
| Solkar make 36 W, PV module is taken as the reference module for simulation and the name-plate details are given in Table 1 [2]. |
 |
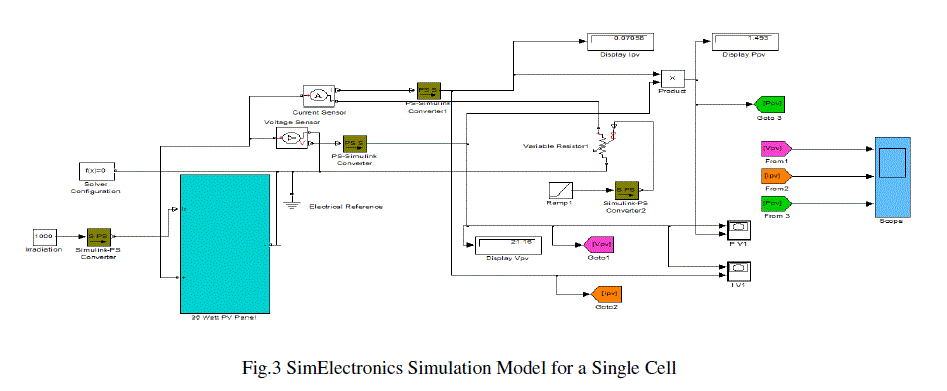
| The model was developed using blocks of Simelectronics and Simulink as shown in Fig.3 [3].The solar cell was parameterized by equivalent circuit parameters. Diode reverse saturation current, Is was taken as 0.1nA, measurement temperature was kept as 25°C. Solar-generated current Ipv, and Irradiance used for measurements, Ir, were kept at their default values of 7.34A and 1000 W/m2 respectively. The advantage of using of this high level of implementation is to create a simple equivalent circuit, which have much more complex parameters, including the effect of temperature in the device which is very important for behavior of this type of system. |
 |
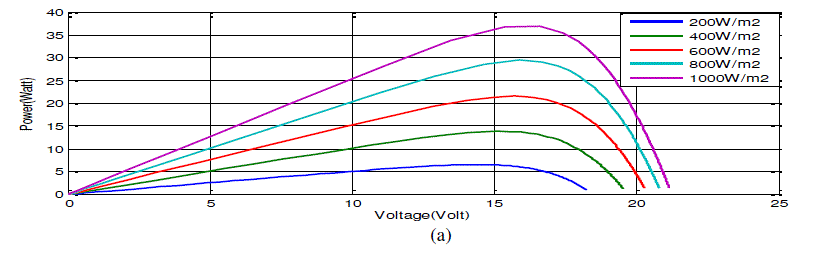
| The values are then plotted using the plot command in MATLAB. The graph of P-V, I-V and P-I against different radiation levels are shown in the Fig. 4(a), (b) & (c). |
 |
 |
V. OPERATION AND DESIGN OF A DC TO DC CONVERTER |
| DC-DC converters can be used as switching mode regulators to convert an unregulated dc voltage to a regulated dc output voltage [4]. The regulation is normally achieved by PWM at a fixed frequency and the switching device is generally BJT, MOSFET or IGBT. The minimum oscillator frequency should be about 100 times longer than the transistor switching time to maximize efficiency. This limitation is due to the switching loss in the transistor. The transistor switching loss increases with the switching frequency and thereby, the efficiency decreases. There are four topologies for the switching regulators: buck converter, boost converter, buck-boost converter, and cuk converter. However this paper deals with the boost regulator and further discussions will be concentrated towards this one. Fig.5(a) shows a step up boost converter [5]. It consists of a dc input voltage source Vg, boost inductor L, controlled switch S, diode D, filter capacitor C, and the load resistance R. When the switch S is in the on state, the current in the boost inductor increases linearly and the diode D is off at that time. When the switch S is turned off, the energy stored in the inductor is released through the diode to the output RC circuit. |
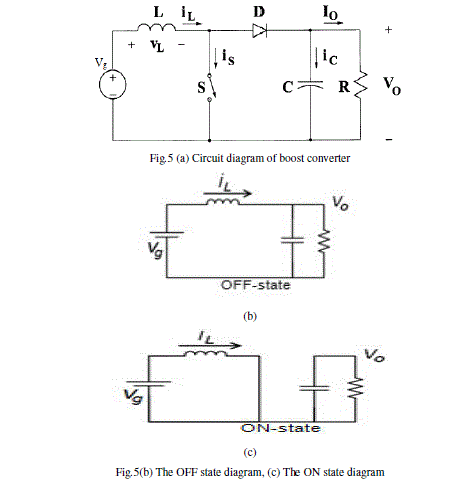 |
| (a) OFF STATE: |
| In the OFF state, the circuit becomes as shown in the Fig.5(b). When the switch is off, the sum total of inductor voltage and input voltage appear as the load voltage.. |
| (b) ON STATE: |
| In the ON state, the circuit diagram is as shown in Fig.5(c). When the switch is ON, the inductor is charged from the input voltage source Vg and the capacitor discharges across the load. The duty cycle, D=Ton/T where T=1/f. The relationship between input and output voltages is given by Eq.5. |
| Vo/Vg=1/(1-D)=M(Boost Factor) |
| The specifications of the necessary components selected for this work are given below: |
| (i) Boost Inductor =290 μH |
| (ii) Input Filter Capacitor=250 μF |
| (iii) MOSFET IRS045 |
| (iv) Resistive Load=35 Ω(SOLKAR) |
| (v) Output Filter Capacitor=330 μF |
| (vi) Switching Frequency= 10 kHz |
VI. MAXIMUM POWER POINT TRACKING |
| Maximum power point plays an important role in photovoltaic system because they maximize the power output from a PV system for a given set of conditions [6]-[7], and therefore maximize the array efficiency. The different methods used to track the maximum power point are: |
| (i) Perturb and Observe method |
| (ii) Incremental Conductance method |
| (iii) Parasitic Capacitance method |
| (iv) Constant Voltage method |
| (v) Intelligent Control methods (Fuzzy Logic, Artificial Neural Network and Genetic Algorithms etc) |
| 6.1 Perturb and Observation |
| The principle of P&O is to create a perturbation by decreasing or increasing the duty cycle of boost converter and then observing the direction of change of PV output [7]-[8]. If at any instant k, the output PV power P(k) & voltage V(k) are greater than the previous computed power P(k−1) & V(k-1), then the direction of perturbation is maintained, otherwise it is reversed. The flow chart of the P&O algorithm is shown in Fig.6. |
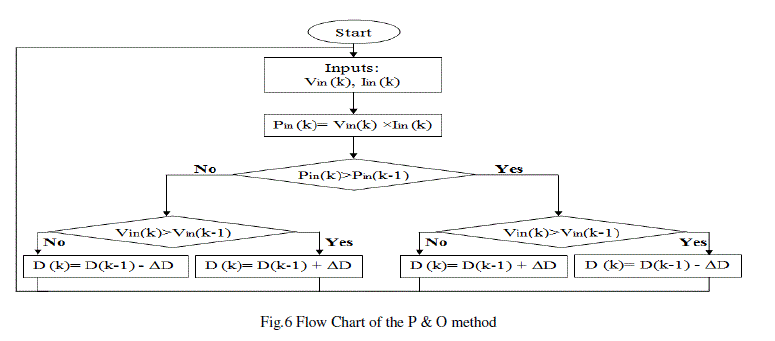 |
| Despite the P&O algorithm is easy to implement it has mainly the following drawbacks: |
| It cannot always operate at the maximum power point due to the slow trial and error process, and thus the maximum available solar energy from the PV arrays cannot be extracted all the time. |
| The PV system always operates in an oscillating mode which leads to the need of complicated input and output filters to absorb the harmonics generated. |
| 6.2. MPPT using Fuzzy Logic Control |
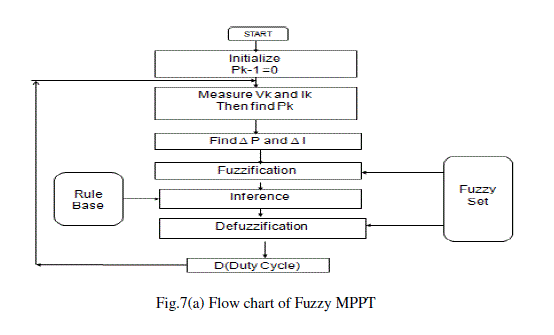
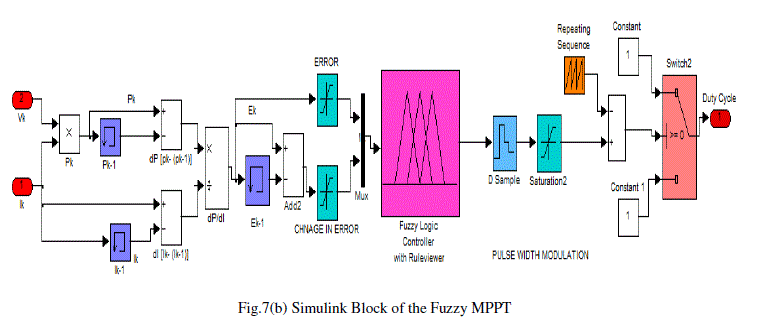
| Fuzzy logic is one of the most powerful control methods [9]. It is known by multi-rules-based resolution and multivariable consideration. Fuzzy MPPT is popular for over a decade. Fuzzy logic controllers have the advantages of working with imprecise inputs, no need to have accurate mathematical model, and it can handle the nonlinearity[10]- [12]. The flow chart of Fuzzy MPPT and Simulink model of proposed Fuzzy MPPT is shown in Fig.7(a) and Fig.7(b). It consists of two inputs and one output. The two FLC input variables are the error (E), change of error (CE) and output variable is duty cycle (D). |
 |
 |
| Using Fuzzy Logic Tool Box in MATLAB, membership functions and rule base are designed [13]. Fig.8(a), Fig.8(b) and Fig.8(c) represent the graphical view of the membership function for error, change of error and duty cycle of the fuzzy logic controller. |
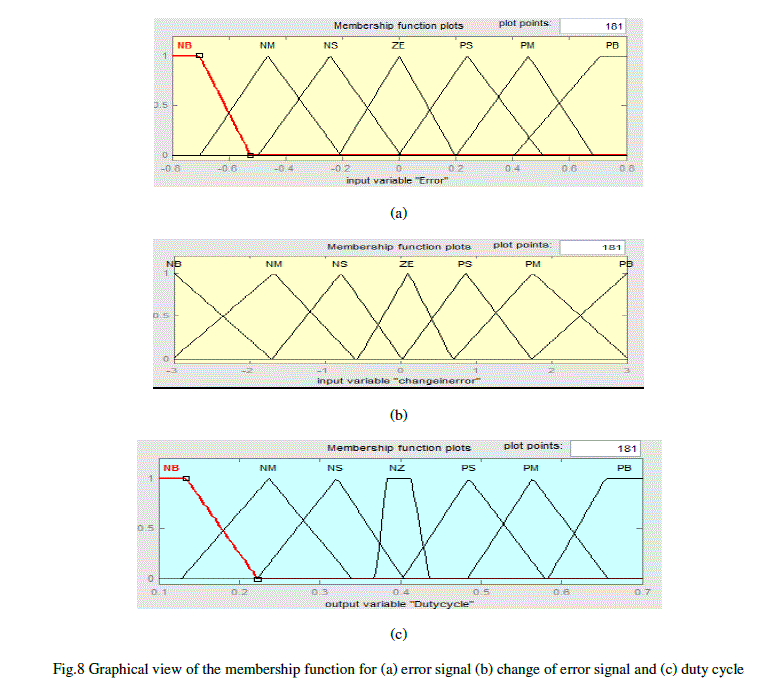 |
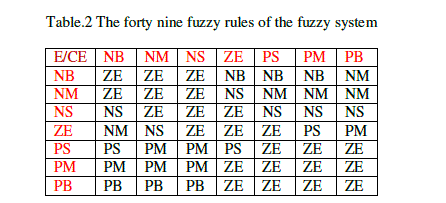
| For the rule settings of fuzzy logic MPPT, different number of subsets has been used. In the present case, seven subsets based forty nine rules have been used. The tuning of forty nine rules is quite time consuming but it represents better accuracy and dynamic response. The fuzzy rules are included in Table.2 |
 |
VII. SIMULATION RESULTS AND DISCUSSION |
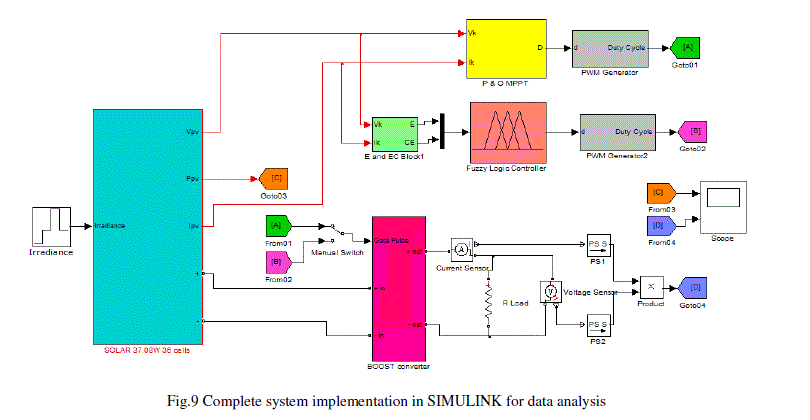
| The complete setup of the system for data collection, which includes PV module, boost converter, fuzzy based MPPT and DC load, has been given in Fig.9. Fig.9 represents the complete view of the system. |
 |
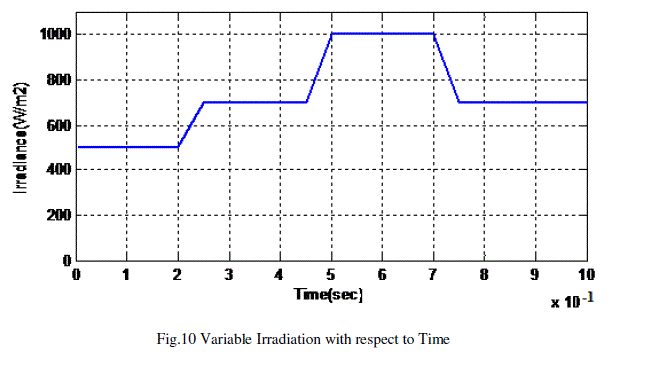
| An extensive simulation for both techniques has been done using MATLAB. Some selected results are presented with a comparison between fuzzy and P&O MPPT controllers. Fig. 10 shows the curve for variable irradiation with time. |
 |
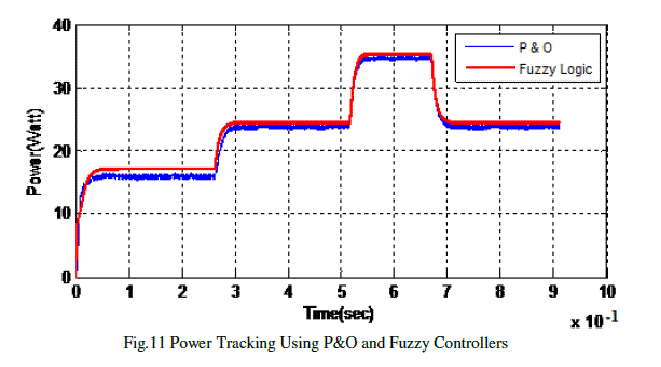
| Fig.11 shows the power curves which are tracked by fuzzy and P&O controllers. As shown fuzzy controller gives smother power signal line, less oscillation and better stable operating point than P&O |
 |
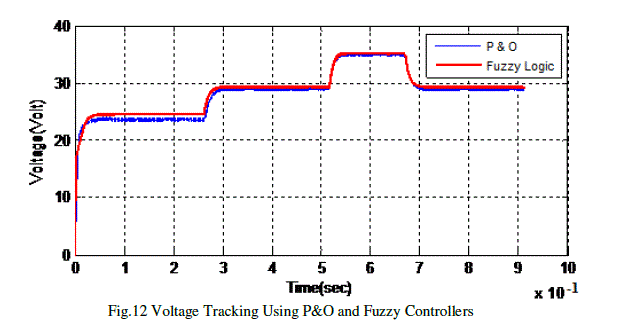
| Fig.12 shows the voltage curves which are tracked by fuzzy and P&O controllers. As shown fuzzy controller gives smother power signal line, less oscillation and better stable operating point than P&O. |
 |
| Fig.13 shows the current curves which are tracked by fuzzy and P&O controllers. As shown fuzzy controller gives smother power signal line, less oscillation and better stable operating point than P&O. |
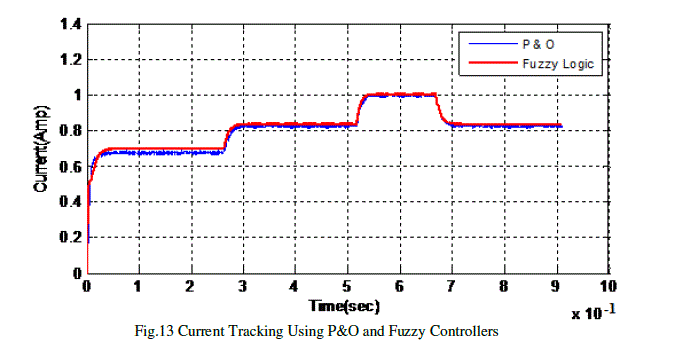 |
| From the simulation results, it can be deduced that the fuzzy controller gives better performance than P&O, and it has more accuracy for operating at Maximum Power Point. |
VIII. CONCLUSION |
| This paper presents a SIMULINK and SimElectronics based model for PV panel. It also included fuzzy based MPPT at varying irradiation. P&O and fuzzy logic controllers have been designed and simulated for the proposed PV system. Comparison of simulation results have been presented for different irradiation conditions. Fuzzy controller shows better performance with lower oscillation. |
References |
|