International Journal of Advanced Research in Electrical, Electronics and Instrumentation Engineering
ISSN ONLINE(2278-8875) PRINT (2320-3765)
ISSN ONLINE(2278-8875) PRINT (2320-3765)
| Anupam Srivastava* Dr. R.M.L. Avadh University, Faizabad (U.P.), India |
| Related article at Pubmed, Scholar Google |
Visit for more related articles at International Journal of Advanced Research in Electrical, Electronics and Instrumentation Engineering
The term Instrumentation amplifier is used to denote a high gain dc-coupled differential amplifier with single ended output. They can amplify small differential signals coming from transducers in which there may be a large common-mode signal or level. The use of instrumentation amplifier for strain measurement is discussed.
Keywords |
| OPAM, Filter, CMRR, Bode plot |
INTRODUCTION |
| Operational amplifier is a direct coupled amplifier to which negative feedback is added to control its overall response. The negative feedback does lower the gain, but in exchange it also improves other characteristics, most notably freedom from distortion and non-linearity, flatness of response (or conformity to some desired frequency response). As more negative feedback is used, the resultant amplifier characteristics become less dependent on the characteristics of the open loop amplifier and finally depend only on the properties of the feedback network itself. OPAMs (operational amplifiers) are typically used in this high-loop-gain limit with open-loop voltage gain (no feedback) of a million or so. |
| In Bode plot (gain vs. Frequency), one can see that the gain of an OPAM (or in general, any multistage amplifier) will begin to roll off at some frequency because of the low pass filters formed by signals of finite source impedance driving capacitive loads within the amplifier stages. An RC low pass filter has a phase shift. Now if we were to connect this amplifier as an open loop follower, for instance, it would oscillate. That is because the open-loop phase shift reaches 1800 at some frequency at which the gain is still greater than 1 (negative feedback becomes positive feedback at that frequency). |
| The criterion for stability against oscillation for a feedback amplifier is that its open-loop phase shift must be less than 1800 at the frequency at which the loop gain is unity. This criterion is hardest to satisfy when the amplifier is connected as a follower, since the loop gain then equals the open-loop gain, the highest it can be. Internally compensated OPAMs are designed to satisfy the stability criterion even when connected as followers, thus they are stable when connected for any closed-loop gain with a simple resistive feedback network. This is accomplished by deliberately modifying an existing internal roll-off in order to put the 3dB point at some low frequency typically 1Hz to 20 Hz (e.g. add enough capacitance at the point in the circuit that produces the initial 6dB/octave roll-off so that the open loop gain drops to unity at about the 3dB frequency of the ‘next natural’ RC filter). In this case the open loop phase shift is held at a constant 900 over most of the passband, increasing toward 1800 only as the gain approaches unity[1]. |
II. NEED OF INSTRUMENTATION AMPLIFIER |
| The term instrumentation amplifier is used to denote a high-gain dc-coupled differential amplifier with singleended output, high input impedance and high CMRR (Common Mode Rejection Ratio). They are used to amplify small differential signals coming from transducers in which there may be a large common mode signal or level[2]. An example is strain gauge[4]. |
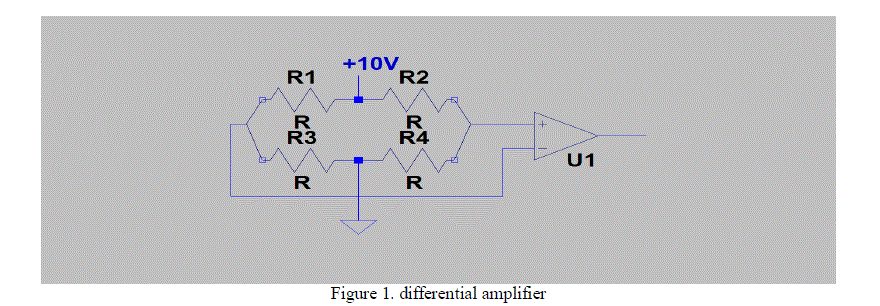 |
| A strain gauge is a bridge arrangement (figure 1) of resistors that converts strain (elongation) of the material (to which it is attached) into resistance changes.; the net result is a small change in differential output voltage. R~350 Ω but they are subjected to differing strains. The full scale sensitivity is 2mV per Volt so full scale output is 20mV for 10 Volts dc excitation. This small differential output voltage proportional to strain rides on a 5V dc level. The differential amplifier must have extremely good CMRR in order to amplify the millivolt differential signals while rejecting variations in the ~ 5V common mode signal. |
| As an example suppose maximum desired error is 0.1%. Because 0.1% full scale is 0.02mV (for 2mV/Volt sensitivity) riding on 5000mV. The CMRR would have to exceed 250,000 (5000/2x10-2) to 1 i.e. about 108 dB. And 0.05% accuracy requires minimum 114dB. So for good instrumentation, more generally high gain differencing amplifier is needed. Thus need to design an instrumentation amplifier arises which has high CMRR for example we require 100-120dB CMRR for strain gauge, 40dB CMRR is totally inadequate. |
III. DESIGN OF INSTRUMENTATION AMPLIFIER |
| Source impedance should be vey low (~25 Ω) in order to get a gain accuracy of 0.1%. A strain gauge for instance typically has a source impedance of ~350 ohms. To attain high imput impedance, add followers to the conventional differential amplifier (See fig. 2) |
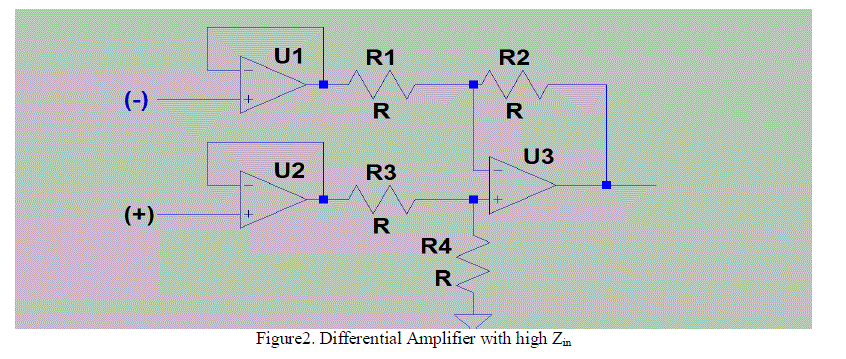 |
| The disadvantage with this amplifier is that it requires high CMRR in both the followers and in the final OPAM. So we design it as below (fig. 3) |
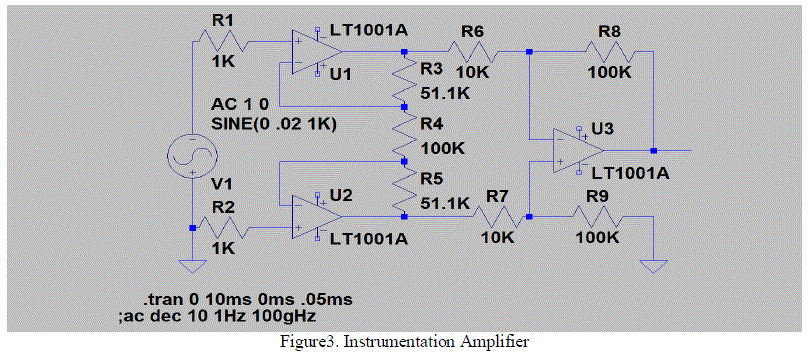 |
| Input stage of two OPAMs provides high differential gain and unity common mode gain. No close resistor matching is required. The input OPAMs must have high CMRR and they should be chosen carefully[3]. The gain is set by R4and R8 |
IV. EXPERIMENTAL |
| The instrumentation amplifier shown in figure 3 is simulated using LTSPICE. The +15V and -15V biasing voltages are not shown for the sake of clarity |
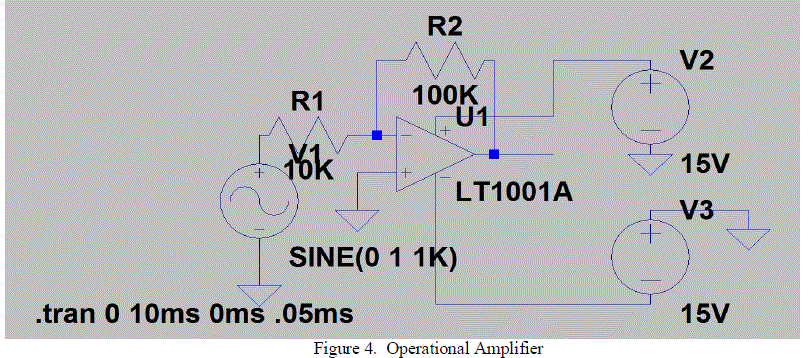 |
| The transient response of as shown opam (LT 100A ) is seen in figure 4. |
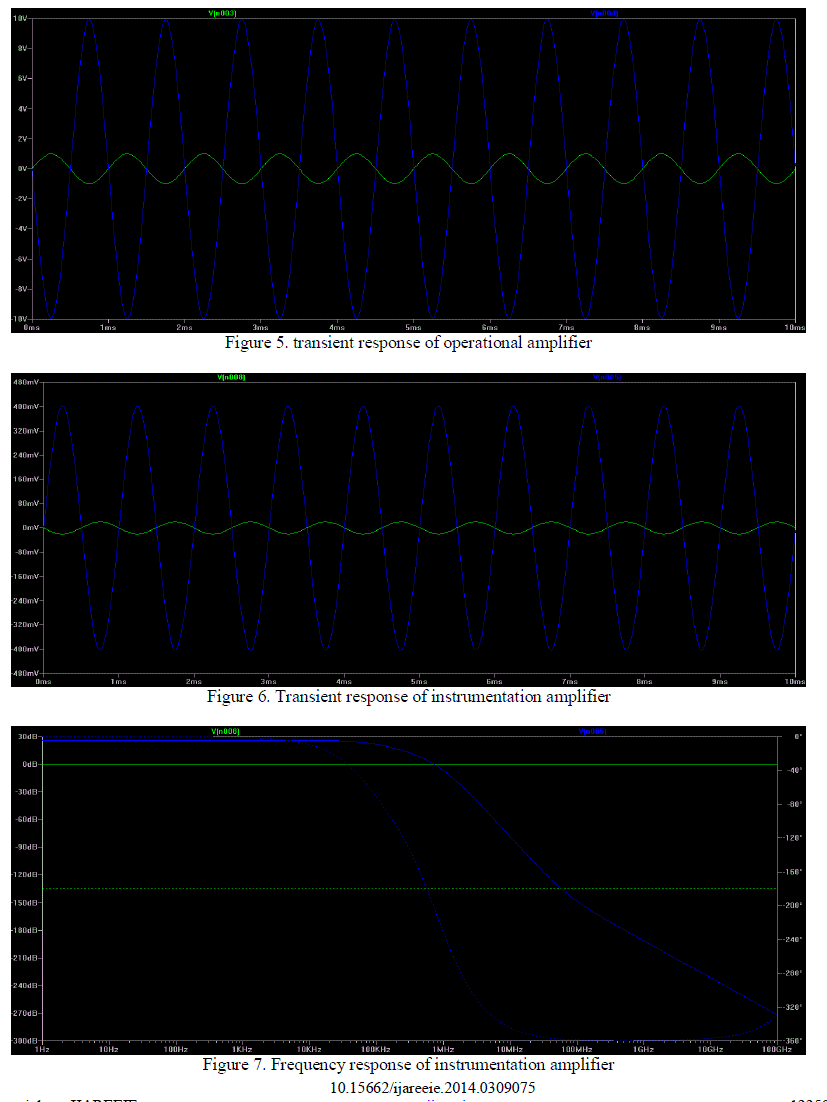 |
V.RESULT AND DISCUSSION |
| Figure 5. Shows that the gain of the opam is 10 whereas when the same amplifier is used in instrumentation amplifer, the gain of the latter becomes 20. The gain can be substantially increased because of high CMRR in the input stage (figures 6 & 7). The resistor matching in the output stage is not very crucial. The AC analysis of instrumentation amplifier shows that response is flat above 100kHz. Thus bandwidth is increased. The graph also predicts the phase variation with frequency. The ratio R2/R1 = R4/R3(figure. 2) must be maintained otherwise CMRR will degrade[3]. |
References |
|