ISSN ONLINE(2320-9801) PRINT (2320-9798)
ISSN ONLINE(2320-9801) PRINT (2320-9798)
Student of ME (VLSI and Embd. Sys.), Dept.of Electronics and Tele-Communication, S.V.I.T, Chincholi, Nashik, Pune University, India
| Vaibhavi Sunil Yardi |
| Student of ME (VLSI and Embd. Sys.), Dept.of Electronics and Tele-Communication, S.V.I.T, Chincholi, Nashik, Pune University, India |
| Related article at Pubmed, Scholar Google |
Visit for more related articles at International Journal of Innovative Research in Computer and Communication Engineering
A Home Energy Management (HEM) system plays a crucial role in realizing residential Demand Response programs in the smart grid environment. It provides a homeowner the ability to automatically perform smart load controls based on utility signals, customers preference and load priority. The HEMs communication time delay to perform load control is analyzed, along with its residual energy consumption. The main aim is to design how each load performs when being controlled by the HEM unit and measure electrical measurements for the different loads. Demand response (DR) is defined as changes in electricity use by demand-side resources from their normal consumption patterns in response to changes in the price of electricity. HEM system comprises an HEM unit that provides monitoring and control functionalities for a homeowner, and load controllers that gather electrical consumption data from selected appliances and perform local control based on command signals from the HEM system. A gateway, such as a smart meter, can be used to provide an interface between a utility and the data base for the electrical consumption is maintained.
KEYWORDS |
| Demand response (DR), home energy management (HEM), smart grid, home automation. |
INTRODUCTION |
| The worlds growing population and a growing global thirst for energy stands to escalate the situation, culminating in a perfect storm of economic, social and environmental pressures on scarce energy resources. In nearly every country, researchers expect existing energy production capabilities will fail to meet future demand without new sources of energy, including new power plant construction. However, these supply side solutions ignore another attractive alternative which is to slow down or decrease energy consumption through the use of technology to dramatically increase energy efficiency [1]. |
| The worlds growing population and a growing global thirst for energy stands to escalate the situation, culminating in a perfect storm of economic, social and environmental pressures on scarce energy resources. In nearly every country, researchers expect existing energy production capabilities will fail to meet future demand without new sources of energy, including new power plant construction. However, these supply side solutions ignore another attractive alternative which is to slow down or decrease energy consumption through the use of technology to dramatically increase energy efficiency [1]. |
| Today, interests in HEM systems have grown significantly. Various HEM systems are designed based on different communication schemes, such as ZigBee and power-line carrier. HEM system that can display energy usage information of individual appliances is proposed. Further an in-home energy management (iHEM) system to reduce energy expenses and peak loads is proposed. Scheduling and controlling in-home appliances to provide economic advantages for residential energy management is also focused. There is yet another implementation of an HEM system that can manage power-intensive loads to limit the household peak demand, while taking into account homeowners load priority and comfort preference. |
LITERATURE REVIEW |
| Traditionally in the US and in many parts of the world there is a persistent problem of inefficient use of electric power generation and transmission assets .For example in the Dominion Virginia Power’s service area, roughly 20 percent of generation assets are used 5 percent of the time. This problem has partially been tackled by demand side management, which was introduced in early 1980s. With the introduction of smart grid, it is now possible to perform demand response at customer premises to get a finer control of available resources [2]. |
Existing system |
| The earlier system comprised of demand response (DR) which is defined as âÃâ¬Ãâ¢changes in electricity use by demand-side resources from their normal consumption patterns in response to changes in the price of electricity, or to incentive payments designed to induce lower electricity use at times of high wholesale market prices or when system reliability is jeopardized. |
Proposed method |
| HEM system comprises an HEM unit that provides monitoring and control functionalities for a homeowner, and load controllers that gather electrical consumption data from selected appliances and perform local control based on command signals from the HEM system. A gateway, such as a smart meter, can be used to provide an interface between a utility and the data base for the electrical consumption is also maintained through internet. |
Smart Home Energy Management system based on ZigBee |
| Smart home energy management will require changes not only in the way energy is supplied, but in the way it is used, and reducing the amount of energy required to deliver various goods or services is essential. The smart energy market requires two types of ZigBee networks for device control and energy management. These include neighbourhood area networks for energy, using ZigBee for sub energy within a home or apartment, and using ZigBee to communicate to devices within the home. Recently, progress in personal home network device designs and wireless sensor network enables the Ubiquitous Computing environment. It is to become a reality. This model certifies to provide adaptive information and services to users anywhere anytime using different devices. ZigBee network model services have been proposed in different domains of our everyday life such as in homes, offices, streets, building and school. The wireless sensor network in the home area can be distributed in different various services throughout our daily lives. Developing assassin applications model and services for ubiquitous home network will confer important business value. A number of projects and research have developed ubiquitous home network models. Compared to traditional home networks, the in-progress ubiquitous home network collects user activity awareness, as well as physical sensing information in the home environment, to support more smart and well-being home services. It has the essential to easy control consumer home network services used in livelihood. Eventually, users will experience the convenience of performing ordinary life styles and increased satisfaction offered by adaptive home services [3]. |
Residential energy management |
| There are several projects that recently focus on residential energy management. SMART-A project investigates the use of smart appliances for energy management. User acceptance surveys and market research have been established in the project, discusses delaying the cycle of an appliance according to the local power generation (wind power) capacity of the house where demand delaying has also been pronounced in. However, these works do not consider TOU-awareness. TOU-aware appliance coordination with micro-FIT has been proposed in. In this scheme, an appliance communicates with a central energy manager when the consumer wants to start the appliance. The energy manager is able to get recent TOU information by communicating with the smart meter. The appliance does not communicate with the smart meter directly since the current implementations of most smart meters are not compatible with HAN communication technologies, they can only communicate with the utility Field Area Network (FAN). This study shows that appliance coordination can reduce consumer bills [4]. |
| Residential energy management has been a part of the smart home technologies which date back to 90s. Several related projects are the neural network house, the MAV Home project Microsoft EasyLiving project and UMASS IHome. These projects generally focus on inhabitant comfort, safety and elderly care. On the energy management side, some involve adjusting the lights according to the time of the day, the intensity of daylight and inhabitant preferences. However, smart grid provides new opportunities for more advanced residential energy management tools. Residential energy management has been neglected in the exiting power grid due to scalability concerns. However, in the smart grid, ICT technologies enable energy management for each individual residential unit. Utilities may remotely apply energy management in order to intentionally reduce peak load. This is generally meaningful when the grid faces a risk of failure but even though there is no failure risk, reducing the peak load is important because it results in less emissions and less expenses. For this reason, consumers may willingly reduce their peak consumption by the use of energy management schemes [5]. |
Load predictability and frequency analysis |
| One of the hypotheses presented in this paper is that it is possible to estimate the predictability of a load series by analysing its PSD. The use of other external variables to improve forecasting accuracy. To gain some perspective on the importance that frequency analysis has on load forecasting; let’s consider the load series as the sum of an unpredictable series and a predictable one. Then, it is obvious that the more similar the original series is to its predictable part, the more predictable the original series is. |
| Any predictable signal can be defined as a combination of a finite amount of periodical signals of known frequency and amplitude as opposed to an unpredictable one (white noise) which is a combination of infinite signals of different frequency and equal amplitude. By these definitions, frequency analysis gives us the tool to extract a predictable series by filtering a group of components of known frequency. This predictable series will be relevant compared to the original one if the power it carries is significant; however, it will be less predictable if the number of frequencies included is too high.In conclusion, if the load series has such an uneven PSD that few frequencies carry enough power to be relevant compared to the power of the original signal, then the signal will be predictable. Also we have the methodology used to obtain a numeric predictability estimator based on the PSD of the original series. |
Temperature influence on load |
| The influence of the weather on electricity consumption has been widely discussed.. In this section, we will focus on the effect of temperature although any other variable can be analyzed in the same way.Temperature can generally be accepted as a major factor driving load; however, it is important to understand precisely how temperature affects electrical load. Variations in temperature usually cause variations in power consumption but the magnitude of this influence may be altered by factors like the day of the week or the time of the day. For instance, the load of a Sunday may be affected by a heat wave differently than that of a Thursday would be. Also, a temperature drop at 4 a.m. may not cause the same behaviour than one occurring at noon. We can see how load is affected differently by temperature depending on the time of day and the day of the week [6]. |
| Predictability is highly related to correlation. Two highly correlated series may be accurate predictors for each other. Therefore, if temperature is highly correlated to load, its use in load forecasting would improve the accuracy of the forecast. However, the nonlinear behaviour makes raw temperature data on its own insufficient to be used in load forecasting. Therefore, it is necessary to contextualize the temperature data and create an additional time-series that can be used as an input for the forecasting model.This problem has been tackled following different approaches. The scope of this paper is not to determine which approach is best but to provide with a methodology capable of using the aforementioned time-series to estimate the predictability of the load series. Therefore, the function defined throughout is used. This method is simple and easy to apply to time-series of any other nature (electricity prices, humidity, etc.) that may be considered as load driving factors. This function can be determined from recent historical data and its addition to the data base would provide with an alternate load series whose correlation with the original one may be used as a load predictor. |
| In conclusion, in order to use temperature in load forecasting it is advised to pre-process the data to eliminate nonlinearities and contextualize the data. The approach taken is to obtain a surrogate load data series built from both temperature and load historical data which includes the contextualized effect of temperature in load. The similarity (mean absolute percentage difference) between this surrogate series and the original one determines how predictability improves by including temperature data. |
Household Energy Consumption Segmentation Using Hourly Data |
| The increasing deployment of residential advanced metering infrastructure (AMI) has made hourly energy consumption data widely available. Using CA smart meter data, we investigate a household electricity segmentation methodology that uses an encoding system with a pre-processed load shape dictionary. Structured approaches using features derived from the encoded data drive five sample program and policy relevant energy lifestyle segmentation strategies. We also ensure that the methodologies developed scale to large data sets. |
| The widespread deployment of advanced metering infrastructure (AMI) has made available concrete information about user consumption from smart meters. Household load shapes reveal significant differences among large groups of households in the magnitude and timing of their electricity consumption. Hourly smart meter data offers a unique opportunity to understand a household’s energy use lifestyle. Further, this consumption lifestyle information has the potential to enhance targeting and tailoring of demand response (DR) and energy efficiency (EE) programs as well as improving energy reduction recommendations. According to the Federal Energy Regulatory Commission, DR is defined as: âÃâ¬Ãâ¢Changes in electric use by end-use customers from their normal consumption patterns in response to changes in the price of electricity over time, or to incentive payments designed to induce lower electricity use at times of high wholesale market prices or when system reliability is jeopardized.âÃâ¬Ãâ |
IMPLEMENTATION |
Description |
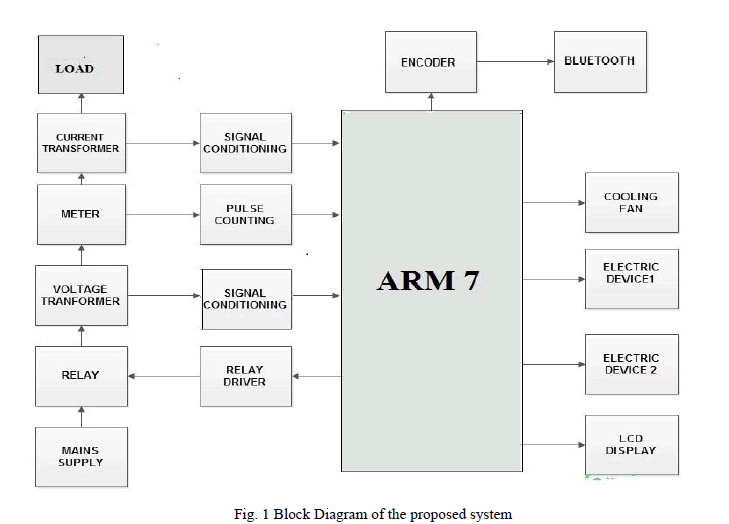
| Here we have designed an HEM (Home Energy Management) system which has ARM 7 as its major component. ARM 7 is connected with electrical devices, current and voltage transformers and relay and relay drivers. Here the parameters such as voltage and current that are consumed by the electrical devices are measured with the help of the meter and displayed on the LCD display. We have to first find out the power consumption of all the electrical devices in the house and then on adding all we will get the total power consumption. As now as we have got the total power consumption we can distribute the available that is the mains supply among the devices according to their needs. Also if at some part of the day if a particular device is not required then the supply of that device can be transferred to other device which requires more supply. Then there is also a control section which consists of a mobile and bluetooth device. So the basic communication between the HEM system and the control section is through bluetooth. The HEM unit informs the status of all the devices with the help of bluetooth to the home owner who has the mobile [7]. |
Block Diagram |
 |
 |
The Design of HEM |
| In this demonstration, we assume that a utility’s DR event signal sent to a home comprises the demand limit amount (kW) and the duration of a DR event (hours). The demand limit specifies the maximum electric power consumption that is allowed by a house for the entire DR event duration. The embedded HEM algorithm considers that controllable loads in a house are of four types: water heater (WH), air conditioner (AC), clothes dryer and electric vehicle (EV) [5]. |
| Step 1: The HEM load management algorithm starts by gathering system information: |
| 1) The demand limit in kW and its duration. |
| 2) Appliance power consumption in kW. |
| 3) Room, ambient and hot water temperatures in F. |
| 4) Load priorities and customer preference settings. |
| Step 2: The HEM algorithm then checks for both demand limit and comfort level violations. For the demand limit violation, the HEM algorithm checks if the total household consumption exceeds the specified demand limit level. For the comfort level violations, for example the HEM algorithm checks: |
| 1) For WH, if the hot water temperature falls outside the preset threshold. |
| 2) For AC, if the room temperature falls outside the preset threshold. |
| 3) For a clothes dryer, if the clothes dryer can finish its job before the specified completion time. |
| 4) For EV, if the EV can be fully charged before the specified charging completion time. |
| Step 3: If there is any comfort level violation, the HEM unit decides on the status of each appliance based on the requested demand limit level. With the demand limit violation, the HEM unit sends command signal(s) to turn OFF selected appliances according to their priority, as necessary. With any comfort level violations, selected appliances will be turned ON in order to keep their comfort levels within their pre-specified ranges. In this case, the HEM unit will go through a decision-making process to ensure that the total household power consumption- with additional appliances turning ON—will not exceed the demand limit [8]. |
RESULTS |
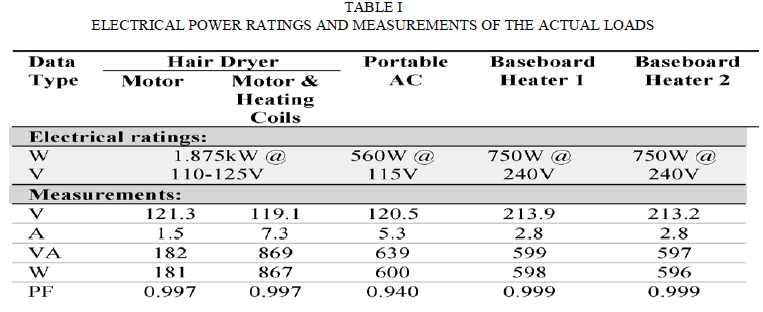
| The power ratings, together with the electrical measurement data, of all four loads used in the experiment are summarized in Table I. The power consumption of the hair dryer is lower than its rating because the low heat setting is used in the experiment. |
 The house parameters are presented in Table II, including the total house size in ft; areas of wall, ceiling, and window of the house in ft and; the heat resistance of the wall, ceiling and window in ft and; and number of people living in the house. The house parameters are presented in Table II, including the total house size in ft; areas of wall, ceiling, and window of the house in ft and; the heat resistance of the wall, ceiling and window in ft and; and number of people living in the house. |
 |
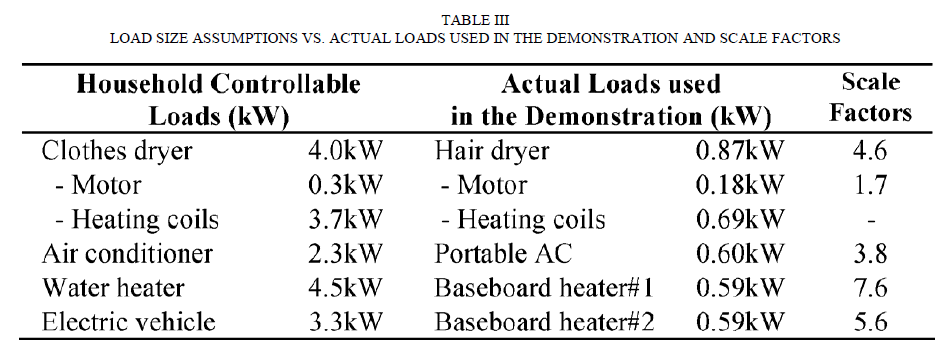
| Controllable loads in this house are a water heater, an AC unit, a clothes dryer, and an electric vehicle. In our laboratory set up, we represent a clothes dryer by a hair dryer; use a real AC unit; represent a WH by an electric baseboard heater; and represent an electric vehicle by another electric baseboard heater. See Table III for the load size comparison. To demonstrate the household DR action using the proposed HEM system, HEM’s load controllers measure the electrical data (V, I, W, VA, PF) of the hair dryer, the AC, and two electric baseboard heaters in real time. Then, the scale factors as shown in Table III are used to scale up these measurements so that they represent the electrical consumption of four controllable loads in the hypothetical house. The HEM then determines the total household consumption (kW) by adding these scaled-up measurements, together with the assumed critical load data from the reload database. Also, we assume that: a) the AC cooling capacity is 34 000 BTU; b) the WH tank size is 80 gallons; c) the clothes dryer needs 60 min to complete its clothes drying job; and d) the EV needs 90 min to fully charge its battery. |
 |
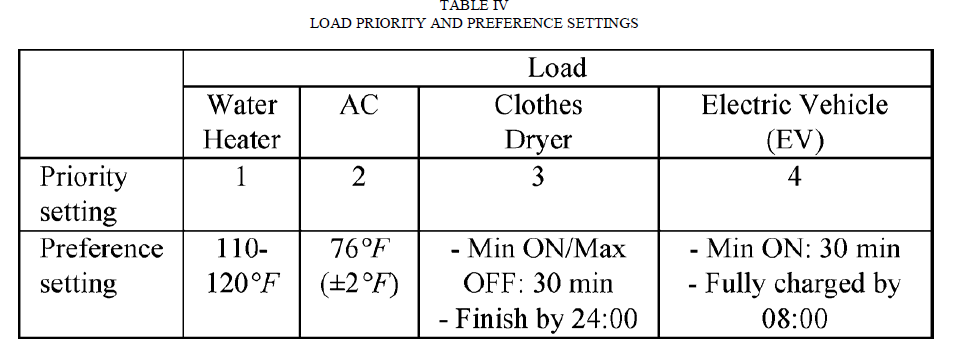
| The load priority assumptions are that the water heater has higher priority than AC; the AC has higher priority than the clothes dryer; and the clothes dryer has higher priority than electric vehicle. See Table IV, the comfort level setting assumptions are as follows: the hot water temperature should be between 110–120 F; and the room temp should be between 74–78 F. For the clothes dryer, the heating coils’ minimum ON time limit is specified at 30 min; the heating coil OFF time limit is set at 30 min to prevent excessive heat loss; and it must finish its drying job by midnight. For the electric vehicle, the minimum electric vehicle charging time of 30 min is specified before the electric vehicle charging status can be on hold; and it must be fully charged by 08:00 in the morning. These preference settings are allowed to be violated if operation of any appliance of higher priority is required to maintain a specific preference set. |
 |
CONCLUSION |
| Thus we have designed an HEM system; also we have observed the performance of each load when being controlled by the HEM unit. HEM unit has recorded electrical measurements of different loads and has also achieved power distribution according to device requirement. |
References |
|