Keywords
|
| Wireless network security, spoofing attack, attack detection, localization |
INTRODUCTION
|
| The wireless transmission medium, adversaries can monitor any transmission. Further, adversaries can easily purchase low-cost wireless devices and use these commonly available platforms to launch a variety of attacks with little effort. Among various types of attacks, identity-based spoofing attacks are especially easy to launch and can cause significant damage to network performance. For instance, in an 802.11 network, it is easy for an attacker to gather useful MAC address information during passive monitoring and then modify its MAC address by simply issuing an ifconfig command to masquerade as another device. In spite of existing 802.11 security techniques including Wired Equivalent Privacy (WEP), WiFi Protected Access (WPA), or 802.11i (WPA2), such methodology can only protect data frames—an attacker can still spoof management or control frames to cause significant impact on networks. |
| Spoofing attacks can further facilitate a variety of traffic injection attacks, such as attacks on access control lists, rogue access point (AP) attacks, and eventually Denial-of- Service (DoS) attacks. A broad survey of possible spoofing attacks can be found. Moreover, in a large-scale network, multiple adversaries may masquerade as the same identity and collaborate to launch malicious attacks such as network resource utilization attack and denial-of-service attack quickly. Therefore, it is important to 1) detect the presence of spoofing attacks, 2) determine the number of attackers, and 3) localize multiple adversaries and eliminate them. |
| Most existing approaches to address potential spoofing attacks employ cryptographic schemes. However, the application of cryptographic schemes requires reliable key distribution, management, and maintenance mechanisms. It is not always desirable to apply these cryptographic methods because of its infrastructural, computational, and management overhead. To use received signal strength (RSS)-based spatial correlation, a physical property associated with each wireless node that is hard to falsify and not reliant on cryptography as the basis for detecting spoofing attacks. |
| It first divides the network into a set of zones, establish trust levels for each zone, and detect untrustworthy zones by using the Sequential Probability Ratio Test (SPRT).When multiple nodes are compromised in one zone; they can all be detected and revoked at one time. The SPRT decides a zone to be untrustworthy if the zone’s trust is continuously maintained at low level or is quite often changed from high level to low level. |
PRELIMINARIES
|
| The main contributions of the work are: 1) GADE: a generalized attack detection model (GADE) that can both detect spoofing attacks as well as determine the number of adversaries using cluster analysis methods grounded on RSSbased spatial correlations among normal devices and adversaries; and 2) IDOL: an integrated detection and localization system that can both detect attacks as well as find the positions of multiple adversaries even when the adversaries vary their transmission power levels. |
GENERALIZED ATTACK DETECTION MODEL
|
| In GADE, the Partitioning Around Medoids (PAM) cluster analysis method is used to perform attack detection. We formulate the problem of determining the number of attackers as a multiclass detection problem. We then applied cluster-based methods to determine the number of attacker. |
Localization of Attackers
|
| Identify the positions of multiple adversaries even whenthe adversaries vary their transmission power levels.The main contribution of the paper is organized areas follows: |
| - To effectively detect the presence of spoofing attack |
| - To count the number of attackers |
| - To identify the location of multiple adversaries inthe network |
| - To provide solution to identify adversaries in the network where in there is no additional cost or modification to the wireless devices themselves |
| - To avoid authentication key management |
| - To avoid overhead |
| - To develop a mechanism where in there is low false positive rate |
Attack Detection Using Cluster Analysis
|
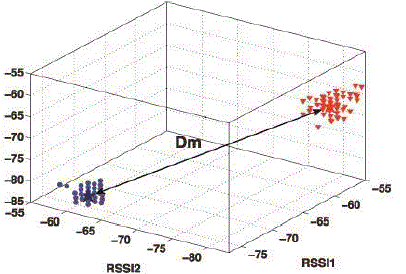
| The RSS-based spatial correlation inherited from wireless nodes to perform spoofing attack detection. It also showed that the RSS readings from a wireless node may fluctuate and should cluster together. In particular, the RSS readings over time from the same physical location will belong to the same cluster points in the n-dimensional signal space, while the RSS readings from different locations over time should form different clusters in signal space. |
| In Fig. 2.1, which presents RSS reading vectors of three landmarks (i.e., n = 3) from two different physical locations. Under the spoofing attack, the victim andthe attacker are using the same ID to transmit data packets, and the RSS readings of that ID is the mixture readings measured from each individual node (i.e., spoofing node or victim node). |
| Thus formulate spoofing detection as a statistical significance testing problem, where the null hypothesis is H0 : normal (no spoofing attack): |
| In significance testing, a test statistic Tis used to evaluatewhether observed data belong to the null-hypothesis or not. |
DETERMINING THE NUMBER OF ATTACKERS
|
Problem Formulation
|
| The Precision is defined as |
 |
| F-measure : F-measure is originated from informationretrieval and measures the accuracy of a test by considering both the Hit Rate and the Precision . |
 |
| Multiclass ROC graph: We further use the multiclass ROC graph to measure the effectiveness of our mechanisms. Particularly, we use two methods :class- reference basedandbenefit error based. The class-reference-based formulation produces C different ROC curves when handling C classes based on Pi and Ni. Further, in the C- class detection problem, the traditional 2 x2 confusion matrix, including True Positives, False Positives, False Negatives, and True Negatives, becomes an C x C matrix, which contains the C benefits (true positives) and C2 - C possible errors (false positives). The benefit-error-based method is based on the C x C matrix. For example, when C = 3 with possible number of attackers of {2,3,4}, the benefits are 3 and the possible errors are 6. |
Silhouette Plot
|
Attacker Number Determination
|
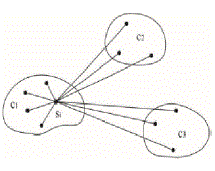
| A Silhouette Plot is a graphical representation of a cluster. To determine the number of attackers, we construct Silhouettes in the following way: the RSS sample points S= {s1,...,sN}(with N as the total number of samples) are the dataset and we let C=(c1,...,cK)be its clustering into K clusters, as shown in Fig. 8. Let d(sk,sl)be the distance between skand sl. Let cj=(sj 1,...,sj mj)be the jth cluster, j =1,...,K , where mj=|cj|. |
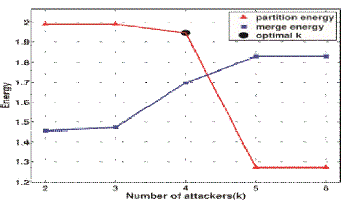
| Based on this observation, we developed SILENCE,testingSILhouette Plot and System EvolutioN with minimum distanCE of cluster, which evaluates the minimum distance between clusters on top of the pure cluster analysis to improve the accuracy of determining the number of attackers. Additionally, when the training data are available. |
Support Vector Machines-Based Mechanism
|
| Provided the training data collected during the offline training phase, we can further improve the performance of determining the number of spoofing attackers. In addition, given several statistic methods available to detect the number of attackers, such as System Evolution and SILENCE, we can combine the characteristics of these methods to achieve a higher detection rate.using Support Vector Machines to classify the number of the spoofing attackers. The advantage of using SVM is that it can combine the intermediate results (i.e., features) fromdifferent statistic methods to build a model based on training data to accurately predict the number of attackers. |
IDOL: INTEGRATED DETECTION ANDLOCALIZATION FRAMEWORK
|
| IDOL: an Integrate Detecti On and Localization system that can both detect attacks as well as find the positions of multiple adversaries even when the adversaries vary their transmission power levels. |
DRAWBACKS
|
| ? The existing detection mechanism is highly effective in both detecting the presence of attacks but considers all the location as single zone. |
| ? Location information taken from victim as well as adversaries is directly taken from the corresponding nodes themselves. Not the neighbor nodes are queried for their location information. i.e., the spatial readings from node to base station alone are taken. |
| ? Since the approach requires fixed node locations, it cannot be used when nodes are expected to move. |
PROPOSED SYSTEM
|
| The proposed system work is motivated from mitigating the limitations of previous schemes. In particular, the new system proposes a method in which the nodes are fixed as well as in movement. A reputation-based trust management scheme is designed to facilitate fast detection of compromised nodes. The key idea of the scheme is to detect untrustworthy zones and perform software attestation against nodes in these zones to detect and revoke the ones that are compromised. |
| Specifically, first divides the network into a set of zones, establish trust levels for each zone, and detect untrustworthy zones by using the Sequential Probability Ratio Test (SPRT). The SPRT decides a zone to be untrustworthy if the zone’s trust is continuously maintained at low level or is quite often changed from high level to low level. once a zone is determined to be untrustworthy, the base station or the network operator performs software attestation against all nodes in the untrustworthy zone, detects compromised nodes with subverted software modules, and physically revokes them. |
| In addition, a novel mobile replica detection scheme is proposed based on the Sequential Probability Ratio Test (SPRT). The new system uses the fact that an uncompromised mobile node should never move at speeds in excess of the system-configured maximum speed. As a result, a benign mobile sensor node’s measured speed will nearly always be less than the system-configured maximum speed as long as it employs a speed measurement system with a low error rate. the other hand, replica nodes are in two or more places at the same time. This makes it appear as if the replicated node is moving much faster than any of the benign nodes, and thus the replica nodes?? measured speeds will often be over the system-configured maximum speed. |
ADVANTAGES
|
| ? By detecting an entire zone at once, the system can identify the approximate source of bad behavior and react quickly, rather than waiting for a specific node to be identified. |
| ? When multiple nodes are compromised in one zone, they can all be detected and revoked at one time. |
| ? The proposed system validates the effectiveness, efficiency, and robustness of the scheme through analysis and simulation experiments. |
| ? The new system finds that the main attack against the SPRT-based scheme is when replica nodes fail to provide signed location and time information for speed measurement. |
| ? To overcome this attack, the new system employs a quarantine defense technique to block the noncompliant nodes. |
| ? It provides analyses of the number of speed measurements needed to make replica detection decisions, which shows is quite low, and the amount of overhead incurred by running the protocol. |
SYSTEM IMPLEMENTATION MODULE
|
| The below modules are used in project. They are |
SPOOFING ATTACK DETECTION
|
| In this module, spoofing attack detection is found out. To study Received Signal Strength (RSS), a property closely correlated with location in physical space and is readily available in the existing wireless networks. The RSS readings at the same physical location are similar, whereas the RSS readings at different locations in physical space are distinctive. Thus, the RSS readings present strong spatial correlation characteristics. |
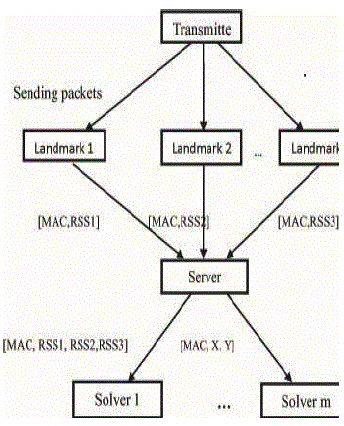
| The Received Signal Strength value vector as s = (s1, s2,...sn) where n is the number of landmarks/access points that are monitoring the RSS of the wireless nodes and know their locations. Generally, the RSS at the ith landmark from a wireless node is distributed as |
| Si (dj) [dBm] = P (d0) [dBm] - 10 log (dj/d0) + Xi |
| where P(d0) represents the transmitting power of the node at the reference distance d0, dj is the distance between the wireless node j and the ith landmark, and the path loss exponent, Xi is the shadow fading which is given as input. For simplicity, the wireless nodes have the same transmission power. If the received signal strength does not match in successive RSS values, then the node is said to be malicious. |
MOBILE NODE NETWORK CREATION
|
| In this module, a form is generated which contains a text box to get node id and the id is saved in to „Nodes?? table. During network creation, the nodes with id will be displayed in random X and Y position. The base station node is need not be displayed as it is programmatically listens and updates the location information of all the nodes when they are in movement. |
MOBILE MOVEMENT (RANDOM WALK) WITHIN GIVEN SPEED
|
| In this module, all the nodes are roaming in any directions (their walk is updated by incrementing x-axis or y-axis or both at a movement with any number of pixels within the specified maximum limit. In practical situation, the nodes can move with their physical capabilities. For sake of convenience, if the nodes reach the picture box limit, then they move in opposite direction so that they roam in the rectangular boundary of the picture box control. |
UPDATE LOCATION INFORMATION TO ITS NEIGHBORS
|
| In this module, all the nodes are calculating the neighbor nodes with their transmission range (specified in „n?? units common for all nodes. It means than all the sensor nodes are having homogeneous transmission ranges). Then it gives the location information i.e., its position to all of its neighbors. It occurs for all the nodes at regular intervals. The timer control is provided and the time is considered in global aspect. All the nodes are having unique time values. |
BASE STATION UPDATES LOCATION INFORMATION OF ALL NODES
|
| In this module, the base station is collecting the location information from all nodes. It occurs for all the nodes at regular intervals. It is assumed that no two nodes are in same location since the nodes purpose is to serve individually a specific area. |
REPLICATE NODE
|
| In this module, the node is updating its location information to base station with one of the remaining nodes. It means that it is replicating some other node. This result in, at a given time, both the nodes are sending same location information to the base station of which one is true and other is false. |
BASE STATION IDENTIFIES THE MOBILE REPLICATION ATTACK
|
| This module presents the details of the technique to detect replica node attacks in mobile sensor networks. In static sensor networks, a sensor node is regarded as being replicated if it is placed in more than one location. If nodes are moving around in network, however, this technique does not work, because a benign mobile node would be treated as a replica due to its continuous change in location. |
CONCLUSION
|
| This project proposed to use received signal strength-based spatial correlation, a physical property associated with each wireless device that is hard to falsify and not reliant on cryptography as the basis for detecting spoofing attacks in wireless networks. It provided theoretical analysis of using the spatial correlation of RSS inherited from wireless nodes for attack detection. It derived the test statistic based on the cluster analysis of RSS readings. The approach can both detects the presence of attacks as well as determine the number of adversaries, spoofing the same node identity, so that can localize any number of attackers and eliminate them. |
| In addition, a zone-based node compromise detection scheme is proposed using the Sequential Probability Ratio Test (SPRT). Furthermore, several possible attacks are described against the proposed scheme and proposed countermeasures against these attacks. The scheme is evaluated in simulation under various scenarios. The experimental results show that the scheme quickly detects untrustworthy zones with a small number of zone-trust reports. |
| |
Tables at a glance
|
 |
| Table 1 |
|
| |
Figures at a glance
|
 |
 |
 |
 |
| Figure 1 |
Figure 2 |
Figure 3 |
Figure 4 |
|
| |
References
|
- Bellardo J. and Savage S. (2003) “802.11 Denial-of-Service Attacks:Real Vulnerabilities and Practical Solutions”, Proc. USENIX Security Symp, pp. 15-28.
- Bohge M. and Trappe W. (2003) “An Authentication Framework for Hierarchical Ad Hoc Sensor Networks”, Proc. ACM Workshop Wireless Security (WiSe), pp. 79-87.
- Brik V., Banerjee S., Gruteser M. and Oh s. (2008) “Wireless Device Identification with Radiometric Signatures” ,Proc. 14th ACM Int’l Conf. Mobile Computing and Networking, pp. 116-127.
- Chen Y., Trappe W., and Martin R.P. (May 2007) “Detecting and Localizing Wireless Spoofing Attacks”, Proc. Ann. IEEE Comm. Soc. Conf. Sensor, Mesh and Ad Hoc Comm. and Networks, pp.5-10.
- Chen Y., Kleisouris K., Li X., Trappe W. and Martin R.P. (2006 ) “The Robustness of Localization Algorithms to Signal Strength Attacks: A Comparative Study”, Proc. Int’l Conf. Distributed Computing in Sensor Systems (DCOSS), pp. 546-563.
- Faria D. and Cheriton D. (2006) “Detecting Identity-Based Attacks in Wireless Networks Using Signalprints”, Proc. ACM Workshop Wireless Security (WiSe).
- Ferreri F., Bernaschi M., and Valcamonici L. (2004) “Access Points Vulnerabilities to Dos Attacks in 802.11 Networks”, Proc. IEEE Wireless Comm. and Networking Conf.
- Franc V. and Hlava´c V. ( 2002 ) “Multi-Class Support Vector Machine”,Proc. Int’l Conf. Pattern Recognition (ICPR), vol. 16, pp. 236-239.
- Guo F. and Chiueh T.( 2006) “Sequence Number-Based MAC Address Spoof Detection”, Proc. Eighth Int’l Conf. Recent Advances in Intrusion Detection,pp. 309-329.
- Li Q. and Trappe W. (2006) “Relationship-Based Detection of Spoofing- Related Anomalous Traffic in Ad Hoc Networks”, Proc. Ann. IEEE Comm. Soc. on IEEE and Sensor and Ad Hoc Comm. and Networks, pp.6-8.
- Sang L. and Arora A. (2008) ”Spatial Signatures for Lightweight Security in Wireless Sensor Networks”, Proc. IEEE INFOCOM, pp. 2137-2145.
- Sheng Y., Tan K., Chen G., Kotz D. and Campbell A. (2008) “Detecting 802.11 MAC Layer Spoofing Using Received Signal Strength”, Proc. IEEE INFOCOM.
- Wool A. (2005) “Lightweight Key Management for IEEE 802.11 Wireless Lans With Key Refresh and Host Revocation”, ACM/Springer Wireless Networks, vol. 11, no. 6, pp. 677-686.
- Wu B., Wu J., Fernandez E. and Magliveras S. (2005) “Secure and Efficient Key Management in Mobile Ad Hoc Networks”, Proc. IEEE Int’l Parallel and Distributed Processing Symp. (IPDPS).
- Wang k. (2007) “Estimating the Number of Clusters via System Evolution for Cluster Analysis of Gene Expression Data”,Technical Report NO. 2007-258, Computer Science Dept., Xidian Univ., P.R. China.
|