Digital Image forgery is very common nowadays and is done without much difficulty with the help of powerful image editing software’s mainly to cover up the truthfulness of the photographs which often serve as evidence in courts. In this paper, we propose a forgery detection method to expose the photographic manipulations known as image composition or splicing by exploiting the color inconsistencies in the illuminated image. For this, effective illuminant estimators are used to obtain illuminant estimates of the image from which texture and edge based features are extracted. The features are used for automatic decision making and finally Extreme Learning machine (ELM) is applied to classify the forged image from the original one.
INTRODUCTION |
IMAGE FORGERIES AND DETECTION |
| Digital image processing is the use of computer algorithms to perform image processing on digital images. As
a subcategory or field of digital signal processing, digital image processing has many advantages over analog image
processing. It allows a much wider range of algorithms to be applied to the input data and can avoid problems such as
the build-up of noise and signal distortion during processing. Since images are defined over two dimensions (perhaps
more) digital image processing may be modelled in the form of multidimensional systems. |
| Nowadays, millions of digital documents are produced by a variety of devices and distributed by newspapers,
magazines, websites and television. In all these information channels, images are a powerful tool for communication.
Unfortunately, it is not difficult to use computer graphics and image processing techniques to manipulate images.
However, before thinking of taking appropriate actions upon a questionable image, one must be able to detect that an
image has been altered. Image composition (or splicing) is one of the most common image manipulation operations
when assessing the authenticity of an image, forensic investigators use all available sources of tampering evidence.
Among other telltale signs, illumination inconsistencies are potentially effective for splicing detection: from the
viewpoint of a manipulator, proper adjustment of the illumination conditions is hard to achieve when creating a
composite image. Thus illuminant color estimates from local image regions are analyzed and illumination map is
obtained as a result. As it turns out, this decision is, in practice, often challenging. Moreover, relying on visual
assessment can be misleading, as the human visual system is quite inept at judging illumination environments in
pictures. Thus, it is preferable to transfer the tampering decision to an objective algorithm. In this work, an important
step towards minimizing user interaction for an illuminant-based tampering decision-making is achieved. Hence a new
semiautomatic method that is also significantly more reliable than earlier approaches is proposed. Quantitative
evaluation shows that the method achieves a detection rate higher than the previous approaches. We exploit the fact
that local illuminant estimates are most discriminative when comparing objects of the same (or similar) material. Thus,
we focus on the automated comparison of human skin, and more specifically faces, to classify the illumination on a pair
of faces as either consistent or inconsistent. User interaction is limited to marking bounding boxes around the faces in
an image under investigation. In the simplest case, this reduces to specifying two corners (upper left and lower right) of
a bounding box. |
DENSE LOCAL ILLUMINANT ESTIMATION |
| To compute a dense set of localized illuminant color estimates, the input image is segmented into superpixels,
i.e., regions of approximately constant chromaticity. |
| In this section we define a predicate, D, for evaluating whether or not there is evidence for a boundary between
two components in segmentation (two regions of an image). This predicate is based on measuring the dissimilarity
between elements along the boundary of the two components relative to a measure of the dissimilarity among
neighbouring elements within each of the two components. The resulting predicate compares the inter-component
differences to the within component differences and is thereby adaptive with respect to the local characteristics of the
data. We define the internal difference of a component C≤V to be the largest weight in the minimum spanning tree of
the component, MST(C,E). That is, |
 (1) (1) |
| One intuition underlying this measure is that a given component C only remains connected when edges of
weight at least Int(C) are considered. We define the difference between two components C1,C2≤V to be the minimum
weight edge connecting the two components. That is, |
 (2) (2) |
| If there is no edge connecting C1 and C2 we let Dif (C1,C2) = 1. This measure of difference could in principle
be problematic, because it reflects only the smallest edge weight between two components. In practice we have found
that the measure works quite well in spite of this apparent limitation. Moreover, changing the definition to use the
median weight, or some other quantile, in order to make it more robust to outliers, makes the problem of finding a good
segmentation NP-hard, as discussed in The region comparison predicate evaluates if there is evidence for a boundary
between a pair or components by checking if the difference between the components, Dif (C1,C2), is large relative to
the internal difference within at least one of the components, Int(C1) and Int(C2). A threshold function is used to
control the degree to which the difference between components must be larger than minimum internal difference.
We define the pairwise comparison predicate as, |
| D(C1,C2) = Dif (C1;C2) > MInt(C1,C2) (3) |
| where the minimum internal difference, MInt, is defined as, |
| MInt(C1,C2) = min(Int(C1) + (C1),Int(C2) + (C2)) (4) |
| Per superpixel, the color of the illuminant is estimated. We use two separate illuminant color estimators: the
statistical generalized gray world estimates and the physics-based inverse-intensity chromaticity space. We obtain, in
total, two illuminant maps by recoloring each superpixel with the estimated illuminant chromaticities of each one of the
estimators. Both illuminant maps are independently analyzed in the subsequent steps. |
FACE EXTRACTION |
| We require bounding boxes around all faces in an image that should be part of the investigation. For obtaining
the bounding boxes, we could in principle use an automated algorithm, e.g., the one by Schwartz et al.. However, we
prefer a human operator for this task for two main reasons: a) this minimizes false detections or missed faces; b) scene
context is important when judging the lighting situation. For instance, consider an image where all persons of interest
are illuminated by flashlight. The illuminates are expected to agree with one another. Conversely, assume that a person
in the foreground is illuminated by flashlight, and a person in the background is illuminated by ambient light. Then, a difference in the color of the illuminates is expected. Such differences are hard to distinguish in a fully-automated
manner, but can be easily excluded in manual annotation. |
INTERPRETATION OF ILLUMINANT EDGES: HOGEDGE ALGORITHM |
| The next step includes Feature extraction .Feature extraction is a special form of reduction. When the input
data to an algorithm is too large to be processed and it is suspected to be notoriously redundant (e.g. the same
measurement in both feet and meters) then the input data will be transformed into a reduced representation set of
features (also named features vector). Transforming the input data into the set of features is called feature extraction. If
the features extracted are carefully chosen it is expected that the features set will extract the relevant information from
the input data in order to perform the desired task using this reduced representation instead of the full size input.
Feature extraction involves simplifying the amount of resources required to describe a large set of data accurately.
When performing analysis of complex data one of the major problems stems from the number of variables involved.
Analysis with a large number of variables generally requires a large amount of memory and computation power or
a classification algorithm which over fits the training sample and generalizes poorly to new samples. Feature extraction
is a general term for methods of constructing combinations of the variables to get around these problems while still
describing the data with sufficient accuracy. |
| Differing illuminant estimates in neighbouring segments can lead to discontinuities in the illuminant map.
Dissimilar illuminant estimates can occur for a number of reasons: changing geometry, changing material, noise,
retouching or changes in the incident light. Thus, one can interpret an illuminant estimate as a low-level descriptor of
the underlying image statistics. We observed that the edges, e.g., computed by a canny edge detector, detect in several
cases a combination of the segment borders and isophotes (i.e., areas of similar incident light in the image). When an
image is spliced, the statistics of these edges is likely to differ from original images. To characterize such edge
discontinuities, we propose a new feature descriptor called HOGedge. It is based on the well-known HOG-descriptor,
and computes visual dictionaries of gradient intensities in edge points. The full algorithm is described in the remainder
of this section. Algorithmic overview of the method is shown later. We first extract approximately equally distributed
candidate points on the edges of illuminant maps. At these points, HOG descriptors are computed. These descriptors
are summarized in a visual words dictionary. Each of these steps is presented in greater detail in the next subsections.
The essential thought behind the Histogram of Oriented Gradient descriptors is that local object appearance and shape
within an image can be described by the distribution of intensity gradients or edge directions. The implementation of
these descriptors can be achieved by dividing the image into small connected regions, called cells, and for each cell
compiling a histogram of gradient directions or edge orientations for the pixels within the cell. The combination of
these histograms then represents the descriptor. For improved accuracy, the local histograms can be contrastnormalized
by calculating a measure of the intensity across a larger region of the image, called a block, and then using
this value to normalize all cells within the block. This normalization results in better invariance to changes in
illumination or shadowing. |
| The essential thought behind the Histogram of Oriented Gradient descriptors is that local object appearance
and shape within an image can be described by the distribution of intensity gradients or edge directions. The
implementation of these descriptors can be achieved by dividing the image into small connected regions, called cells,
and for each cell compiling a histogram of gradient directions or edge orientations for the pixels within the cell. The
combination of these histograms then represents the descriptor. For improved accuracy, the local histograms can be
contrast-normalized by calculating a measure of the intensity across a larger region of the image, called a block, and
then using this value to normalize all cells within the block. This normalization results in better invariance to changes
in illumination or shadowing. |
RELATED WORKS |
| Illumination-based methods for forgery detection are either geometry-based or color-based. Geometry-based
methods focus at detecting inconsistencies in light source positions between specific objects in the scene [5]. Colorbased
methods search for inconsistencies in the interactions between object color and light color [2]. Two methods
have been proposed that use the direction of the incident light for exposing digital forgeries. Johnson and Farid proposed a method which computes a low-dimensional descriptor of the lighting environment in the image plane (i.e.,
in 2-D). It estimates the illumination direction from the intensity distribution along manually annotated object
boundaries of homogeneous color. Kee and Farid extended this approach to exploiting known 3-D surface geometry. In
the case of faces, a dense grid of 3-D normals improves the estimate of the illumination direction. To achieve this, a 3-
D face model is registered with the 2-D image using manually annotated facial landmarks. Fan et al. propose a method
for estimating 3-D illumination using shape-from-shading. In contrast to, no 3-D model 3The dataset will be available
in full two-megapixel resolution upon the acceptance of the paper. For reference, all images in lower resolution can be
viewed at: http://www.ic.unicamp.br/ tjose/files/database-tifs-small-resolution. zip. of the object is required. However,
this flexibility comes at the expense of a reduced reliability of the algorithm.In a subsequent extension, Saboia et al.
automatically classified these images by extracting additional features, such as the viewer position. The applicability of
both approaches, however, is somewhat limited by the fact that people’s eyes must be visible and available in high
resolution. Gholap and Bora introduced physics-based illumination cues to image forensics. The authors examined
inconsistencies in specularities based on the dichromatic reflectance model. Specularity segmentation on real-world
images is challenging. Therefore, the authors require manual annotation of specular highlights. Additionally,
specularities have to be present on all regions of interest, which limits the method’s applicability in real-world
scenarios. |
METHODOLOGY |
SEGMENTATION ALGORITHM |
| The input is a graph G = (V,E), with n vertices and m edges. The output is a segmentation of V into
components S = (C1,............,Cr). |
| 0. Sort E =π (o1,....., om), by non-decreasing edge weight. |
| 1. Start with a segmentation S0, where each vertex vi is in its own component. |
| 2. Repeat step 3 for q = 1,....,m. |
| 3. Construct Sq given Sq-1 as follows. Let vi and vj denote the vertices connected by the q-th edge in the ordering, i.e., oq = (vi, vj). If vi and vj are in disjoint components of Sq-1 and w(oq) is small compared to the internal difference of
both those components, then merge the two components otherwise do nothing. More formally, let Ci
q-1 be the
component of Sq-1 containing vi and Cj
q-1 the component containing vj . |
| If Ci
q-1≠ Cj
q-1 and w(oq) ≤ MInt(Ci
q- 1,Cj
q-1) then Sq is obtained from Sq-1 by merging Ci
q-1 and Cj
q-1. Otherwise Sq=Sq-1 |
| 4. Return S = Sm. |
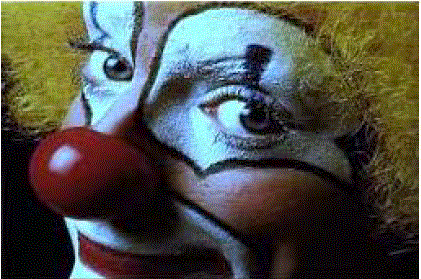
| This is the input image chosen for segmentation |
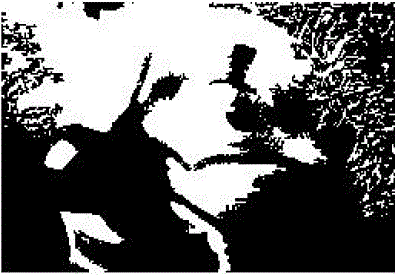
| Face extraction is done using bounding box automated algorithm. |
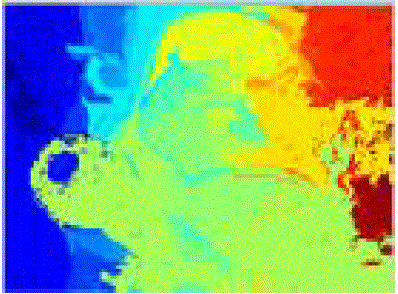
| Statistical generalized gray world estimate is used to obtain the above image. |
| The figure exhibits the result above when physics based inverse intensity chromaticity estimate is done in input image.
HOG feature values H2 from segmented image are obtained as |
| 0.2404 |
| 0.3682 |
| 0.3717 |
| 0.2383 |
| 0.2623 |
| 0.2901 |
CONCLUSION |
| In this project work, a new method for detecting forged images using illuminant color estimator has been
proposed. In the first phase, the illuminant color using a statistical gray edge method and physics based method which
exploits the inverse intensity chromaticity color space is estimated and also information is extracted on the distribution
of edges on the illuminant maps. In order to describe the edge information, an algorithm based on edge-points and the
Histogram Of Oriented Gradients (HOG) descriptor called HOG edge algorithm is applied. The segmented feature
values are estimated using this algorithm. This project can be further developed by extracting both edges and textures
of forged image and pairing the face features for the classification. This would be obtained using ELM classifier. |
| |
Figures at a glance |
 |
 |
 |
 |
| Figure 1 |
Figure 2 |
Figure 3 |
Figure 4 |
|
 |
 |
 |
| Figure 5 |
Figure 6 |
Figure 7 |
|
| |
References |
- A. Rocha, W. Scheirer, T. E. Boult, and S. Goldenstein, “Vision of the unseen: Current trends and challenges in digital image and videoforensics,” ACM Comput. Surveys, vol. 43, pp. 1âÃâ¬Ãâ42, 2011.
- C. Riess and E. Angelopoulou, “Scene illumination as an indicator of image manipulation,” Inf. Hiding, vol. 6387, pp. 66âÃâ¬Ãâ80, 2010.
- H. Farid and M. J. Bravo, “Image forensic analyses that elude the human visual system,” in Proc. Symp. Electron. Imaging (SPIE), 2010, pp. 1âÃâ¬Ãâ10.
- Y. Ostrovsky, P. Cavanagh, and P. Sinha, “Perceiving illumination inconsistencies in scenes,” Perception, vol. 34, no. 11, pp. 1301âÃâ¬Ãâ1314, 2005.
- H. Farid, A 3-D lighting and shadow analysis of the JFK Zapruder film (Frame 317), Dartmouth College, Tech. Rep. TR2010âÃâ¬Ãâ677, 2010.
- M. Johnson and H. Farid, “Exposing digital forgeries by detecting inconsistencies in lighting,” in Proc. ACM Workshop on Multimedia andSecurity, New York, NY, USA, 2005, pp. 1âÃâ¬Ãâ10.
- M. Johnson and H. Farid, “Exposing digital forgeries in complex lighting environments,” IEEE Trans. Inf. Forensics Security, vol. 3, no. 2, pp.450âÃâ¬Ãâ461, Jun. 2007.
- M. Johnson and H. Farid, “Exposing digital forgeries through specular highlights on the eye,” in Proc. Int.Workshop on Inform. Hiding, 2007,pp. 311âÃâ¬Ãâ325.
- E. Kee and H. Farid, “Exposing digital forgeries from 3-D lighting environments,” in Proc. IEEE Int. Workshop on Inform. Forensics andSecurity (WIFS), Dec. 2010, pp. 1âÃâ¬Ãâ6.
- W. Fan, K. Wang, F. Cayre, and Z. Xiong, “3D lighting-based image forgery detection using shape-from-shading,” in Proc. Eur. SignalProcessing Conf. (EUSIPCO), Aug. 2012, pp. 1777âÃâ¬Ãâ1781.
- J. F. OâÃâ¬Ãâ¢Brien and H. Farid, “Exposing photo manipulation with inconsistent reflections,” ACM Trans. Graphics, vol. 31, no. 1, pp. 1âÃâ¬Ãâ11, Jan.2012.
- S. Gholap and P. K. Bora, “Illuminant colour based image forensics,” in Proc. IEEE Region 10 Conf., 2008, pp. 1âÃâ¬Ãâ5.
|