Eric R. Chen*
Oakton High School, Vienna, Virginia, United States of America
Received: 21-Jun-2022, Manuscript No. JSS-22-67122; Editor assigned: 24-Jun-2022, Pre QC No. JSS-22-67122 (PQ); Reviewed: 11-Jul-2022, QC No. JSS-22-67122; Accepted: 18-Jul-2022, Manuscript No. JSS-22-67122 (A); Published: 27-Jul-2022, DOI: 10.4172/JSS.8.S1.001
Visit for more related articles at Research & Reviews: Journal of Social Sciences
As cryptocurrencies develop and circulate at greater rates, countries have appeared to consider the technology as an adoptable medium of exchange. By expanding the influence of cryptocurrencies through adoption, countries raise its impact on the global economy. This paper is the first to apply an augmented version of the gravity model to examine the effects of global cryptocurrency adoption on international trade. This empirical study involves aggregating datasets on U.S. bilateral trade flows, gravity variable statistics, and the adoption of cryptocurrencies. In application of the gravity model, regression analyses are used on the aggregated data to test the magnitude of cryptocurrencies’ impact on trade. Based on the overall findings, the variables for cryptocurrency adoption produce negative coefficients suggesting a negative correlation between the adoption of cryptocurrencies and international trade. The central tendency in the empirical evidence offers the interpretation that countries with weak institutions to promote trade are more likely to adopt cryptocurrencies resulting in a negative association between cryptocurrency adoption and trade.
Trade block chain; International trade; International economics; Crypto-currencies; Bilateral trade
The emergence of cryptocurrencies has grasped the economic attention of many countries by introducing the revolutionary concepts of block chain technology and decentralized currencies. This paper investigates the influence of global cryptocurrency adoption on U.S. bilateral trade by applying a gravity model framework on the value of imports and exports.
Since the inception of prominent cryptocurrencies, such as Bitcoin and Ethereum, curiosity has followed, resulting in a broad awareness of the concept, but with varying levels of tolerance and acceptance. Cryptocurrencies, a subset of digital currencies, are predominantly decentralized meaning that transactions are peer-to-peer without relying on a financial institution. The innovative aspects of decentralization, transparency, security, and transaction efficiency largely influence the appeal towards cryptocurrencies; however, reluctance towards the concept stems from its price volatility and involvement in illicit activities. The first recognized cryptocurrency, Bitcoin, was created in 2009 near the end of the Great Recession by an unidentified developer going by the pseudonym Satoshi Nakamoto. In a white paper from Nakamoto, “Bitcoin: A Peer-to-Peer Electronic Cash System,” he asserts that a solution to the heavy dependence on financial institutions is to apply a digital payment structure founded upon a peer-to-peer network [1]. After the origination of Bitcoin, other cryptocurrencies have materialized as new and improved variants of their predecessor. In recent years, the momentum of cryptocurrencies has brought the support of multinational corporations, such as Microsoft and PayPal. In fact, to quantify the progress of cryptocurrencies, the market capitalization of cryptocurrencies rose over $2 trillion (USD) in September 2021 [2]. As a result, countries started to view cryptocurrencies as a viable system to adopt. An extensive bibliometric and literature review by Bariviera and Merediz-Sola reported that most of the economic literature surrounding cryptocurrencies lie in its financial attributes ranging from volatility to bubble formation; consequently, there is a gap in academic work exploring the macroeconomic implications of cryptocurrencies. This paper dives into the macro impact of cryptocurrency adoption by examining U.S. bilateral trade flows through a gravity model framework [3].
One of the most rigorous findings in international economics is the application of the gravity model on trade. The model derives from the physics concept of gravity where a larger mass or shorter distance between two objects results in a greater gravitational pull. The same notion carries over to international economics where a shorter distance or larger GDP of two countries produce a greater amount of trade. In addition, to further the model’s evaluation of bilateral trade, more explanatory variables are added, such as common languages or population sizes. This paper expands the model by implementing an explanatory variable as the magnitude of a country’s cryptocurrency adoption, which in turn determines the effects of cryptocurrency adoption on international trade. According to the results, the adoption of cryptocurrencies negatively correlates with international trade. The overall test results produced strong statistically significant estimates, which implies with greater than 95% probability that the influence of cryptocurrency adoption on trade is greater than zero. In other words, the negative correlation between cryptocurrency adoption and international trade is likely to be true and consistent. To explain this relationship, countries with weak institutions to promote trade tend to be the first to adopt cryptocurrencies; as a consequence, there is a negative correlation between cryptocurrency adoption and international trade.
In Section 2, the paper introduces the datasets used in this research along with the data merging process. Section 3 then presents the application of the gravity model through different gravity equation variants fitted for examining the impact of cryptocurrency adoption. The regression test results from applying the gravity model to the data are explained in Section 4. Furthermore, the interpretation of the test results from Section 4 is discussed in Section 5. The paper is then concluded in the last section.
In order to apply the gravity model, this paper requires three datasets. The first dataset is Chainalysis’s 2020 Global Cryptocurrency Adoption Index [4]. Chainalysis, a blockchain data platform, internationally supplies services, research, and products to government agencies, financial institutions, and cryptocurrency-related businesses. The customers of Chainalysis include the United Nations Office of Drugs and Crime (UNODC), Europol, Barclays, and Square. The second and third datasets come from the French Centre d’Etudes Prospectives ET d’Informations (CEPII), a leading economic research institute in France.
Chainalysis 2020 global cryptocurrency adoption index
The adoption index dataset, compiled by Chainalysis from July 2019 to June 2020, comprises 154 countries indexed on a scale of 0 to 1 (1 being the highest adoption score). The index’s methodology is founded upon four metrics: on-chain cryptocurrency value received, on-chain retail value transferred, number of on-chain cryptocurrency deposits, and peer-to-peer exchange trade volume. The “on-chain cryptocurrency value received” metric grades a country through their entire cryptocurrency activity by approximating the total cryptocurrency received and weighting that value by purchasing power parity (PPP) per capita. The “on-chain cryptocurrency value transferred” metric measures a country’s cryptocurrency movements from retail or individual users by examining retail transactions (a transaction under $10,000 USD) and weighting the measure by PPP per capita. The “number of on-chain cryptocurrency deposits” metric grades a country through the quantity of cryptocurrency transactions by measuring the ratio of deposits to internet users. Lastly, the “peer-to-peer exchange trade volume” metric analyzes a country’s total trade volume and activity while weighting it with PPP per capita and the quantity of internet users. With these metrics, the index score of a country is generated by calculating the geometric mean of the four metrics and then scaling them to fit a 0 to 1 scope [4]. Table 1 displays a preview of Chainalysis’s 2020 Global Cryptocurrency Adoption Index depicting the geographic amplitude and diversity of cryptocurrency adoption with the full index located in Appendix A (Table 1).
| Country | Score | Rank | Country | Score | Rank |
|---|---|---|---|---|---|
| Ukraine | 1 | 1 | Brunei | 0.003 | 135 |
| Russia | 0.931 | 2 | Myanmar | 0.003 | 136 |
| Venezuela | 0.799 | 3 | Gabon | 0.003 | 137 |
| China | 0.672 | 4 | Belize | 0.002 | 138 |
| Kenya | 0.645 | 5 | Macao | 0.002 | 139 |
| United States of America | 0.627 | 6 | Papua New Guinea | 0.001 | 140 |
| South Africa | 0.526 | 7 | Guyana | 0 | 141 |
| Nigeria | 0.459 | 8 | Bermuda | 0 | 142 |
| Colombia | 0.444 | 9 | Afghanistan | 0 | Among Lowest |
| Vietnam | 0.443 | 10 | Algeria | 0 | Among Lowest |
| India | 0.395 | 11 | Cape Verde | 0 | Among Lowest |
| Thailand | 0.365 | 12 | Chad | 0 | Among Lowest |
| Brazil | 0.338 | 13 | Fiji | 0 | Among Lowest |
| United Kingdom | 0.333 | 14 | Laos | 0 | Among Lowest |
| Pakistan | 0.272 | 15 | Libya | 0 | Among Lowest |
| Philippines | 0.262 | 16 | Mongolia | 0 | Among Lowest |
| South Korea | 0.246 | 17 | Tajikistan | 0 | Among Lowest |
| Peru | 0.242 | 18 | Turkmenistan | 0 | Among Lowest |
| Belarus | 0.241 | 19 | West Bank and Gaza | 0 | Among Lowest |
| Australia | 0.21 | 20 | Zimbabwe | 0 | Among Lowest |
Table 1. Top twenty (left) and bottom twenty (right) countries from Chainalysis 2020 Global Cryptocurrency Adoption Index.
CEPII database
This paper incorporates two disaggregated data sets from the Centre d’Etudes Prospectives ET d’Informations (CEPII): BACI and Gravity databases. BACI features bilateral trade flows data for over 200 countries and 5000 classified goods. The data derives directly from the UN Comtrade Database, where countries’ customs authorities report their trade data. The specific dataset extracted from the CEPII BACI database was the February 2021 released version for the 2019 bilateral trade flows data. This dataset contained a total of 10,587,612 observations.
The CEPII Gravity database holds data for gravity equation variables on 252 countries for years ranging from 1948 to 2019. The database’s variable data range from a common language between two countries to whether a country is a member of the World Trade Organization (WTO). The database compiles data spanning from a multitude of sources including databases such as the Direction of Trade Statistics (DOTS) by the International Monetary Fund (IMF) or the CIA World Fact book (Table 2).
| t | i | j | k | v | q |
|---|---|---|---|---|---|
| 2019 | 4 | 28 | 620462 | 0.483 | 0.011 |
| 2019 | 4 | 31 | 70310 | 5.74 | 22 |
| 2019 | 4 | 31 | 80211 | 2.446 | 0.196 |
| 2019 | 4 | 31 | 80620 | 0.179 | 0.028 |
| 2019 | 4 | 31 | 80711 | 5.874 | 37.83 |
| 2019 | 4 | 31 | 81310 | 0.115 | 0.014 |
| 2019 | 4 | 31 | 81340 | 0.127 | 0.02 |
| 2019 | 4 | 31 | 91020 | 2.683 | 0.003 |
| 2019 | 4 | 31 | 680221 | 30.327 | 110.67 |
| 2019 | 4 | 31 | 860900 | 7.166 | 12.44 |
| 2019 | 4 | 32 | 392690 | 0.094 | 0.001 |
| 2019 | 4 | 32 | 710399 | 0.187 | 0.015 |
| 2019 | 4 | 32 | 732690 | 0.174 | 0.002 |
| 2019 | 4 | 32 | 842199 | 1.872 | 0.018 |
| 2019 | 4 | 32 | 843390 | 0.673 | 0.036 |
Note: As seen in Table 2, the BACI datasets comprise five variables that each represents a value for the recorded trade. The variable t refers to the year the trade occurred, i represents the exporter by ISO 3-digit country codes, j represents the importer through ISO 3-digit country codes, k is the trade’s product category by HS 6-digit codes, v serves as the trade flow’s value in thousands (current USD), and q serves as the quantity of the trade (metric tons).
Table 2. Sample observations from the 2019 BACI (February 2021 version) raw data set retrieved from www.cepii.fr.
Merging and handling the data
In the cryptocurrency adoption data set, Puerto Rico and the West Bank and Gaza were dropped since these territories are not recognized in the CEPII and UN Comtrade databases, which lowered the adoption index dataset to 152 countries. This paper focuses on U.S. bilateral trade flows, which only requires trade flows data of the U.S. with all other countries in the CEPII BACI dataset. Thus, all other non-U.S. bilateral trade flows were dropped from the BACI dataset. Once the dataset held entirely U.S. bilateral trade flows, the cryptocurrency adoption index scores were matched to their respective countries. Countries that were not matched with adoption index scores, also meaning that those countries were not included in Chainalysis 2020 Global Cryptocurrency Adoption Index, were also removed from the dataset. Identically, the CEPII Gravity data was filtered by removing the observations of non-U.S. countries and countries that were not entered into the adoption index. In addition, the CEPII Gravity database contains observations tracing back to 1948, and because this paper relies solely on 2019 data, the observations before 2019 were excluded from the dataset. The explanatory variables used for this paper’s gravity model framework consisted of the cryptocurrency adoption indexes, GDP in thousands (current USD), distance between countries (km), common language, population in thousands, WTO members, and European Union (EU) countries. So, for the CEPII Gravity database, only the relevant explanatory variables’ data were gathered and merged with the other two data sets (Supplementary Table 1).
In total, data from ten gravity variables were used as shown in Supplementary Table 2. In the table, the letters o and d at the end of certain variables represent the origin and destination country, respectively. Variables denoted with o and d are implemented as unilateral characteristics while variables without this notation are applied as bilateral characteristics; for instance, pop_o only represents the population of the origin country while dist represents the distance between both the origin and destination countries. When aggregating the three datasets, the notion of origin and destination countries will shift to the idea of exporter and importer countries. As a note, Venezuela, Syria, Turkmenistan, and Iran were all missing GDP values in the CEPII Gravity database, so all four countries were cross referenced using IMF, St. Louis Federal Reserve Economic Data (FRED), and World Bank databases. By cross referencing these data sources, the missing GDP values for Iran and Turkmenistan were found; however, the missing GDP data for Venezuela and Syria could not be uncovered resulting in the removal of these two countries from all three datasets. After filtering and merging the data, the final aggregated dataset held a total of 533,880 observations from the bilateral trade flows of 150 countries (Supplementary Table 2).
An application of the gravity model
The standard framework for the gravity model consists of the three explanatory variables: GDP of the export country, GDP of the import country, and distance between the two countries. The equation for this standard framework can be represented as:
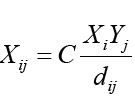
Where Xi and Xj denotes the GDP of the exporter and importer countries, respectively, while the dij variable indicates the distance between the countries. The left side of the equation represented by the variable Xij denotes the value of imports and exports. In this case, the value of imports and exports acts as a proxy for international trade. Fundamentally, bilateral trade increases if the GDP of either country increases. Inversely, a greater distance between two countries implies a decreased value of bilateral trade. The econometric derivation of this equation is obtained by taking the logarithms for each side of the equation and then simplifying with the properties of logarithms:
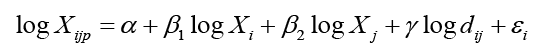
Where the term εi signifies the unobservable determinants in the gravity framework. This gravity equation is used to determine the impact of explanatory variables on bilateral trade through the calculation of variable coefficients. Ultimately, a negative coefficient of a variable indicates that trade negatively depends on that variable; while a positive coefficient of a variable indicates that trade positively depends on that variable.
In this paper, modified variants of the gravity equation are implemented to predict the relationship between cryptocurrency adoption and trade value. The first variant of the gravity equation considers the standard gravity variables, GDP of each country and the distance between the countries, plus the cryptocurrency adoption variables:

Where variables Adopi and Adopj denote the cryptocurrency adoption indexes of their corresponding countries. Since the adoption index values exist on a scale 0 to 1, taking the logarithm of the variable would not be possible due to the undefined value of log (0). Thus, one of the solutions is to include the initial and unaltered values of the cryptocurrency adoption index in the equation.
The second variant of the gravity equation provides another solution to the issue of undefined values. Equation 2, depicted below, mirrors Equation 1 except for the cryptocurrency adoption index terms:

Where the adoption index terms are represented by  . Adding a value of one to the adoption index ensures that the logarithm of the altered index value will never reach an undefined value, since the lowest value of the index would be 1.
As for the third and fourth variant of the gravity equation, more explanatory variables are added for stronger predictions. The third variant takes into consideration the variables for population, WTO members, EU countries, and common language:

Where ComLangij is a dummy variable denoting a common language between countries in at least 9% of the population. WTOi and WTOj are dummy variables that determine whether the country is a member of the WTO. Similarly, EUi and EUj are dummy variables that determine whether the country is part of the EU. Lastly, the Popi and Popj variables represent the total population of the country. Also, it should be noted that Equation 3 follows the same method of Equation 1 by assigning the adoption index terms with the initial values of the adoption index values.
The fourth variant of the gravity equation follows the same form of Equation 3 except that the adoption index terms take the logarithm of the adoption index values plus one, which adopts the same method used in Equation 2:

For all four equations, the independent variables, or determinants, are interpreted through the ceteris paribus effect. In econometrics, the concept of ceteris paribus, Latin for “all else being equal,” is used to isolate the impact of a single determinant by holding the other variables constant. This enables the observation of only the cryptocurrency adoption variables while considering the other variables as constants.
To apply these equations, the final aggregated dataset was adapted to include the logarithm of explanatory variables based on the parameters of the equations, as exhibited in Supplementary Table 3.
Linear regression analysis
This section describes the use of linear regression to determine the coefficients of the gravity equation’s independent variables. The final dataset was modeled using the linear regression tool from Microsoft Excel. The data matching variable v shown in Supplementary Table 3 was set as the ‘Y Range’ of the regression input, since the variable v represents the value of imports and exports, which was set as the dependent variable of Equations 1-4. Additionally, the data matching the independent variables, which are the explanatory variables of Equations 1-4, are set as the ‘X Range’ of the regression input. Once the linear regression tool is applied, the summary output of the test compiles the data ranging from the coefficients of the independent variables to the standard errors.
Test results
In the results of the regression test for Equation 1, the coefficients of the cryptocurrency adoption index variables are negative for both the exporting and importing countries, as seen in Supplementary Table 1 (see the full regression results in S2 Appendix B). By examining the coefficient estimates, a 1% increase in cryptocurrency adoption of the exporting country brings about a 0.9% reduction in the value of trade, whereas a 1% increase in cryptocurrency adoption for the importing country brings about a 0.13% reduction of trade value. Comparatively, the ratio of the exporting country to the importing country regarding the impact of cryptocurrency adoption on trade value is approximately 7 to 1. Ultimately, the adoption of cryptocurrencies from the exporting country seems to generate a higher degree of impact on trade compared to the importing country.
Based on the standard error and t statistic values in Table 3, the adoption of cryptocurrencies proves to have a statistically significant impact on the value of imports and exports in this test. More specifically, the statistical significance of the determinants is explained by observing how the absolute t statistic values (ratio of coefficient to standard error) are greater than a critical value of 1.96. It should be noted that the t statistic values are remarkably high; consequently, this benefits the evidence behind cryptocurrency adoption as a reasonable determinant to trade value.
| Coefficients | Standard error | t stat | |
|---|---|---|---|
| Cryptocurrency adoption index of exporting country | -0.90283461 | 0.041382478 | -21.81683283 |
| Cryptocurrency adoption index of importing country | -0.12687794 | 0.034251811 | -3.70426955 |
| Log (Distance) | -0.66851353 | 0.007080771 | -94.41252983 |
| Log (GDP of exporting country) | 0.843347619 | 0.00435532 | 193.6362022 |
| Log(GDP of importing country) | 0.711389428 | 0.003140782 | 226.5007324 |
Table 3. Linear regression test results for Equation 1.
In the results for the second test constructed upon the parameters of Equation 2, the same trend in the first test may be observed (see the full regression results in S3 Appendix C). Once again, the cryptocurrency adoption variables have negative coefficients proving that the adoption of cryptocurrencies negatively correlates with trade value. In addition, the coefficients increased in magnitude, due to the use of logarithms and the added value of one on the cryptocurrency adoption variable for Equation 2. To quantify this by interpreting the coefficient values, a 1% increase in cryptocurrency adoption for the exporting country results in about a 1.15% reduction in the value of trade. Correspondingly, a 1% increase of cryptocurrency adoption in the importing country results in around a 0.22% reduction in trade value. By comparison, the ratio of the exporting country to the importing country regarding the impact of cryptocurrency adoption on general trade is around 5 to 1, which reflects closer levels of impact between the two variables when compared with the first test.
As depicted in Table 4, this regression’s standard error and t statistic values reveal an overall statistically significant effect of cryptocurrency adoption on trade. In addition, the t statistic values remained relatively consistent between the first test in Table 3 and this test in Table 4. As for the other explanatory variables in the gravity framework, they maintained constant results even though the coefficients representing cryptocurrency adoption were slightly altered.
| Coefficients | Standard error | t Stat | |
|---|---|---|---|
| Log (Cryptocurrency adoption index of exporting country+1) | -1.14656 | 0.05686 | -20.1644 |
| Log (Cryptocurrency adoption index of importing country+1) | -0.2231 | 0.04636 | -4.81218 |
| Log (Distance) | -0.66921 | 0.00708 | -94.4923 |
| Log (GDP of exporting country) | 0.84012 | 0.00447 | 187.972 |
| Log (GDP of importing country) | 0.71664 | 0.00325 | 220.739 |
Table 4. Linear regression test results for Equation 2.
In Table 5, the third regression test, modeled after Equation 3, captures the same effect of negative coefficients as the first and second tests found in Table 3 and Table 4, respectively (see the full regression results in S4 Appendix D). When compared to the second test in Table 3, the coefficients of the cryptocurrency adoption variable for both the exporter and importer changed by a substantial increase in magnitude. When examining the coefficient values, a 1% increase in cryptocurrency adoption from the exporting country reduces the value of trade by 1.13%. Along the same line, a 1% increase in the importing country reduces the value of trade by 1.1%. As a result, the ratio of the exporting country to the importing country regarding the impact of cryptocurrency adoption on trade is closely 1 to 1, which differs considerably from the first test’s 7 to 1 ratio and the second test’s 5 to 1 ratio. Ultimately, this test’s adjusted ratio reveals that the impact of cryptocurrency adoption on trade value from both the exporter and importer remains relatively equal (Table 5).
| Coefficients | Standard error | t Stat | |
|---|---|---|---|
| Cryptocurrency adoption index of exporting country | -1.130974516 | 0.045814078 | -24.6861786 |
| Cryptocurrency adoption index of importing country | -1.067921993 | 0.036653586 | -29.1355392 |
| Common Language | 0.043657221 | 0.009422021 | 4.63353029 |
| WTO membership of exporting country | 0.295968244 | 0.046939961 | 6.30525116 |
| WTO membership of importing country | 0.408451937 | 0.02262252 | 18.0551037 |
| EU membership of exporting country | -0.063314477 | 0.016651231 | -3.80239026 |
| EU membership of importing country | -1.346304724 | 0.013931424 | -96.6379852 |
| Log (Population of exporting country) | 0.264133064 | 0.0073093 | 36.1365727 |
| Log (Population of importing country) | -0.128168256 | 0.005024774 | -25.5072675 |
| Log (Distance) | -0.732036512 | 0.007581689 | -96.5532202 |
| Log (GDP of exporting country) | 0.738116051 | 0.006185465 | 119.330737 |
| Log (GDP of importing country) | 0.87700421 | 0.004565478 | 192.094739 |
Table 5. Linear regression test results for Equation 3.
In this test, the standard error and t statistic values acknowledge the effects of cryptocurrency adoption from both the exporter and importer as statistically significant. When comparing the t statistic values to the first test in Table 6 and the second test in Table 4, the cryptocurrency adoption variable for the importing country dramatically grew in value while the corresponding statistic for the exporting country increased slightly. In fact, the cryptocurrency adoption variable’s t statistic for the importing country surpassed that of the exporting country.
As expected, the fourth test results presented in Table 6 report negative coefficients for the cryptocurrency adoption variables (see the full regression results in S5 Appendix E). The first point to note is that the coefficients for cryptocurrency adoption moderately increased in magnitude in contrast to the third test in Table 5, which mirros the relationship discovered between the first two tests shown in Table 3 and Table 4. This can be explained by attending to how taking the logarithm increases the sensitivity or marginal effect of the results. By evaluating the coefficient values, a 1% increase in cryptocurrency adoption from the exporting country causes a 1.52% reduction in the value of trade. Similarly, a 1% increase in cryptocurrency adoption from the importing country results in a 1.4% reduction in trade value. Through the same ratio comparison used for the other three tests, the ratio of the exporter to importer regarding the effect of cryptocurrency adoption on trade is nearly 1 to 1, which matches the ratio found in the third test from (Table 5).
| Coefficients | Standard error | t Stat | |
|---|---|---|---|
| Log (Cryptocurrency adoption index of exporting country+1) | -1.51935263 | 0.063303896 | -24.00093423 |
| Log (Cryptocurrency adoption index of importing country+1) | -1.40342836 | 0.049742405 | -28.21392256 |
| Common Language | 0.055003348 | 0.00943737 | 5.828249794 |
| WTO membership of exporting country | 0.294581338 | 0.046939711 | 6.275738159 |
| WTO membership of importing country | 0.409011922 | 0.022627054 | 18.07623365 |
| EU membership of exporting country | -0.0539698 | 0.0165764 | -3.255821601 |
| EU membership of importing country | -1.33239169 | 0.013878638 | -96.00305998 |
| Log (Population of exporting country) | 0.266707225 | 0.007366237 | 36.20671255 |
| Log (Population of importing country) | -0.12598801 | 0.005056333 | -24.91687522 |
| Log (Distance) | -0.72993949 | 0.007583299 | -96.25619491 |
| Log(GDP of Exporting Country) | 0.74162891 | 0.006186148 | 119.8854057 |
| Log(GDP of Importing Country) | 0.879094631 | 0.004584213 | 191.765677 |
Table 6. Linear regression test results for Equation 4.
For this regression in Table 6, the standard error and t statistic values point toward a statistically significant effect of cryptocurrency adoption on the value of trade, which appears to be a recurring statistic in the other regression tests. As a matter of fact, the standard error and t statistic values remained nearly equivalent to the corresponding values from the third test in Table 5.
In all four tests, the consistency of results for statistical significance raises the conclusion of cryptocurrency adoption as a sound determinant for trade value by rejecting the null hypothesis. In particular, the statistical significance proves that with greater than 95% probability, the effect of cryptocurrency adoption is not zero.
Altogether, the four regression tests produced results that imply a negative relationship between the adoption of cryptocurrencies and the value of trade. In other words, an increase in cryptocurrency adoption results in a decrease for trade value (Table 6).
| Coefficients | Standard error | t Stat | |
|---|---|---|---|
| Log (Cryptocurrency adoption index of exporting country+1) | -1.51935263 | 0.063303896 | -24.00093423 |
| Log (Cryptocurrency adoption index of importing country+1) | -1.40342836 | 0.049742405 | -28.21392256 |
| Common Language | 0.055003348 | 0.00943737 | 5.828249794 |
| WTO membership of exporting country | 0.294581338 | 0.046939711 | 6.275738159 |
| WTO membership of importing country | 0.409011922 | 0.022627054 | 18.07623365 |
| EU membership of exporting country | -0.0539698 | 0.0165764 | -3.255821601 |
| EU membership of importing country | -1.33239169 | 0.013878638 | -96.00305998 |
| Log (Population of exporting country) | 0.266707225 | 0.007366237 | 36.20671255 |
| Log (Population of importing country) | -0.12598801 | 0.005056333 | -24.91687522 |
| Log (Distance) | -0.72993949 | 0.007583299 | -96.25619491 |
| Log(GDP of Exporting Country) | 0.74162891 | 0.006186148 | 119.8854057 |
| Log(GDP of Importing Country) | 0.879094631 | 0.004584213 | 191.765677 |
Table 6. Linear regression test results for Equation 4.
This section proposes a correlation behind the negative relationship of cryptocurrency adoption to international trade. Throughout the development of cryptocurrencies, the most concentrated number of users originates from countries with a higher tolerance for corruption. On the contrary, the “goodness” of a country’s governance deters the adoption and use of cryptocurrencies [5,6]. An investigation in Africa by Musila and Sigué suggests that corruption negatively correlates to international trade through a gravity model approach. In a similar study for Latin America and the Caribbean, results determine the same prediction of a negative relationship between international trade and corruption [7,8]. By deductive reasoning, a higher tolerance for corruption results in weak institutions to promote trade, which in turn increases the adoption of cryptocurrencies. In other words, there occurs a pattern of cryptocurrencies facilitating weak trade, since countries with weak institutions to promote trade are more likely to adopt cryptocurrencies.
However, corruption is not the only factor in weakening institutions for trade. The lack of access to banking services and products also inhibits trade. With lack of access to services that cover international transactions, the number of international transactions decrease, which ultimately weakens trade. In addition, the problem of unavailable banking services and products also furthers the adoption of cryptocurrencies. As anecdotal evidence in The 2020 Geography of Cryptocurrency Report, a cryptocurrency-exchange user operated a video game distribution service, where the user sold games in Nigeria by importing them from China [4]. The user’s bank denied him from wiring money to China as payment for the imported games. However, by using cryptocurrencies, he was enabled to directly send payments to China. In this case, although cryptocurrencies helped facilitate trade in that country, the negative correlation between cryptocurrency adoption and trade persists, due to the country’s weak institutions in promoting trade. Ultimately, countries with weak institutions to promote trade are more susceptible to cryptocurrency adoption resulting in a negative correlation between trades and adopting cryptocurrencies.
Cryptocurrencies become more appealing to adopt when a country’s political and economic environment contributes to the development of weak institutions for promoting trade. Whether the reason is corruption or lack of access to financial services, these countries are the first to adopt cryptocurrencies. Thus, the test results in Section 4 suggest that the relationship between cryptocurrency adoption and trade derives from a country’s ability to facilitate trade. If a country has difficulty in facilitating trade, the possibility of cryptocurrency adoption increases. Alternatively, if a country can strongly facilitate trade, the possibility of cryptocurrency adoption decreases. It is important to note that there may be exceptions to this assessment; however, this interpretation is influenced by the central tendency of the empirical evidence.
This paper examined how the adoption of cryptocurrencies would affect international trade. The methodology of this study involved a gravity model approach on datasets from CEPII and Chainalysis. More specifically, the datasets were retrieved from the CEPII BACI and Gravity databases and Chainalysis’s 2020 Global Cryptocurrency Adoption Index. Four gravity equations were modeled, and four linear regression tests were implemented. The results of the regression tests exhibited negative coefficient values for the cryptocurrency adoption variables. This proposes an inverse relationship between cryptocurrency adoption and international trade. Ultimately, this relationship between the adoption of cryptocurrencies and trade may be interpreted through a correlative point of view. Countries with weak institutions to promote trade have a higher tendency to adopt cryptocurrencies. Thus, the findings imply that the factors hindering institutions from promoting trade, such as corruption or lack of access to financial services, are also the factors that attract cryptocurrency adoption.
For future work, more comprehensive approaches to the data and gravity model could be taken. Due to the shifting sentiments toward cryptocurrencies, the data may change as different countries fluctuate their levels of adoption. Thus, examining datasets from different years could introduce new patterns for cryptocurrency adoption as a factor in international trade. Furthermore, focusing on the bilateral trade of different countries with the rest of the world could provide for more extensive results. Among the gravity equations, more explanatory variables could be included to test for more complete results. In addition, splitting the data into different categories, such as democratic countries and non-democratic countries or US-ally countries and non-US-ally countries, and generating test results for those specific categories could explore for heterogeneity. Ultimately, as cryptocurrencies continue to evolve and expand, their macro-economic implications will only become more substantial, and this will require further studies to better understand their impact in economics.
We would like to extend our appreciation for Professor William Lincoln, Associate Professor of Economics at Claremont McKenna College, who assisted the research with supporting feedback and suggestions.