ISSN ONLINE(2278-8875) PRINT (2320-3765)
ISSN ONLINE(2278-8875) PRINT (2320-3765)
Raja R1, Dr.K.Udhayakumar2
|
| Related article at Pubmed, Scholar Google |
Visit for more related articles at International Journal of Advanced Research in Electrical, Electronics and Instrumentation Engineering
The usage of electronics has been increasing and its misuse leads to energy losses in huge manner. Due to the requirement of the energy, each and every one should know about energy saving and many research works are going on energy savings by utilizing the energy in a correct way. In this paper, monitoring of energy usage is done by having smart sensory network in dc electrical appliances like lighting in the building. Normally the ac grid is used to powered the conventional lamps but LED are works in the dc supply and the dimming LED with the corresponding protocol is an efficient way for power saving. Replacement of the traditional fluorescent lamp by the LED is make us to save 44% of energy. The sensory network is used to utilize the LED power correctly with its corresponding protocol will increase the percentage of energy saving.
I.INTRODUCTION |
| The energy demand is frequently increasing but the supply side production is dramatically decrease, so it is necessary to save the energy for our future purpose. The smart grid with the smart meters are efficient way to monitor the power usage, with that utilization of electrical energy within the building is become an hot topic among researchers and various research works are going on dimming the electric lamp and utilization of day light with the help of sensor network for maintaining a light intensity throughout the building, for that conventional lamps are replaced by the LED because it have following advantages [3] |
| It have least warm up -LED lights brighten up immediately and when powered on |
| The brightness of LED can be controllable and optimisation is good in it. |
| Low cost, low electric power consumption and long life. |
| In this paper, a smart sensor network is designed for the intensity management in the building structure and that are connected to the dc powered LED lighting system to: 1) For getting good visual comfort with the intelligent in indoor environment 2) making decision in between the human–lighting interaction, and 3) optimize/minimize the energy usage of the building lights. The main objective is the design of networked lighting to reduce as much unwanted wastage of energy as possible and improve the comfort of workers in office buildings, the objective is done by monitoring human interface by the motion detective sensor (normally PIR) with the light intensity measuring sensor (photodiodes). The ISO (International Organization for Standardization), the light energy of the working surface is from 300 to 1500 (lux) and this is sufficient for visual comfort of the human [5, 6]. |
II. BEHAVIOUR MODELING OF THE LIGHT |
| The led have two important properties are intensity of light and total optical power transmitted. The light intensity of the substance is depends on the radiometric property of that material. The luminous intensity is the ratio between energy flux to the solid angle and it is used for expressing the brightness of an LED [1,2]. |
| The luminous intensity is: |
 |
| Where φ is the energy flux and Ω is the solid angle |
 |
| The optical power transmitted have the linear relation between the total radiated energy from the source to the point where the light energy is monitor. |
 |
| Based on the Lambertian radiation the luminous intensity is |
 |
| Here the centre luminous intensity of an LED is given by I(0), φ and ψ are the angle of irradiance and angle of incidence respectively, m is the lambertian emission constant and D as the distance between the source with respect to the receiver. |
| The illuminanous at a particular surface is given by |
 |
III.STIMULATION AND RESULTS |
| The behaviour model is used to generate MATLAB simulation, here LED light is simulated based on the Lambertain cosine law for the generation, distribution (scattering of energy) through the entire space. |
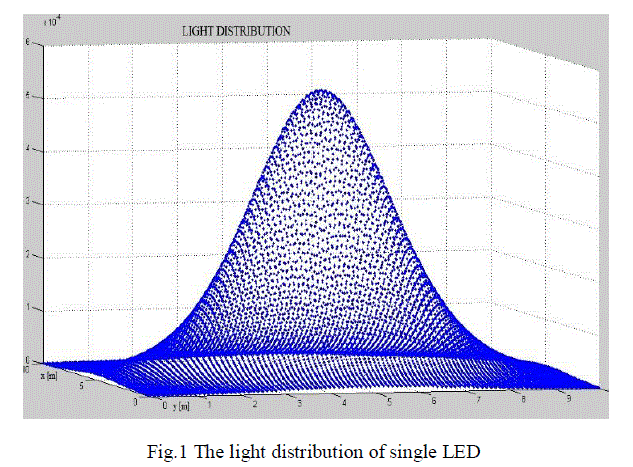 |
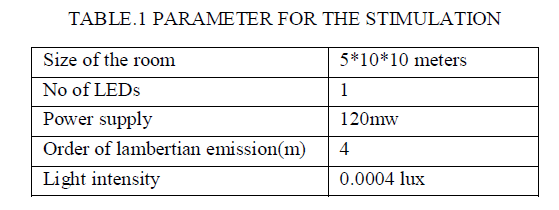
| The lambertian luminous energy distribution is used to simulate the fig.1, here the power to the single LED is 120mw with the following details shown in table. |
 |
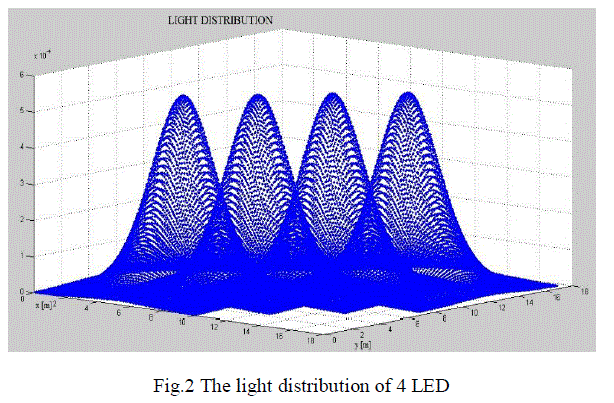 |
| The above figure shows light distribution with 4 LEDs, here light intensity is increased and the value is 8 lux with the power utilization of 120 mw. The lamps are hold at the ceiling and the sensors are fixed at the surface, so the light power distribution will be having some power loss during transmission and that is calculated using DAILUX software. |
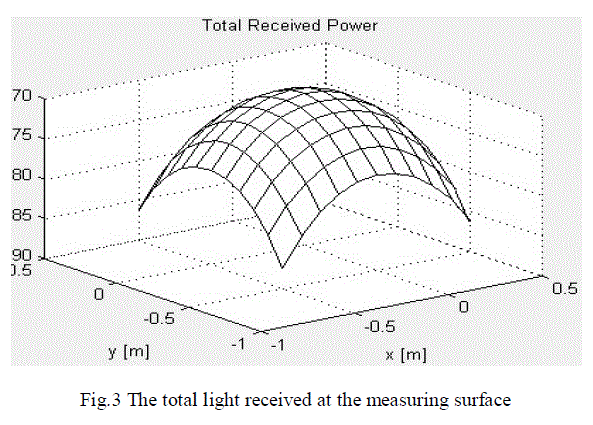 |
| The total light energy received at the human living surface shown in the fig.3, it show the light distribution is high at the region in between the LEDs and it starts decreasing when the measuring point moving away from the LEDs. |
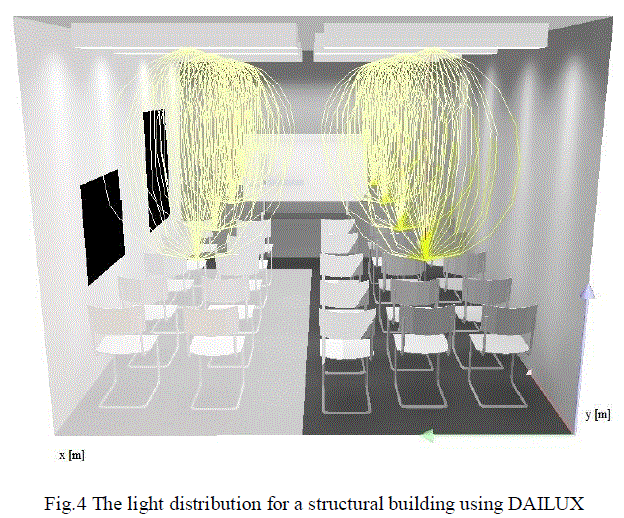 |
| DAILUX is a simulating software, here the light observing and reflecting factor of each building materials like paints, glass etc are calculated. It is used to 1.find numbers lights are required to get a complete visual area, 2. Calculate the total lumen(light distribution over the area), 3. To planning the whole building structure with a covered lighting. The fig.4 shows the light distribution the building constructed with two windows, some more study room materials with ceiling mounting lamps and the results are plotted in the fig.5. |
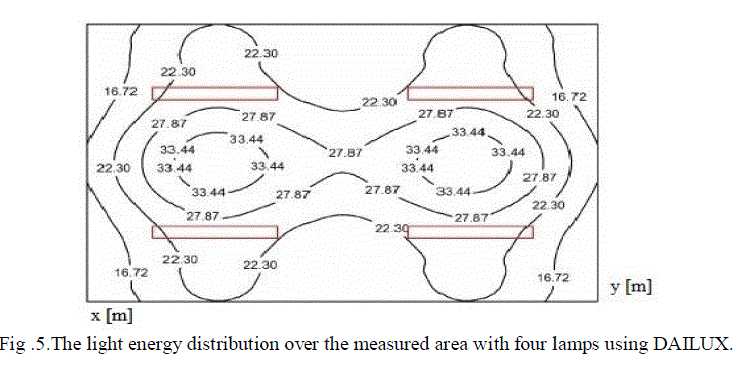 |
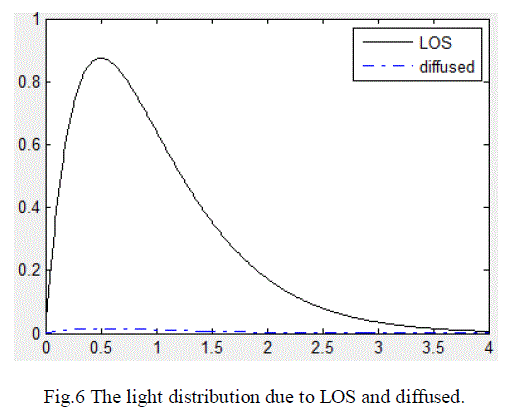
| The light intensity in between the lamps are high with respect to the other area as shown in the fig.5, here the output is similar to the fig.3 in the term light energy distribution measurements. The energy transmitted from the lamp is scatted in all direction with respective source, here the light energy hitting the surface is a sum of the light directly from source (field of view or line of sight) and the light reflected from the adjacent layers (diffused) as shown in fig.6, the diffused value is increased by using proper layers like paint, glass etc. |
 |
IV PROTOCOL WITH CONTROLLER |
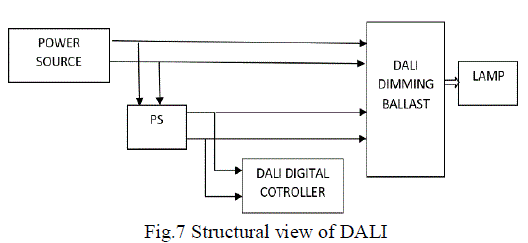
| DALI(Digital Addressable Lighting Interface) have high efficiency among the various lighting control protocols and it is standardized by IEC, These protocol is bi-directional, it have the capacity to transmit the command to ballasts and receive the response from the ballasts in the same line. Each DALI ballast has a non-volatile memory which contains its own settings, such as address, group assignments, scene levels, and fade rate. This capability allows DALI systems to operate without a mandatory central control unit. Digital data is send over a pair of conductors at 1200 bits per second. The DALI control wires may be installed as a combination of star, daisy-chain and tree. Loops are prohibited. |
| Limitations: |
| The total wire length per DALI bus must not exceed 300 meters (1000 feet) |
| There must be no more than 64 control points (ballasts, dimmers, relays) on a control bus |
| Each DALI bus requires a power supply at 16VDC and current limited to no greater than 250ma. |
 |
| Various types of electronic dimming ballasts available on the market, with the following three control methods: Pulse Width Modulation (PWM), phase control and low-voltage control (typically 1-10 V DC). |
| 1. The PWM control utilizes a high-frequency square-wave signal over separate control wires to dim lamps down to approximately 10% of maximum output. It is used to control maximum number of ballasts. |
| 2. The phase control method is used to dims lamps up to 1% and it also have very good stability with uniform dimming but it required large initial cost. |
| 3. The next control type uses a DC voltage sent to ballasts through separate control leads. A single control device can control 60 to 80 ballasts, with a stable dimming range of 100% to 20% or lower, depending on the low level capability of the ballast. |
V.CONCLUSION |
| The replacement of normal light by LED with its controlling protocol is used increase the power saving amount, here the LED is having good switching time with a high handshaking capacity for the serial communication DALI of a high information transfer between the lamps (ballasts) and controller. The stimulated results are based on the generation, distribution of light by obeying Lambertian cosine law. The sensory network with the lamp addressable controller is used get a high rate of energy saving in the building structure without affect the visual compactness. |
References |
|