Research & Reviews: Journal of Material Sciences
ISSN:2321-6212
ISSN:2321-6212
Anjali Shrivastava*, A. K. Shrivastava
Department of Physics, Jiwaji University, Gwalior, Madhya Pradesh, India
Received: 28-Nov-2022, Manuscript No. JOMS-22-81480; Editor assigned: 01-Dec-2022, PreQC No. JOMS-22-81480 (PQ); Reviewed: 15-Dec-2022, QC No. JOMS-22-81480; Revised: 22-Dec-2022, Manuscript No. JOMS-22-81480 (R); Published: 29-Dec-2022, DOI: 10.4172/2321-6212.11.1.002.
Citation: Shrivastava A, et al. Doping Effect of Zinc on the Structural, Morphological and Magnetic Properties of Mn Ferrites. RRJ Mater Sci. 2023;11:002.
Copyright: © 2023 Shrivastava A, et al. This is an open-access article distributed under the terms of the Creative Commons Attribution License, which permits unrestricted use, distribution, and reproduction in any medium, provided the original author and source are credited.
Visit for more related articles at Research & Reviews: Journal of Material Sciences
Manganese Ferrite (MnFe2O4) has ever been of great importance for their remarkable soft-magnetic properties, such as low coercivity and moderate saturation magnetization. Doping has always been found to affect the basic properties of the host material. With this concept in mind in the present work, Manganese Ferrite (MnFe2O4), host material, was doped with Zn in different proportions to have Mn1-xZnxFe2O4. Surfactant was used to limit the particle size in nano range. Co-precipitation method was used for the synthesis of nano particles. Material so obtained was annealed at 200 degree centigrade. All the samples were characterized using X-Ray Diffractometer (XRD), Fourier Transform Infra-Red spectrometer (FTIR), Scanning Electron Microscope (SEM) equipped with Energy Dispersive X-Ray Analysis (EDAX) and Vibrating Sample Magnetometer (VSM) for their structural, morphological, compositional and magnetic characterization, respectively. XRD confirms the presence of single phase cubic spinel structure in all the ferrite samples. Structural parameters such as lattice parameter, crystallite size, x-ray density and lattice strain were calculated from XRD data. The crystallite size, as calculated from Scherrer formula for all the samples are of the order of 6 nm-11 nm. Morphological studies show spherical shaped irregular size particles. The saturation magnetization (Ms) is found maximum for MnFe2O4. It decreases on Zn doping with a change in its magnetic behaviour.
Ferrites; X-ray Diffractometer; Scanning electron microscope; Vibrating sample magnetometer; Magnetization
Most of the ferrites are reported in literature have cubic spinel structure with soft magnetic properties. These ferrites have attracted attention of scientists to prepare and characterize them as they have novel magnetic and electric properties [1,2]. The ferrites with general formula AB2O4 have two distinct geometrical arrangements of atoms, normal and inverse spinel based on the reallocation of cation in two distinct sub-lattices, specifically the tetrahedral site (A site) and octahedral site (B site) [3,4]. Spinels have face-centered cubic crystal structure with space group Fd3mOk7 [5-9]. Mn-Zn Ferrites (MZF) has high magnetic permeability, saturation magnetization, resistivity, low coercivity and low power loss [10]. These materials have been revolutionized the electronic industry due to their wide applications in high density recording media, information storage systems, magnetic fluids, power supplies, biological tagging, gas sensors, actuators, microwave devices and medical diagnostics etc [11-14]. The spinel ferrites are semi conducting in nature. The structural, electrical and magnetic properties of ferrites depend on synthesis procedure, sintering temperature, chemical composition and microstructure of the elementary materials.
Fei Hua, et al. [15] have reported direct preparation of Mn-Zn ferrite nanoparticles using co-precipitation method, followed by refluxing process. They were successful in getting an increase in crystallite size on increasing the pH value of the solution. It is also reported that the material show maximum value of saturation magnetization Ms (58.6 emu/gm) at pH 13.
Banalata Sahoo, et al. [16] have designed superparamagnetic meso-porous silica encapsulated with MnFe2O4 nanoparticles by solvo-thermal method. The nanoparticles were mono-dispersed with a mean diameter of 200 nm with meso-porous silica shell of ~20 nm. The specific surface area of nano composites was 423 m2/g. This catalyst shows adsorption, degradation, and easy catalyst isolation.
Patricia, et al. [17] has synthesized nano-crystalline manganese ferrite followed by annealing at 400ºC and 500ºC. The sample annealed at 400ºC show pure spinel structure. It is reported that it decomposed to Fe2O3 after annealing at 500ºC in air. They are of the opinion that the effects of interactions and spin disorder affect the magnetic properties of the samples. These effects decrease the saturation magnetization and increase the coercivity. They have also reported the semiconducting behavior of the ferrites but behavior of manganese ferrites is not mentioned.
Lungu, et al. [18] have synthesized manganese ferrite (MnFe2O4) by two different methods. The first one based on co-precipitation followed by calcination at 900ºC and other one is hydrothermal method. Some other phases are also reported in MnFe2O4 in XRD analysis. It is found that samples prepared by hydrothermal method give better results.
Rodriguez, et al. [19] have synthesized quasi spherical Mg1−xZnxFe2O4 nanoparticles (~15 nm), (x=0–0.9), having inverse spinel structure using sol-gel method. They have reported that lattice parameter increases with the increase in Zn2+ contents. Saturation magnetization (Ms) is found to increase with Zn2+doping at lower concentrations (below x=0.5) but it decreases at higher (x=0.6) concentrations. The values of remanence magnetization (0.17 emu/g–2.0 emu/g) and coercive field (6.0 Oe–60 Oe) indicate a ferrimagnetic behavior.
To achieve high electromagnetic performance of Mn-based ferrites, various synthesis methods are reported, including co-precipitation, alcohol dehydration, hydrothermal synthesis, spray drying and sol-gel methods [20-22]. The superiority of co-precipitation method lies in its processing simplicity, preparation of highly uniform powder and production in large quantities. In the present study, Mn1-xZnxFe2O4 ferrites were synthesized using co precipitation method. The present paper reports the synthesis of pure and Zn-doped MnFe2O4 and their structural, morphological and magnetic parameters.
Zn doped Mn-Ferrites (MZF) Mn1-xZnxFe2O4 (x=0, 25%, 50%, 75% and 100%) were synthesized by co-precipitation method using Manganese chloride tetra hydrate (MnCl2.4H2O), Ferric chloride (FeCl3), Zinc nitrate hexa-hydrate (ZnNO3.6H2O) and Sodium Hydroxide (NaOH) as starting materials. NaOH was used as a precipitating agent. Oleic acid was used as surfactant. All the reagents were of analytical grade and used without any further purification.
All the initial materials were separately dissolved in distilled water in appropriate stoichiometry proportion and then mixed together. The mixture was stirred constantly. Sodium hydroxide solution was added slowly to this mixture, to set the pH of the solution at about 10. On NaOH addition, precipitation and agglomeration of particles took place. Oleic acid was added in the mixture to prevent the agglomeration of the precipitated particles. The mixture was then put in the Constant Water Bath (CTB) apparatus maintained at 80ºC for about 85 minutes. Thereafter, the solution was taken out from the apparatus to cool down up to room temperature.
The as-prepared precipitated particles were separated from the solvent and centrifuged (3000 rpm) for about 15 minutes. The centrifuged particles and then washed with distilled water and acetone to remove any residues or solvent impurities. The precipitate was then dried at room temperature and crushed to powder. The powdered material was then annealed at 200ºC for 4 hours. This powder was of Mn-Ferrites having dark brown colour. To get Zinc doping, different amount (x=25%, 50%, 75% and 100%) of Zinc nitrate hexa-hydrate (ZnNO3.6H2O) was added and similar procedure was repeated by adding NaOH solution and surfactant to this mixture. All mixed ferrites were dark brown in colour but the pure Zinc ferrite was yellowish.
The materials so prepared were then characterized using X-Ray Diffraction technique (Rigaku Miniflex 600 make) (XRD) to determine their structure, crystallite size, lattice parameters and many other parameters of the samples. IR spectrometer (Perkin Elmer make) was used to record FTIR spectra of the material. Scanning electron microscope SEM (ZEISS ULTRA PLUS make) was used for morphological studies. VSM (Lake Shore Cryotronics 7400-S make) was used to record magnetization of as-prepared material.
XRD analysis
The X-Ray Diffraction (XRD) technique is generally used for the determination of the average crystallite size [23-27], crystallographic structure [28-31] and also to ascertain the purity of phase present in our crystalline powdered samples. The so obtained XRD patterns (five in number) of Mn1-xZnxFe2O4 spinel ferrites nano crystals are shown in Figures 1a-1e. The XRD spectra were recorded over 2θ values ranging from 20° to 80°. It is clear from Figure 1a that all peaks (220, 311, 222, 400, 511, 440, 533 and 622) [32,33] represents the formation of single phase spinel ferrite which was in line of (JCPDS file No. card No. 10-0319, 74-2403, 22-1012) [16,34-53].

Figure 1: XRD spectra of (a) Pure Mn-ferrite (b) 25% Zn-doped (c) 50% Zn-doped (d) 75% Zn-doped (e) pure Zn-ferrites.
The presence of sharp peaks in the Figure 1a, confirms the crystalline nature of the material. No other peaks corresponding to secondary phases are found in the XRD spectra. Thus it can be inferred that there is no impurity present in the material. Structural parameters such as crystallite size, lattice parameter and X-ray density were calculated using the equations [35] and are shown in Table 1.
| Sample | Crystallite size (nm) | Lattice Parameter (Ãâ¡ÃÂ ) | X-ray density (g/cm3) | Lattice strain |
|---|---|---|---|---|
| Pure Mn-ferrite (A) | 7 | 9.35 | 3.73 | 0.62 |
| 25% Zn-doped (B) | 8.2 | 9.37 | 4.77 | 1.07 |
| 50% Zn-doped (C) | 6.6 | 9.374 | 4.78 | 1.66 |
| 75% Zn-doped (D) | 10.6 | 9.357 | 4.79 | 1.22 |
| Pure Zn- ferrites (E) | 10.7 | 9.36 | 3.89 | 0.39 |
Table 1. Crystallite size (D) Lattice Parameter (a), X-ray density (ρ) and lattice Strain (ÃâÃâ) for samples A, B, C, D and E.
The average crystallite size (D) was calculated from X-ray peak broadening of the prominent peak (311) at FWHM, using the Scherrer’s equation (1)
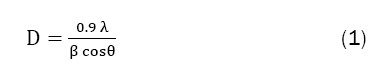
Where λ is the X-ray wavelength (λ=1.5406 Å), β is the peak width at half maximum taken for prominent peak, and θ is the Bragg’s diffraction angle. The average crystalline size as calculated comes out to be 6 nm-11 nm. All these parameters are as shown in Table 1. Furthermore these results also show an increase in crystallite size with increase in Zn content. The value of crystallite size (7.0 nm) for pure Mn-ferrite (sample-A) is smaller than the value (10.7 nm) for pure Zn-ferrite (sample E). The lattice parameter ïÿýïÿý was calculated, considering prominent peak (311), using equation (2);
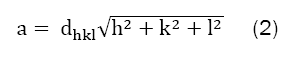
Where dhkl is inter-planar separation and (h, k, l) are miller indices. No significant changes are found in the value of lattice parameter on varying Zn-concentrations. The graphical variation of the average crystallite size and lattice parameter with Zn-content is shown in the Figures 2a and 2b.

Figure 2: Variation of (a) Crystallite size (b) Lattice parameter with Zn-content.

It is evident that when the Zn is added to the MnFe2O4 (sample B), the crystallite size is increased. For Mn:Zn=50:50 (sample C), the crystallite size decreases and attains lowest value. When Zn content was further increased (sample D and E), It again increases and attains highest value for ZnFe2O4 (sample E). On the other hand, however, lattice parameter “a” also show an increase in its value on addition of Zn to the Mn-ferrite (up to 50:50 composition) but the increase is insignificant. This increase (up to 50:50 compositions) in lattice parameter could be due to cation distribution at both, tetrahedral and octahedral sites [36].
Thereafter it decreases till 100% (ZnFe2O4). Such variation might be due to difference in ionic radius of Zn (0.82 Å) and Mn (0.91 Å). The variation in the lattice parameter with Zn substitution, obeys the Vegard’s law [37,38]. Such irregular variation in the lattice parameter on Zn substitution in MnFe2O4, can be related to the redistribution of cations at tetrahedral and octahedral sites, and size and structure of grains of the spinel ferrite [39].
The X-ray density ρx is determined using the equation (3):
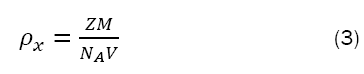
Where, Z=8 is the number of atoms in a unit cell for the spinel cubic structure, NA is Avogadro number, M is molecular weight and V is volume (a)3, of the cubic unit cell: The calculated values of X-ray density depends on the both molecular weight and volume of the samples [40]. The decrease in X-ray density also shows irregular variation with minimum value for pure ZnFe2O4 (sample E). This can be related to the change in lattice parameter on increasing the Zn-content. It is clear from Table 1 that the lattice strain increases up to the sample having Mn:Zn=50:50. Thereafter, it decreases and attains lowest value for ZnFe2O4 (sample E).
FTIR spectra
Fourier Transform Infrared Spectroscopy (FTIR) is used to ascertain the spinel structure of ferrites. In all spinel ferrites, two fundamental broad metal–oxygen bands exists [41]. In present work, FTIR spectra of complete range of Mn-Zn Fe2O4 at room temperature was recorded in KBr medium over the frequency range 4000 cm-1-400 cm-1 and shown in Figures 3a-3e. As stated earlier IR spectroscopy shows two major broad metal-oxygen bands in all spinels, and specifically in ferrites.

Figure 3: FTIR spectra of (a) Pure Mn-ferrite (b) 25% Zn-doped (c) 50% Zn-doped (d) 75% Zn-doped (e) Pure Zn-ferrites.
Intrinsic stretching of metal-oxygen vibration v1 exists at tetrahedral site 600 cm−1-500 cm−1, whereas over the range 450 cm−1-300 cm−1 another vibration v2 exist, can be attributed to the stretching of metal oxygen at octahedral sites [42].
Furthermore, the peaks around 600 cm−1-500 cm−1 are attributed to the metal–oxygen (Fe3+–O) stretching vibration at the tetrahedral site [43, 48]. Such peaks are present in as-prepared nano crystalline samples, whereas bands present at lower wave numbers are usually assigned to the vibration of ions in the crystal lattice [44]. These bands are characteristic of AFe2O4-type spinel ferrite nano crystals, and hence they confirm the formation of spinel structures. The variation in the value of band position may be due to increasing Zn-content because of the cation and oxygen bond length variations of tetrahedral or octahedral sites in spinels. As the metal–oxygen bond lengths for tetrahedral and octahedral sites are different, the FTIR spectrum shows related peaks at different positions. This confirms the purity of powdered samples, as there are no extra peaks related to any organic residue or impurities are observed. Thus, the FTIR spectrum supports the formation of pure spinel ferrite structures. Moreover, all the peaks shift towards lower wave number on increasing the Zn content in the material.
SEM micrographs
The SEM results of surface morphology of as-prepared materials are shown in the Figures 4a-4e. It is clear from these images that the surface in all the samples is not smooth and agglomeration of the particles is clearly seen. Figure 4a (MnFe2O4-sample A) show sheets separated with cave like structure. When Zn-doping is introduced in sample B and Figure 4b, morphology is changed. Flower like structure on the broken sheets and clusters of small particles are clearly seen. As Zn content is further increased (Mn:Zn=50:50) Figure 4c, morphology is further changed and sheet like structure with some cracks in it appeared. Small spherical shaped particles are also seen on these sheets. On further increase in Zn-concentration, significant changes, Figures 4d and 4e, in surface morphology are observed. Here, the particles change its shape from spherical to oval and flakes like structures are observed. The particle also attains some regularity in its morphology. This abrupt change in morphology might be due to complete absence of the Mn in this sample. Thus, it can be inferred that the changes in shape of the particles and surface morphology of the as-prepared material are due to the incorporation of Zn in host lattice.

Figure 4a: SEM image of Pure Mn-ferrite.

Figure 4b: SEM image of 25% Zn-doped.

Figure 4c: SEM image of 50% Zn-doped.

Figure 4d: SEM image of 75% Zn-doped.

Figure 4e: SEM image of pure Zn-ferrites.

Figure 5: EDAX spectra of (a) Pure Mn- ferrite, (b) 25% Zn- doped, (c) 50% Zn- doped, (d) 75% Zn- doped and (e) pure Zn- ferrites.
EDAX analysis
The compositional analysis of the elements present in the as-prepared materials was done by using Energy Dispersive X-Ray (EDAX) technique. The EDAX spectra of all the samples are shown in the Figures 5a-5e. The elemental composition deduced from the EDAX spectra are given in the Table 2. It is clear from these results that the elemental composition in all the samples are same as was taken during the beginning of their synthesis. The results clearly indicate that as Zn increases Mn decreases. The amount of Fe and O remain unchanged in all the samples. Thus, EDAX shows the perfect stoichiometry of the materials.
| Sample | Mn K (atomic % age) | Zn K (atomic age %) | Fe K (atomic age %) | O K (atomic age %) |
|---|---|---|---|---|
| Pure Mn-ferrite | 25 | 0 | 19 | 56 |
| 25% Zn-doped | 21 | 6 | 18 | 55 |
| 50% Zn-doped | 13 | 11.5 | 18.5 | 57 |
| 75% Zn-doped | 9.5 | 14.3 | 22.2 | 54 |
| Pure Zn- ferrites | 0 | 21 | 20.4 | 58.6 |
Table 2. Compositional analysis of Pure Mn-ferrite, 25% Zn-doped, 50% Zn-doped, 75% Zn-doped, Pure Zn- ferrites.
Vibrating Sample Magnetometer (VSM)
Magnetic studies of the as-prepared materials were done at room temperature (300ºC) with the help of Vibrating Sample Magnetometer (VSM). The magnetic parameters: Saturation Magnetization (Ms), Coercivity (Hc) and Remanence (Mr) of all the samples, were calculated from VSM plots Figures 6a-6e and the results are shown in Table 3.
| Sample | Saturation Magnetization (emu/g) | Remanence (emu/g) | Coercivity (Gauss) |
|---|---|---|---|
| Pure Mn-ferrite | 63.07 | 0 | 0 |
| 25% Zn-doped | 33.36 | 0 | 0 |
| 50% Zn-doped | 48.97 | 1 | 138.62 |
| 75% Zn-doped | 57.09 | 1.09 | 178.02 |
| Pure Zn- ferrites | 49.13 | 1 | 133.57 |
Table 3. Magnetic measurements of synthesized ferrite samples.

Figure 6a: VSM spectra of Pure Mn-ferrite.

Figure 6b: VSM spectra of 25% Zn-doped.

Figure 6c: VSM spectra of Pure 50% Zn-doped.

Figure 6d: VSM spectra of 75% Zn-doped.

Figure 6e: VSM spectra of pure Zn-ferrites.
It is evident from Figures 6a-6e that the value of coercivity (Hc) and remanence (Mr) is zero, (sample A and sample B) which is a characteristic of superparamagnetic nano crystals [49-51]. Therefore, these samples show superparamagnetic nature. As the Zn-concentration is increased, the magnetic behaviour of the materials gets completely changed from super-paramagnetic to soft ferrimagnetic.
It is clear from the Table 3, that the saturation magnetization is maximum (63.07 emu/g) for pure Mn-ferrite (sample A). As the Zn is introduced, a sharp decrease in its value is observed. As the Zn-doping concentration is increased up to 75%, the value of saturation magnetization is also increased. But for pure Zn-ferrite (sample E), the value of Saturation magnetization is again decreased and reached at 49.13 emu/gm. Hence, the Saturation of Zn-ferrite is lower than that of Mn-ferrite. Since, sample A and sample B show superparamagnetic nature, the value of Remanence (Mr) is zero. As the Zn concentration is increased, a small hike in its value took place. Further increase in Zn concentration shows no significant change in its value. On the other hand sharp increase in coercivity (Hc) is found with an increase in Zn-doping concentration up to 75%. Further increase in Zn-doping concentration results a decrease in coercivity for Pure Zn-ferrite (sample E).
It is well known that the magnetic properties of ferrites are largely depends on distribution of cations on tetrahedral and octahedral positions [52]. Zn-doping replaces Mn ions from these sites and Zn gets substituted at these locations. Such replacement clearly affects the magnetic properties of the as-prepared Mn-Ferrites.
Pure and Zn-doped Manganese ferrites Mn1-xZnxFe2O4 (x=0, 25%, 50%, 75% and 100%) are successfully synthesized using co-precipitation method. The as-prepared material is characterized for XRD, FTIR, SEM-EDAX and VSM. The crystallite size calculated from XRD data is in the range of 6 nm-11 nm, which are well within the nano-range. FTIR spectra confirm the presence of all related functional groups in the material. SEM results show smaller size particles with irregular surface morphology. However, for Pure Zn-ferrite (sample E), regularity in the morphology and shape is observed. EDAX spectra confirm the perfect stoichiometry of the composition of elements. VSM results reflect the magnetic behavior of the as-prepared nano particles. The magnetic behavior is changed from superparamagnetic to soft ferrimagnetic (sample A to sample E respectively). Saturation magnetization (Ms) is observed to be maximum for MnFe2O4, which decreases as Zn is incorporated. Thus, these results confirm that the Zn doping affects the structural and magnetic properties of Mn-ferrites.
The authors are thankful to CIF, Jiwaji University, Gwalior and IIT, Roorkee for the characterization of the samples.
This research did not receive any specific grant from funding agencies in the public, commercial, or not-for-profit sectors.
None.
All data published herein will be made available upon request.
[Crossref][Google scholar][EBSCO]