ISSN ONLINE(2278-8875) PRINT (2320-3765)
ISSN ONLINE(2278-8875) PRINT (2320-3765)
Chetan Sheth1, B. R. Parekh2, L. M. Manocha3 and Parul Sheth3
|
| Related article at Pubmed, Scholar Google |
Visit for more related articles at International Journal of Advanced Research in Electrical, Electronics and Instrumentation Engineering
This work presents an insight into the effect of conductive filler content on both electrical and thermal properties of a polymer composite system. The electrical conductivity of an insulating polymer can be achieved by dispersing conducting fillers (e.g., metal, graphite powder, carbon black, carbon fiber) in the polymer matrix. The resulting materials are referred to as conducting polymer composites. Electrical and thermal properties of epoxy/chopped carbon fiber composites were experimentally studied in this work. The composites are processed by hand mixing technique. The weight fraction of the chopped carbon fiber (CCF) ranged from 0 wt % (as such epoxy) up to 15 wt % with the epoxy resin. By discharging a high voltage (D.C.) through the composite it was found that the resistivity of the composite decreased. The conduction mechanism of composites was studied by means of exploring the current-time characteristics and frequency dependence of conductivity. The A.C. electrical conductivity (σ (ω) a.c.) for these composites have been measured over the frequency range (102 -106) Hz at room temperature. It is found that A.C. conductivity increased when increased conductive filler concentration and frequency. Epoxy/chopped carbon fiber composites show significant differences from the neat epoxy resin measured in the frequency range. The D.C. conductivity at room temperature, percolation threshold was found when CCF (chopped carbon fiber) is added in the range of 3 and 5 wt%. At 5 wt% of filler loading breakdown phenomena was observed. This effect was attributed to local dielectric breakdown of polymer layer between carbon fibers. The optical microscopy revealed the microstructure at critical filler concentration (fc). The thermal characterization done by Differential Scanning Calorimetry (DSC) for glass transition temperature (Tg) shows unpredictable results.
Keywords |
| polymer matrix, composites, conductive fillers, DC and AC conductivity, percolation threshold, glass transition temperature, DSC. |
INTRODUCTION |
| The electrical conductivity of polymer composites filled with conductive fillers strongly depends on the filler content and its concentration. Composite conductivity practically coincides with that of the polymer matrix at low concentrations of the filler. A sharp drop of conductivity occurs at some critical filler content (fc) and then the composite conductivity value strives toward that of the filler. This phenomenon can be explained in terms of the percolation theory as follows. Conductive fillers agglomerate in the composite as clusters. As the size and number of the clusters increases with increasing filler content, at some critical filler content (fc), that is called the percolation threshold, the cluster becomes an infinite and the material becomes conductive. There are few models that predict conductivity (or resistivity) behaviour based upon filler content [1-3]. Most of them try to evaluate a fraction of filler which is involved in the infinite cluster and consequently makes a contribution to the composite conductivity. One of the main features of composites filled with CCF is that the agglomerates of fillers in the infinite cluster are still separated by thin gaps of a polymer layer. It results in a variety of conduction mechanisms in such composites: tunnelling, usually enhanced by thermal fluctuations of local field; dielectric breakdown, with significant increase of local temperature; internal field emission; overlap of wave functions, giving high conductivity across the gap; and graphitic conductance [4].Variation of the filler content can also change a conduction mechanism within the infinite cluster of conductive fillers. Because of this the former three mechanisms usually take place in composites with moderate filler content and the later two mechanisms in highly loaded composites. |
| Apart from the filler content there are other factors that can determine which mechanism will play a dominant role; primarily: size and shape of filler; temperature; and strength and frequency of an electrical field. A variation of any of these factors helps to reveal the mechanism governing the conductance within the composite under consideration. For instance, investigation of the current-time characteristics rather than traditional voltage-current characteristics in literature is employed for exploring of conduction mechanisms in D.C. electrical conductivity. |
| A.C. conductivity is also one of the studies done on solids in order to characterize the bulk resistance of the material sample. Measurement of A.C. conductivity can be done by different techniques. The currently used technique is the complex impedance spectroscopy. This study also gives information on electrical properties of materials and their interface with electronically conducting electrodes [5]. |
| In 2005 the A.C. electrical properties of fiber glass/epoxy composites, studied by Al-shabander [6] was found that the A.C. electrical conductivity increases with increasing frequency. |
| In 2011 the effect of Aluminium on A.C. electrical properties of polymer composite were studied by H.I.Jafar and friends [7], they found that the concentration of Aluminium in epoxy matrix increases the A.C. electrical conductivity with increasing frequency. |
| A.C conductivity is different from the D.C conductivity, where the frequency of electric field is constant during D.C. conductivity but during A.C. conductivity, frequency of the electric field is variable. The effect of the frequency (ω), has been studied. A common feature for A.C. measurements is that A.C. electrical conductivity σa.c. (ω) increased when the frequency is increased, according to the equation [8]: |
 |
| Where ω is the angular frequency (ω=2πf), σtotal (ω) is the measured total electrical conductivity, σd.c .is the D.C. conductivity which depends strongly on temperature and dominate at low frequencies and high temperature, while σa.c. is the A.C. conductivity which is weaker temperature dependence than σd.c. and dominate at high frequency and low temperature then, the empirical relation for the frequency dependence A.C. conductivity is given by [8, 9]: |
 |
| Where, A1 is constant, and (s) is a function of temperature and is determined from the slope of a plot σa.c. (ω) Versus ω, then (s) is not constant but decrease with the increasing temperature usually ranging 0<<1 and approaching unity at low temperature and decreasing (0.5) or less at high temperature [10]. |
| The total conductivity was calculated from the equation: |
 |
| Where T is the thickness of the measured sample, G is the sample conductance, and A is the cross sectional area. The effect of the conductive fillers in polymer composites on the glass transition temperature (Tg) has been studied for different filler concentration. In some cases an increase in Tg is reported in literature [11-14], but the opposite result is also possible [15]. An initial decrease in Tg followed by an increase, at higher filler loadings, was observed in epoxy/carbon nanotubes composites [16]. In many cases, the amount, the dispersion and the surface conditions of the fillers play important role in the changes in Tg and some other properties of the composites [11, 17, 14]. |
| In the present work, the conduction mechanism of a composite consisting of an epoxy resin as a matrix and chopped carbon fiber (CCF) as a conductive filler was studied by investigating current-time characteristics and conductivity dependence on the frequency of electrical field. Applying a high voltage (DC) was found to decrease irreversibly the resistivity of the composites studied. This effect was attributed to the dielectric breakdown in polymer layer between CCF at the place of a contact. Work also focus on the effect of filler loading on glass transition temperature (Tg). |
EXPERIMENTAL TECHNIQUES |
| A. Materials |
| The polymer used in this work is epoxy resin, LAPOX, L-12 supplied by M/s Atul Chemicals, Valsad. The hardener used was LAPOX, K-6, supplied by M/s Atul Chemicals, Valsad. Carbon fibers were used in this study to reinforce the Epoxy which was supplied by Toray Industries, Japan. The average length of carbon fibers chopped (short) 10-30 μm, fiber diameter 3-10μm, and with density 1.76 gm/cm3.The stoichiometric ratio of epoxy/hardener was 100:10 (w/w). All the components of the system are commercial products and were used without purification. |
| A. Composite preparation and methods |
| i. Composite preparation |
| The Epoxy resin/Chopped carbon fiber (CCF) composites were prepared by the dispersion of the determined amount of CCF in a glass beaker. Prior to that procedure, the carbon fibers were degassed under vacuum for one hour at 1250C. The epoxy resin (polymer matrix) was heated at 800C in order to decrease the viscosity. The stoichiometric amount of CCF and solvent (acetone) was added to the weighted epoxy resin and mixture is mixed-up by hand mixing technique for 15 min. to reduce the porosity. Again the mixture was heated at 700C in order to evaporate the solvent and reduced the viscosity. Then the mixture was magnetically stirred for seven hours at 260 rpm and degassed under vacuum for 20 minutes. Finally, the mixture was sonicated for 25 minutes in order to break up the CCF agglomerates [18] and degassed again. Then the stoichiometric amount of hardener was mixed up drop by drop in to the solution till exothermic reaction starts. The homogeneous solution was poured in rectangular shaped open glass mold to developed three identical samples and cured at room temperature for 24 hours. Then samples were subjected to a post-curing procedure at 750C for seven hours in oven. The cure schedule is confirmed by DSC of epoxy resin. At last samples were prepared for various characterization techniques. Series of three identical specimens were produced, each series with different filler content, starting from 0.0 weight % filler(neat epoxy),1%,3%,5%,7%,9%,11%,13% and 15% w/w. |
| Note: For different characterization specimen geometry of physical dimensions were different. |
| ii. Packing Density |
| Densities of the epoxy/CCF composites were calculated according to the ASTM C-838 t-91 which is given by the formula (1) [19]: |
 |
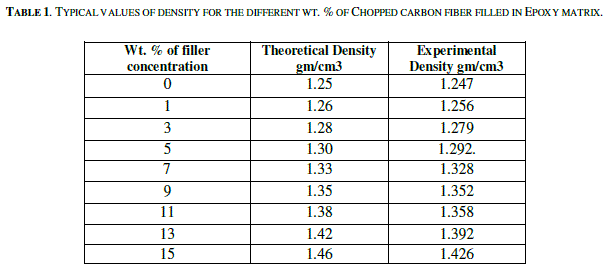
| Where, W is the weight of the composite and V is the volume of the composite. Densities of the composites experimentally cross checked by the Archimedes technique in distilled water, where maximum deviation of the theoretically calculated density was 2.33 %. Each reading of the density is the average of five readings. Typical values of densities of the composites for different weight % of filler concentrations are presented in Table 1. |
 |
| iii. Optical Microscopy |
| To study the microstructure of composites, samples were cut in very small sizes for cross-sectional view. Then for optical microscopy samples were embedded in epoxy matrix and polished for smooth surface. Microscopy of all composites was done by using Leitz optical polarized microscope. |
| iv. Differential Scanning Calorimetry (DSC) |
| To analyse the thermal characteristics of composites, their glass transition temperatures (Tg) were measured using a Mettler Differential Scanning Calorimetry (Mettler Toledo, Model: DSC-8226) equipment under nitrogen atmosphere. The experiments were performed at a programmed heating rate of 10 0C/minute with scanning up to 200 0C from room temperature. The Tg data reported in this paper are an average value of 3 measurements and the error in the measurement is around 1%. |
| v. Electrical conductivity measurements |
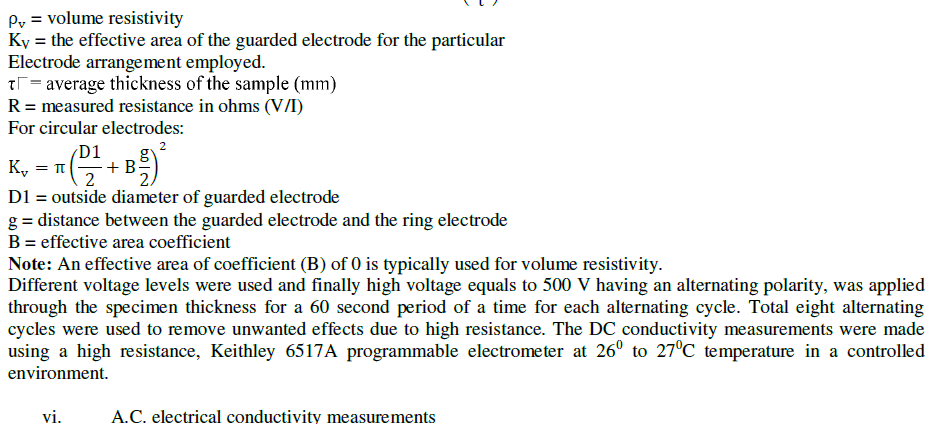
| For the electrical measurements, specimens in the form of squares, 30x30 mm2 were cut from the composite blocks with a thickness of about 3 mm. Three identical samples for each filler concentration utilized for measuring electrical resistivity/conductivity. Copper electrodes with silver coating on the surfaces of electrodes were used in order to ensure a good electrical contact with samples. The samples employed for electrical measurements were in form of square blocks, which were sandwiched between circular copper electrodes. The D.C. volume (bulk) conductivity of samples was measured with two point method as resistivity of specimens is enough high, employing Alternating Polarity Test, which is a novel technique to measure the high resistance with excellent repeatability compare to conventional two point method in literature. The electrical leads from the meter were fixed to copper rods of designed assembly for electrical conductivity measurements, which is very close to ASTM D257 for measurement of high resistance [20]. The Alternating Polarity Resistance/Resistivity test is designed to improve high resistance/resistivity measurements [21, 22]. These measurements are prone to large errors due to background currents. By using an alternating stimulus voltage, it is possible to eliminate the effects of these background currents. When this test is run, the V-Source will alternate between two voltages (V-OFS + V-ALT) and (V-OFS - V-ALT) at timed intervals (measurement-time). Current measurements are taken at the end of each of these alternations and after calculation of Icalc resistance values are computed. Icalc is a weighted average of the latest four current measurements, each at the end of a separate alternation. The resistance value is then converted to a resistivity value if the meter has been configured for resistivity measurements. Resistivity of the specimen is given by the formula (2) [22]: |
 |
 |
| Experimental study of A.C. electrical conductivity measurements may provide valuable information about the conduction mechanisms of epoxy/chopped carbon fiber (CCF) composites. The values of these effects can be understood from the variation in electrical conductivity with frequency. The range of the frequency that of concern to this work is 102-106 Hz in controlled environment. |
| To study and measure the effect of CCF wt% and frequency of applied electric field on the A.C electrical conductivity of epoxy/CCF composite HP 4284A programmable multi-frequency LCR meter is used with LABVIEW software in controlled environment. The sample holder is situated with two copper electrodes having silver coating on the surfaces of electrodes to ensure better electrical contact with specimens was used. Samples were sandwiched between silver coated copper electrodes having 1cmx1cmarea. The high and low specimen holder terminals were connected to multifrequency LCR Meter (model HP-4284A). |
RESULTS AND DISCUSSION |
| A. Packing density |
| Fig.1 shows plots of theoretical and experimental densities of the CCF composites. The pure epoxy has theoretical density of 1.23 gm/cm3. The density of the composites increases as the wt % of filler concentration increases. It is due to the, some more percentage of CCF fillers having higher density (1.76 gm/cm3) packed within definite volume of composite and because of the well dispersion of CCF fillers in polymer matrix. Eventually there is a change of 16 to 17% in density compare to the density of pure epoxy. The experimental density of the composites containing up to 9 wt % CCF is close to that of theoretical density. It indicates that the prepared composites are almost porosity free. However, the experimental density of the 11, 13 and 15 wt% composites is lower than that of the theoretical density by approximately 1.6 %, 2.0% and 2.33 % respectively. This is due to the small formation of CCF aggregates which hinder the infiltration of n polymer through the aggregates during processing [23]. |
| B. Microstructure of epoxy/CCF composites |
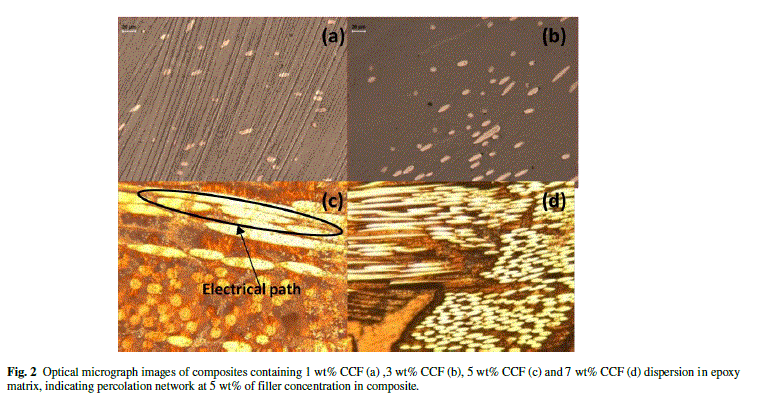
| The influence of magnetic stirring and sonication time on the dispersion of CCF fillers in the matrix is shown in Fig.2. Fig. 2(a, b, c and d) shows the dispersion of CCF fillers in the prepared composites before and after percolation respectively. It can be seen that dispersion of CCF fillers is uniform due to magnetic stirring and sonication. Moreover, the CCF fillers are surrounded by the epoxy matrix making star like structure. Optical microscopy clearly shows that at percolation interparticle distance reduced drastically and conductive networks formed. It can also be seen that at higher filler loading some fibers make direct contact. Due to this tunnelling and hopping of electrons possible through composite and electrical resistivity reduced in a step like manner. |
 |
| C. DC Electrical Conductivity |
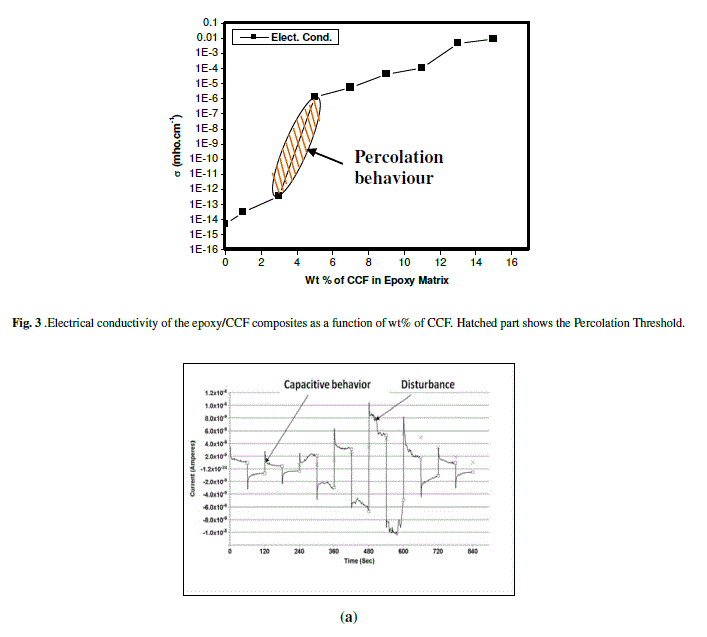
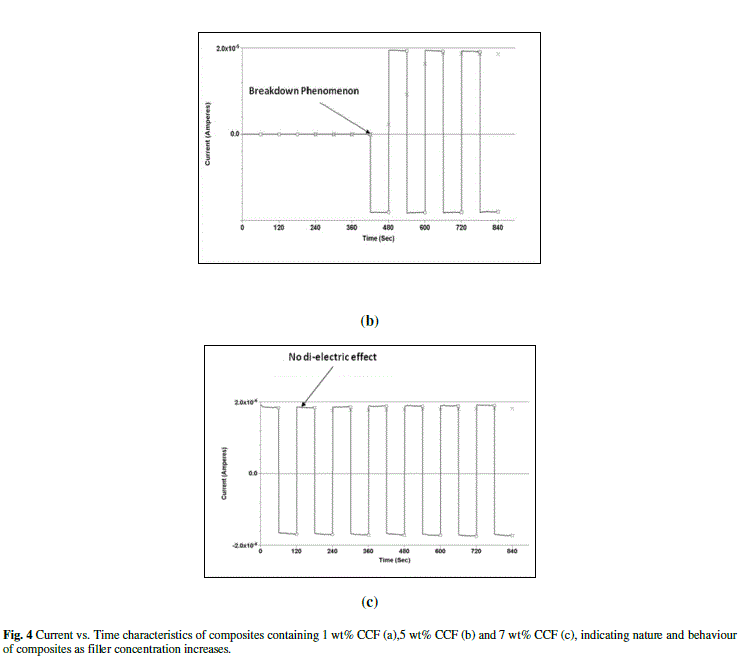
| Application of a high voltage can irreversibly decrease the resistivity. As was mentioned above, a polymer layer exists between filler particles and/or their agglomerates. Therefore an electrical current usually flows in the composite through the agglomerates separated by the polymer gaps. It should be noted that voltage across the gap is expected to be higher than the macroscopic voltage, V, by a factor, M, equal to the ratio of the average size of the conducting aggregate to the average gap width [24]. If the factor M or voltage V is large enough, dielectric breakdown can take place. This phenomenon was observed for polymer composites filled with carbon black [24, 25]. The average size of the conductive agglomerates in these composites was approximately 1 μm. There is a distribution of the inter-fiber contacts by the gap width as was discussed in literature [26, 27]. Some of the fibers are in direct contact with each other whereas others are separated. “Direct contact” means that there are no polymer gaps between adjacent fibers. Because the fiber diameter is one order of magnitude greater than the agglomerate size in composites a larger voltage can exist across the gap in composites. If this voltage is great enough it can result in local dielectric breakdown of the polymer layer in the gap. During dielectric breakdown, an irreversible damage in the form of carbonization of the polymer occurs which usually gives rise to the formation of a conducting pathway [28, 29]. So, it is most possible that the large diameter of the fibers is the main reason why local dielectric breakdown takes place in composite with carbon fibers. Fig.3 shows that the resistivity of the studied composites exhibits percolation behaviour with increasing CCF content. The breakdown/threshold takes place at 5% of CCF loading. After breakdown phenomena resistivity of all composites irreversibly decreased. Beyond that resistivity decreases gradually. Such behaviour can be explained qualitatively as follows: in composites with a high content of CCF, most of the fibers are in direct contact with each other and, because of this, breakdown does not decrease the resistivity value significantly. In the composite with moderate CCF content, breakdown is more effective since a lot of the fibers are separated and breakdown generates the contacts between them. In order to clarify the type of the conduction mechanism, the current-time characteristics were studied for the composites with different weight percent content of CCF. Fig. 4(a), 4(b) and 4(c) clearly shows that as filler content increasing di-electric behaviour disappears and composites transform from insulators to semiconductors and finally into conductors. Ohmic behaviour should be expected if the graphitic type of conductivity exists in the composite [30]. |
| However, it is not possible to assert that in these samples graphitic-type conductivity is present since in some cases the resistivity of composites possessing the tunnelling type of conductivity also obeys Ohm’s law [30]. |
 |
 |
| D. Frequency dependence of electrical conductivity (σa.c.) |
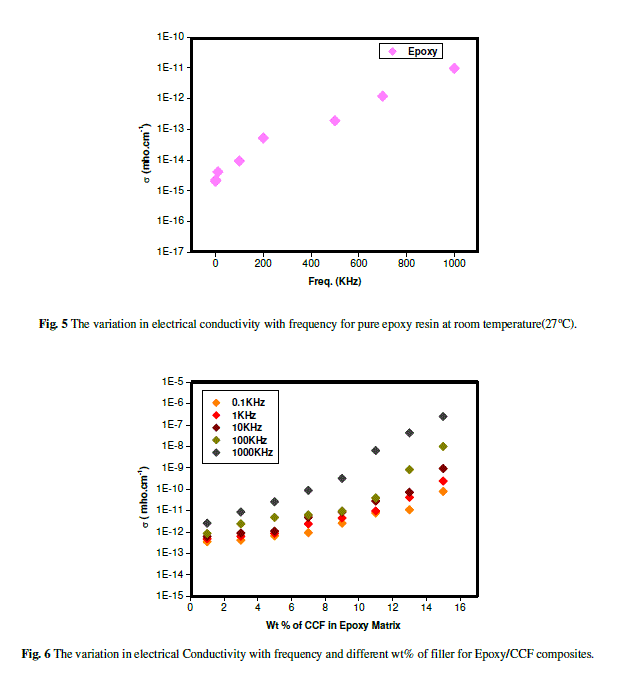
| A.C. electrical properties of epoxy/CCF composites were studied as a function of the filler concentration and frequency. Fig. 5 shows the relation between σa.c. (ω) and Freq. (ω) for pure epoxy at room temperature (270C) and Fig.6 for epoxy/CCF composites. It is clear from the figures that σa.c. (ω) increased with the increase of frequency according to eq. (2) at room temperature. |
| A frequency dependence on A.C. conductivity (σa.c. (ω)) has been observed in many amorphous semiconductors and insulators both inorganic and polymeric material, has the form σa.c. (ω) = A ω s, where, s is the exponent, A is the proportional factor. Fig.6 shows the variation of the A.C conductivity (ïÃÂóa.c.) with frequency for epoxy/carbon fiber composites for different wt% of CCF at room temperature (270C), while it increased rapidly above 10 KHz. ïÃâ¬Ã In this frequency region the ïÃÂóa.c. (ω) is due to two main processes those are called ions motion and the transport near or at the interstitial surface between carbon fibers and epoxy resin. The increasing of ïÃÂóa.c. (ïÃÂ֕Ãâ¬Ã©Ã¯Ãâ¬Ã in high frequency region can be related to the electronic polarization The electrical conductivity increase with increasing the wt% of chopped carbon fibers, This electrical conductivity of epoxy/CCF composites at higher filler concentration, show almost similar values with semiconductor materials. |
 |
| E. Differential Scanning Calorimetry (DSC) |
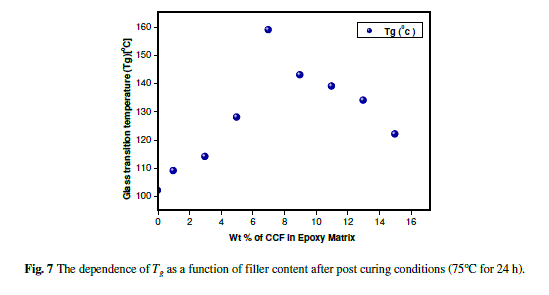
| The Tg dependence on the CCF-content is presented in Fig. 7 for the post curing condition (75°C, 24 h). At low filler contents, Tg increases up to a maximum value (at about 7% w/w) of filler content, and afterwards decreases. In Table 2 the glass transition temperatures for post (Tgp)-cured states are presented. This unexpected behavior shows a remarkable difference with the predictions of the statistical theory available for randomly dispersed and distributed fillers. A similar behavior was observed in poly (vinyl alcohol)/clay composites [31]. It can be qualitatively explained by the coexistence of the two mechanisms (namely interfacial constrains and free volume increase [32]) which can be responsible for the Tg shifting. In any composite the two mechanisms are in dynamic equilibrium. The equilibrium point depends on many factors (filler’s amount, size, etc.) and in that way it analogically affects the Tg. |
| According to the first mechanism, a short-range, highly immobilized layer of a few nm thick is developed near the surface of the fillers. In this interaction region of the polymer layer surrounding the fillers, the conformational entropy and the chains kinetics are significantly altered. As the filler content increases the volume fraction of the interaction region in the composites increases too. The polymer chains in this region are under constrain because of the interfacial polymer-filler interactions and therefore Tg of the composites has been shifted to higher temperatures. Based on the concept of free volume, the increase of the filler content increases the free volume due to loosened molecular packing of the chains. This extra created free volume assists the large-scale segmental motion of the polymer. As a result, Tg of the composites decreases as the filler loading increases. |
| In our case, at low filler content the first mechanism (interfacial constrains) dominates and therefore contributes to a Tg increase with the filler loading. After a certain amount of filler (7% w/w) the second mechanism (free volume increase) starts to be dominant and the Tg decreases with the filler content. This inversion in the domination of the mechanisms which are responsible to Tg shifting could be explained as a consequence of a transition of the filler arrangement within the matrix. The critical value of CCF content separates, in fact, a dispersed and an agglomerated state and can therefore not be compared with the one obtained through a purely random geometrical process. The CCF fillers have permanent electrical charges at their surfaces, which are probably responsible for this morphological structure. |
 |
 |
CONCLUSIONS |
| The electrical and thermal behaviour of epoxy/chopped carbon fiber (CCF) composites was systematically investigated. |
| (1) Applying a D.C. high voltage was found to irreversibly decrease the resistivity of polymer composites filled with chopped carbon fibers. This effect was attributed to the formation of conductive pathways due to local dielectric breakdown at the place of inter-fiber contact. The tunneling mechanism of conduction can be unambiguously supposed only for those samples (before break down) with a moderate content of chopped carbon fibers. The samples with a high content of CCF (after percolation and break down) seem to conduct electrical current both through continuous paths of the fibers and through the paths with the gaps. |
| (2) The A.C. conductivity increases as the increase of frequency and filler concentration. It is found that at higher frequencies changes in conductivity was also greater. |
| (3) The dependence of Tg on the filler content shows a peculiar behavior. An increase up to a maximum, corresponding to about 7% w/w of CCF, followed by a decrease in Tg. This partially could be attributed to high degree of crosslink density of the matrix which covers the filler contribution. |
| (4) A correlation between conductivity and glass transition behavior in epoxy resin based composites is observed. |
ACKNOWLEDGEMENT |
| This work is supported by Materials Science Department (Sardar Vallabhbhai Patel University) and SICART (Charutar Vidya Mandal) at V. V. Nagar, Anand, Gujarat, India. |
References |
|