Research & Reviews: Journal of Material Sciences
ISSN:2321-6212
ISSN:2321-6212
Doaa Saayed*
Department of Physical Chemistry, University of Tehran, Tehran, Iran
Received: 11-Apr-2022, Manuscript No. JOMS-22-60237; Editor assigned: 13-Apr-2022, PreQC No. JOMS-22-60237(PQ); Reviewed: 25-Apr-2022, QC No. JOMS-22-60237; Revised: 27-Apr-2022, Manuscript No. JOMS -22-60237(R); Published: 04-May-2022, DOI: 10.4172/2321-6212.10.4.004.
Visit for more related articles at Research & Reviews: Journal of Material Sciences
This work investigates the effect of silicon substrate and temperature on ice formation through molecular dynamics simulations. It was found that silicon substrate accelerates the ice formation rate. Depending on the temperatures of the systems, the formation rate can be accelerated or decelerated. The obtained results showed that, as the temperature increased from the lowest temperature 100 K to the highest temperature 220 K, the number of water molecules transformed into ice decreased. We found that the hydrophobic property of silicon is not a barrier to approaching ice formation. The high correlation between Si and the hydrogen atoms of water molecules stimulated the ice formation on the surface of silicon and allowed the formation of amorphous ice directly on the surface of silicon. The temperature effect on ice formation distinguished two different behaviours, one from 100 K to 180 K and the second above 180 K. These behaviours were related to the temperature at which amorphous ice is stable. The average number of hydrogen bonds and their lifetime are in parallel with the number density profiles that can best explain how silicon affects ice formation. The coordination number of water molecules increased with the decrease of the temperature of the silicon substrate, which means that bigger ice clusters were found. The ice molecules formed near the silicon substrate are more recognized than in bulk. To better understand these effects, bulk systems were used as comparative systems.
Silicon substrate; Molecular dynamics simulation; Ice formation; Temperature effect
Nowadays, the study of water and ice nucleation is gaining the scientific community's attention more than ever before. Many experimental and theoretical studies were carried out on ice nucleation in the presence of different substrates and systems under various conditions. Understanding how ice is formed is essential since nucleation is becoming an emerging approach in many fields such as atmospheric studies [1,2], water transport in plants [3], microbiology [4], and food preservation [5].
Some of the factors that can provoke or inhibit ice formation are pressure, the addition of a seed, and electric fields. Investigating the effect of applying pressure on the ice formation phenomenon showed that ice melts under pressure while it reforms when the pressure is lifted [6]. In recent years another method was detected, which is the addition of a "seed,” such as ice, to the simulation from which nucleation will start [7,8]. Several conditions were studied to explore their link with ice nucleation, whether inhibiting or provoking. Applying an electric field in simulations favoured the formation of cubic ice structure because the electric field polarizes ice, and hence cubic ice can exist in the poles, whereas hexagonal ice clusters do not form under polarizable conditions [9-11].
Other factors related to the substrate type and its properties affect the ice nucleation. If we want to explain the hydrophobicity of the substrate, it can be concluded as follow: the ice-nucleating efficiency will be lost if adsorption is too strong due to the high coverage of water molecules. The energy of adsorption will increase with the increase of the hydrophilicity of the substrate [12]. Lupi et al. found that graphite surface can promote ice nucleation, but the structure of the surface can affect such nucleation as well. They also concluded that rough surfaces inhibit nucleation; however, the flat ones enhanced it [13]. Moreover, the presence of graphite favours the layering of water molecules [14]. The first layer establishes layering, and then the second layer will be stacked directly above the first one [13,15,16]. Another study [17] that depended on silica and graphite substrates showed that the density of water increased in the presence of these substrates where the solid substrate perturbs the interfacial water layer for only a few molecular diameters away from the surface.
On the kaolinite surface, an inorganic surface, the hydroxyl groups play the role of the donors and the acceptors of hydrogen bonds [18]. The hydroxyl group reorients in the presence of aluminium Al to form a hexagonal ice structure. While, from the site of rigid Si of the kaolinite, layers of hexagonal and cubic ice patterns are seen with no need for hydroxyl groups reorientation [19]. Al-terminated and OH-terminated alumina surfaces showed that the nature of the surface termination determines the organizing of interfacial water molecules yielding well-defined patterns [20]. The temperature plays a vital role in controlling ice formation or melting. In the case of selecting a temperature a few degrees below the melting temperature, depending on the hydrophobicity of the substrate, it can lead to the formation of ice [21]. The formation of ice passes through two stages: First, the pre-critical ice nucleus will be formed during a period named the induction period, and then it will keep forming and re-melting until it is stable and becomes a critical nucleus, and from this seed, the ice will start forming [22]. When choosing a temperature close to the melting point, the growth rate of ice becomes slower. The reason behind that is the rapid reduction in the translation motion of water, then, the ice-like crystal will be formed, and then the ice-like layer will melt. Recent studies attempted to enhance ice nucleation by using Nano-grooves. The work done by Zhang using a silicon substrate with a nano-groove indicated that the roughness of the hydrophobic substrate does not affect nucleation. The nucleation rate was found to be sensitive to the size of the groove, where ice can be formed inside the groove more than on a flat surface [23].
The effect of surface defects was also investigated to interpret its consequences on ice nucleation. Silver iodide (AgI) has captured the attention of these studies due to its ability in ice formation even at 270 K [24]. One of the critical results seen is the presence of both hexagonal and cubic ice structures on AgI [25]. Defects over silver iodide surface depicted that defects did not affect the ice nucleation. However, the surface area around the defects reduced the nucleation rate. This reduction is due to the perturbation of the hydration layer of the surface, which will lead to retarding the critical nucleus formation [26].
To describe the ice nucleation, there should be a bulk reference to compare the results with, especially when using water on a substrate, to know what effect the substrate has [27]. The work done by Qiu aimed to demonstrate whether ice can nucleate on the graphite surface or not [28]. The results described that the thermodynamic properties of water in the interface layer are similar to that of bulk; thus, nucleation can take place. The results of the bulk water system were also used to well-understand the upshot of graphene oxide confining walls on the phase transition temperature [21]. It was seen that the phase transition temperature was less with 34 K in the presence of confining walls compared to that of bulk water. Another approach to generalize the behaviour of hydrated water in the presence of proteins revealed that this water, depending on Radial Distribution Function (RDF) results, had the exact behaviour of bulk after 8 Å. Before 8 Å, the peaks were located at the same distance. However, those for hydrated water were sharper [29]. Hence, this study aims to analyze the effect of hydrophobic substrate on ice formation by comparing the results with bulk data at different temperatures.
Simulation details of the bulk system
In order to know the effect of the hydrophobic substrate on the ice formation, the bulk system was used as a reference system. The simulations were performed using LAMMPS [30] and TIP4P/ice model [31], which was designed to cope with the solid-phase transition. TIP4P/ice is considered a modified potential model of the TIP4P model. It is an attractive model due to its simplicity and accurate results without increasing the computational time. For this reason, it has become highly used in both equilibrium and non-equilibrium studies. Predictions of this model for both densities and coexistence curves of ice have been demonstrated to be better than those for other water models. It intends to give a significant investigation of hexagonal ice, cubic ice, and denser ice forms [31-34]. In this system, epsilons for oxygen and hydrogen atoms were 0.21084 and 0.0 Kcal/mol, respectively. The sigmas of the used atoms were 3.1668 Å and 0.0 Å, respectively. Partial charges (q) applied for oxygen and hydrogen were -1.1794 and 0.5897 e, respectively. All the interatomic interactions were modelled by the Lennard-Jones potential. The Nose-hoover thermostat and barostat were applied to fix the temperature and pressure. [35,36]. The simulations were carried out using periodic boundary conditions in the three directions. The number of hexagonal ice molecules was 1728, with 1500 water molecules set in a box structure. Simulations were performed at different temperatures with an isothermal-isobaric (NPT) ensemble and a pressure of 1 atm. The time step was 2 fs conducted for 20 ns.
Simulation details of system with ice and water over the silicon substrate
Silicon substrate consisting of 1584 atoms was applied. Using the same dimensions and number of atoms as the bulk system, a box of hexagonal ice and a box of water were set over the silicon substrate. The hexagonal ice box was added to accelerate the ice formation. The typical size of the simulation box was 84 × 42 × 28 Å3. The interaction between the water molecules and silicon was described by 8-10 Lennard-Jones potential, with σSi= 3.387 Kcal/mol and εSi=0.585Å. Periodic boundary conditions were applied in all directions. The velocity Verlet [37] algorithm was used to solve the equations of motions. Shake algorithm to fix the bonds was also applied. 10 Å cutoff was applied for all non-bonded interactions. Several NPT molecular dynamics simulations were carried out at four different temperatures. The CHARMM force field was utilized [38]. The temperature and pressure were stabilized using the Nose-Hoover thermostat and Nose-Hoover barostat. The temperatures used in this study were 100 K, 140 K, 180 K, and 220 K. The simulations were performed for 20 ns with a time step of 2 fs. Figure 1 represents the configuration of the studied systems.

Figure 1: Initial configuration of the system in the presence of silicon substrate the red, cyan, and blue colors represent oxygen, hydrogen, and silicon atoms, respectively. The initial configuration of the bulk system is the same but with the absence of the substrate.
The systems with silicon substrate will be denoted as Si-100, Si-140, Si-180, and Si-220 according to the used temperatures 100 K, 140 K, 180 K, and 220 K, respectively.
The Radial distribution function
The first peak in the bulk system was found at 2.74 Å, in good agreement with the experimental data [39,40]. By comparing the results between the different silicon systems first, we found that the peak of the oxygen-oxygen Radial Distribution Function (RDF) is the highest for both Si-100 and bulk system at 100K, in which the intensities of the first peak reached 7 and 6 respectively. The intensity of the peak decreased as the temperature increased. This decrease in the intensity is due to less water accumulation in the liquid state than in the solid-state. In other words, the correlation of ice molecules with the neighbouring is higher than the correlation of liquid. Figure 2 reveals that there is a peak strictly at 2.65 Å for O-O at all temperatures, which indicates the closest distance of the accumulation of water molecules relative to each other. For bulk systems, the intensities of the peaks were lower than that of silicon substrate systems.

Figure 2: g(r) O-O for both silicon and bulk systems at a.100 K, b.140 K, c.180 K, d.220 K. (Note:  Bulk)
Bulk)
Figure 3, which represents the O-H RDFs, shows that the four systems with silicon substrate are the same. The g(r) O-H exhibited a peak at 1.74 Å for the bulk systems, which correlates with the experimental data [39]. The O-H RDF cannot give comprehensive data about the structure of water, whether it is in the liquid or solid-state, since the peaks for bulk and systems with silicon substrate at the same temperature are almost the same, with a slight shift only in the second peak of bulk systems. Displaying the H-H RDF in Figure 4 shows that the second peak at 100 K is the highest compared to the peak at 140 K, 180 K, 220 K, and for bulk systems. This strong correlation between H-H can provoke the cluster structure. The second peak increased with the decrease in the temperature for the systems with silicon substrates. It can be established from g(r) Si-H that the high correlation occurs at 100 K while the least one is at 220 K, whereas at 140 K and 180 K, the correlation is approximately the same as expressed in Figure 5. The high correlation between Si and H inhibited the water molecules from moving apart from the silicon substrate, and thus, ice was formed directly over the silicon substrate.

Figure 3: g(r) O-H for silicon and bulk systems at a. 100 K, b. 140 K, c. 180 K, d. 220 K. (Note:  Bulk)
Bulk)

Figure 4: g(r) H-H for silicon and bulk systems at a. 100 K, b.140 K, c.180 K, d. 220 K. (Note:  Bulk)
Bulk)

Figure 5: Si-H RDF of systems with silicon substrate. Si-220)
The evolution of the curve at 220 K was remarkably different from the other curves. This remark can be used to classify two behaviours depending on the temperature scale: one from 100 K to 180 K and another above 180 K. The results reported in the previous study [34] interpreted that for bulk systems, as the temperature increases, the intensity of the first peak decreases and this is what can be noticed in the g(r) O-O for the bulk systems.
The radial distribution function for the water molecules of Si-100 was compared with g(r) O-O of liquid water to verify the state of the water in the presence of silicon at low temperature (hexagonal ice molecules were excluded from this calculation). The progress of the curves depicted in Figure 6 revealed a noticeable difference, and the proceeding of the water molecules of Si-100 showed an amorphous ice evolution. This result is validated by the experimental study performed by Yongchang Wu et al., in which they detected the presence of an amorphous ice layer on the hydrophobic surfaces [41]. The high correlation between silicon and hydrogen means that the water molecules are not getting apart from the substrate, and the ice layer is formed directly on the surface.

Figure 6: g(r) O-O for bulk at 273 K, water at 100 K, and hexagonal ice at 100 K. (Note: 
According to the study published in 2006 [42] explaining amorphous ice structure, the g(r) O-O of amorphous ice is well-matched with that of amorphous ice structure at low density (similar to this work). The first peak for the simulation study was seen at 2.6 Å with an intensity of 6.4, and the second peak was at 4.4 Å [43]. Oetjen stated that amorphous ice is stable from -160° to -125°C, and it needs a long time to change from amorphous into another type of ice [44]. The behaviour that was seen for Si-H at 220 K can be explained by the less stability of amorphous ice above 180 K. This finding gives more details about the two behaviours: one between 100 K and 180 K with stable amorphous ice, and the second above 180 K with unstable amorphous ice structure. In other words, low temperatures do not favour the formation of hexagonal ice. However, amorphous ice is formed first at low temperatures, and the clusters will be ordered. This ordering took a long time, and the stable critical crystal was completely formed after 1 µs [22].
Coordination number
By definition, the coordination number is established from the area under the first peak in g(r) O-O. The value obtained can give details about the presence of water or ice. When only water is present, this number increases with the increase in the temperature. In the case of hexagonal ice, it should not be above four [45]. The coordination number is also about four for Low-Density Amorphous ice (LDA: density below 1 g/cm3) [46]. The LDA was mentioned here because the calculated density of the system was below 1 g/cm3. Figure 7 merely exhibited the coordination number. As can be observed, the coordination number was lower for the bulk systems than when the silicon substrate was present. For the systems with the silicon substrate, the coordination number fluctuated around 3.8, while for bulk, it was around 3.7. At the lowest temperature in the presence of Si, the coordination number was the highest. This is due to the highest correlation for the first neighbours (see g(r) O-O). As the correlation decreases, the coordination number decreases. In other words, as the temperature decreases larger cluster of ice is formed. Dowell et al. demonstrated that at temperatures above -160°C, small ice clusters are found [47]. This result is in parallel with our result for having the highest coordination number at the lowest temperature (100 K).

Figure 7: Coordination number for silicon and bulk systems at different temperatures. (Note: 
The number of ice molecules
In order to understand how many ice molecules were formed, the algorithm developed by Clancy and Ba’ez was used [48]. The number of ice molecules was detected using the following equation:
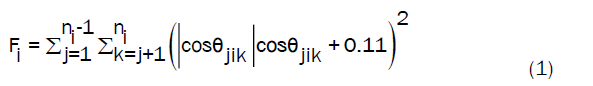
Fi is termed the tetrahedral parameter; i is the number of water molecules, ni is the number of water molecules in the first solvent shell, and ijk are the indices of the nearest neighbours. Ɵ is the angle between two oxygen atoms. Since the hexagonal ice structure is fourfold, cos Ɵ should be -0.33 to have the tetrahedral structure. As mentioned earlier, the number of hexagonal ice molecules at the beginning of the simulation was 1728 for all systems. It can be noted that as the distance from the substrate increases, the presence of ice decreases. The same phenomena were seen for bulk systems, as going through bulk layers, the number of ice formed decreases. The effect of the hydrophobic substrate can be seen where the Si substrate favoured ice formation near it. Lupi et al. concluded that hydrophobicity is not a good predictor of ice nucleation ability [15]. This prediction can be used to well-explain the ice formation on the silicon surface despite the hydrophobic property of this substrate. The bar diagram plotted in Figure 8 designated the total number of ice formed and the number of water molecules transformed into ice. The total number of ice is the summation of the hexagonal ice molecules and the water molecules transformed into ice. To obtain the number of water molecules transformed into ice, equation (1) was applied for the water molecules only, and the hexagonal ice molecules were excluded from this calculation. Concerning the effect of temperature, it can be stated that, as the temperature increases, the number of ice formed decreases. Figure S1 demonstrates the effect of the distance on the number of ice formed (see supporting information, Figure S2 shows the position of the z-axis). It is correlated with the result of RDF Si-H, where at 100 K, the system with silicon substrate clarified the high formation of ice at z<5 Å. Moreover, as the distance from the substrate increases, the number of ice molecules formed decreases dramatically.

Figure 8: Bar graph showing the total number of ice formed and the number of water molecules changed into ice. 
Survival probability and nucleation rate
Survival probability: Ice formation passes through two different phases: induction and growth [17]. In the induction phase, the critical nucleus is formed. At this phase, the ice melts and reforms until it become stable. In other words, the water molecules start to fluctuate between the ice and liquid phase. This fluctuation creates the subcritical nucleus. When the fluctuation stops, the subcritical nucleus develops to become a critical nucleus, which is a stable seed. From this seed, ice formation launches. After the formation of the critical nucleus, which is the crucial seed for starting the nucleation, the growth period starts. The critical nucleus develops into crystallite and causes the water in the liquid form to change into ice. According to Molinero et al., the induction phase takes 900 ns, where the subcritical nucleus was formed out of 20 water molecules. After the induction phase, the growth phase started at around 1000 ns until it ceased [22]. Figure S2 reveals the beginning of the growth phase for Si-100 (see supporting information). The ice nucleus started to form at the edge of the hexagonal ice cube near the water molecules. At this level, the survival probability is calculated to know the change in the identity, whether liquid or ice. The survival probability is defined [22]:
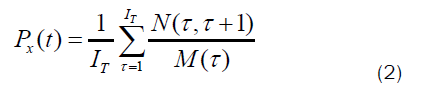
N (τ;τ+t) is the number of molecules that remain in phase x during the time interval between τ and τ+t. M(τ) is the number of molecules at the interval τ. IT is the number of intervals averaged over. Only water molecules were used to calculate the survival probability after determining the beginning of the growth phase. Figure 9 explains the survival probability of ice in the growth phase where τ used in this calculation was 10 ns. The probability of finding ice at the beginning of the growth phase was high for the systems in the presence of silicon. This probability reached 0.95 for Si-100, while for bulk systems, this probability reached 0.4 at 220 K. The survival probability decreased slightly for Si-100, Si-140, and Si-180. Whereas for Si-220, the descending was very sharp. Silicon substrate can help ice formation more than bulk at low temperatures, outreaching 180 K. As described before, the amorphous ice is stable at very low temperatures, yet at 220 K, this non-crystalline ice type is not stable. This instability is reflected in the curve decay for Si-220. Thus, the probability of finding ice in the growth phase for Si-220 was the lowest. Based on the calculated survival probability, the number of ice formed fluctuated, sometimes increasing and then decreasing, which can assure our discussion of melting and reforming ice during the growth phase until the stable ice nucleus is formed.

Figure 9: Survival probability for all the systems at different temperatures. (Note: 

Nucleation rate: To calculate the rate of ice formation, the hexagonal ice molecules were precluded, and only the 1500 water molecules were used. Figure 10 illustrates the rate of ice formation after determining the time of the launching of the growth phase. The Figure reflects that as the temperature decreases, the rate of nucleation increases. Sharp decrease was seen for Si-220 where the rate descended from 8.2 × 10²³m-3s-1 to 3.5 ×10²³m-3s-1. The time needed for the nucleation to start was 2 × 10⁻⁸ fs for Si-100, Si-140, and Si-180. At the same time, that for Si-220 was doubled, this demonstrates the different behaviour of ice formation above 180 K. This behaviour is similar to the decay realized in the survival probability, where the probability of finding ice at this temperature was the lowest among the rest of temperatures for systems with silicon substrate. It can be deduced that the survival probability is directly proportional to the rate of ice formation. As the number of ice found in the growth phase increases, the rate of ice formation becomes faster. A clear difference in the rate of nucleation between silicon systems and bulk systems was observed. For all the bulk systems, the time for nucleation was 1 × 10⁻⁷ fs. Thus, it can be demonstrated that the silicon substrate provokes nucleation phenomena.

Figure 10: Rate of ice formation at different temperatures.
Number density profile: It is clear that ice formation starts from the contact region between water and hexagonal ice molecules. Thus, ice formation is in progress along the x-axis. For this reason, three regions were used to well-understand this progress. The regions range between -5 Å and -50 Å, where the hexagonal ice molecules were excluded from this partition. The first region is -20< × <-5, the second -35< × <-20, and the third -50< × <-35 as Figures 11, 12, and 13 depict. Figure S2 displays the partition regions (see supporting information). At 100 K, the system showed cleaved peaks for both bulk and Si-100. The average intensity of the peaks is the same for both systems. The intensity of the peaks increased obviously in the region -35< × <-20, and the peaks became more compatible between bulk and Si-100. In the -50< × <-35 region, the intensity of the peaks decreased by distance for Si-100, but still, the cleaved structure for the ice structure found. The sharp peaks with high intensities can be recognized at -48 Å for the bulk system. This structure is referred to the periodic boundary conditions. The same pattern was seen for systems at 140 K and 180 K. The cleaved peaks continued to appear by getting apart from the hexagonal ice molecules. The effect of temperature can be concluded by comparing the intensity of the peaks in the -35< × <-20 and -50< × <-35 region, which decreased by distance. The results at 220 K expressed short intensity peaks with a noticeable difference between these results and that at different temperatures.

Figure 11: Number density profile at -20< × <-5 for the systems under study. (Note: 

Figure 12: Number density profile at -50< × <-35 for the systems under study. (Note: 

Figure 13: Preferred choice of higher learning institution.
Average hydrogen bond and hydrogen bond life time
In agreement with H-H RDF, it is clear that at 100 K, the average number of hydrogen bonds was the highest, then it decreased as the temperatures increased for the systems with silicon substrates. This result is similar to the work performed by Bleszynski et al. who showed that hydrogen bonds between the TiO2 surface and water were more than hydrogen bonds between ice and water [49]. The average hydrogen bond, expressed in Figure 14, descended sharper for the bulk systems with the temperature decrease than the systems with silicon substrates. Hence, it can be deduced that the presence of silicon favours more hydrogen bonds to be formed. The high correlation between silicon and hydrogen can explain the ice nucleation process. Besides, silicon substrate provoked the formation of more hydrogen bonds at low temperatures. Figure 15 represents the lifetime of all the systems. The lifetime for hydrogen bonds is also in agreement with the average hydrogen bond, which is high for systems with the highest average bonds (Si-100 and bulk 100). The stability of amorphous ice depends on the time the hydrogen bonds break down. The low value of the average hydrogen bond for Si-220 had the least lifetime and the most miniature number of water molecules transformed into ice. The fast breakage of the hydrogen bond at 220 K caused the instability of the amorphous ice structure, and so two behaviours were observed below and above 180 K.

Figure 14: The average hydrogen bonds for all the systems under study at different temperatures. 


Figure 15: Life time (Ps) for bulk systems and systems with silicon substrate at different temperatures. 

Mean square displacement
Mean Square Displacement (MSD) can give an idea about the melting behaviour of the solid form. It is known that when materials are in the liquid state, their mobility is higher than that of solid. The formation of clusters can inhibit the movement of the particles. Since MSD depends on the position the molecules move according to a reference point, this facilitates the ice formation or melting analysis. In the case where ice is melting, the curve will increase since the molecules are free to move in the medium, while in the case of ice formation, the curve will fluctuate around a constant value [50].
Figure 16 indicates the mean square displacement result of the bulk systems and the system with Si substrate at different temperatures. The curve at 100 K is the lowest and linear; then, as the temperature increases, MSD increases. The result of bulk at 220 K presented an increasing order curve, which is the only different behaviour that can be seen. Thus, the effect of the substrate at low temperatures can be assessed. Ice clusters were formed near silicon substrate, and the size of these clusters decreased with the increase in the temperature. As the size of the cluster increases, the movement decreases, this means low values of MSD. Besides, the silicon substrate prevents the movement of the molecules due to the interaction between silicon atoms and hydrogen atoms (explained in the Si-HRDF). Hence, at 220 K for the bulk system, the curve is sharply increasing than that of the Si- 220. Moreover, the difference between Si-180 and Si-220 curves was noticeable. This is because in the absence of the substrate, the molecules exhibit freedom to move as the temperature increases.

Figure 16: MSD curves for systems under study at different temperatures of A. Si, B. Bulk. (Note: 
From all the above results, it can be concluded that silicon accelerates ice formation by increasing the Si-H correlation. The high correlation between silicon and hydrogen means that the hydrophobic property of silicon does not repel the water. Water forms amorphous ice clusters on the hydrophobic silicon substrate at very low temperatures. The presence of silicon increased the rate of ice formation and the number of water molecules that transformed from the liquid state to the solid state as it increased the correlation between silicon and hydrogen compared to that of O-H. H-H RDF, coordination number, the number of ice, average hydrogen bond, and hydrogen bond lifetime signified decreasing values with the increase of temperature in the presence of silicon. It can be noticed that the silicon substrate favours hydrogen bonding as temperature decreases to provoke cluster formation. Another effect of temperature was indicated in the simulations executed. Two different behaviours were detected before 180 K and the other above this temperature. These two behaviours were related to the stability of amorphous ice, whereby amorphous ice became less stable at temperatures above 180 K. This stability depends on the correlation between silicon and hydrogen and the lifetime of the formed hydrogen bonds.
The author declares that any association did not fund the research.
The author declares no financial or non-financial competing interests concerning this manuscript.
Not applicable
Not applicable
[Crossref][Google scholar ][EBSCO]