The research project work the brain produces four main types of brain wave which are shown by EEG readings. Each type of brain wave produces the listed effects at specific frequencies. Although the brain is always emitting brainwaves at each different band it is the dominant brainwaves at a particular time that dictate the conscious state of an individual. By using technology to entrain the brainwaves to become dominant in a certain band we can thereby give an individual a powerful push into the desired conscious state. By doing this we can induce numerous mental and emotional states in an individual such as meditation, excitation, motivation, anxiety, irritation, sexual excitement, relaxation, spiritualism and more. We want to design an electromagnetic extremely low frequency sensor with the added element of EEG for controlling an extra parameter to sense the extremely low frequency waves. We plan on processing this extra parameter through hardware and through DSP base preamplifier and amplifier to find this frequency. There have been many variations on the ELF sensor but we are designing the electromagnetic elf sensor use of EEG to control the instrument, and we are hoping our idea will work well and be useful instead of a novelty in sensor technology with EEG ELF sensor in human neural network system
Keywords |
| EEG, Extremely Low frequency Sensor, Electromagnetic |
INTRODUCTION |
| The nervous system is our body's decision and communication centre. The central nervous system is made of the brain
and the spinal cord and the peripheral nervous system is made of nerves. Together they control every part of our daily
life, from breathing and blinking to helping you memorize facts for a test. Sensory nerves gather information from the
environment; send that info to the spinal cord, which then speed the message to the brain.Although the brain is always
emitting brainwaves at each different band it is the dominant brainwaves at a particular time that dictate the conscious
state of an individual. By using technology to entrain the brainwaves to become dominant in a certain band we can
thereby give an individual a powerful push into the desired conscious state. By doing this we can induce numerous
mental and emotional states in an individual such as meditation, excitation, motivation, anxiety, irritation, sexual
excitement, relaxation, spiritualism and more. The brain produces waves of currents that flow throughout its neural
pathways. The type of brainwave is defined by the frequency at which it is pulsing. The particular rate of pulsation
determines your state of mind. There are often several patterns interacting at one time [01].The brain is an
electrochemical organ; and speculations are that a fully functioning brain can generate as much as 10 watts of electrical
power. More conservative investigators calculated that if all 10 billion interconnected nerve cells discharged at one
time that a single electrode placed on the human scalp would record 5 millionths to 50 millionths of a volt. Electrical
activity emanating from the brain is displayed in brainwaves.When the brain is aroused and actively engaged in mental
activities, it generates beta waves. These beta waves are of relatively low amplitude, and are the fastest of the four
different brainwaves. Beta waves are characteristics of a strongly engaged mind or active conversation.Where beta
represented arousal, alpha represents non-arousal. Alpha brainwaves are slower and higher in amplitude. A person who
sits down to rest, reflect or meditate is often in an alpha state.Theta brainwaves are even greater amplitude and slower
frequency. A person who begins to daydream, who is driving on a freeway, and discovers that they can't recall the last
five miles, is often in a theta state.Delta brainwaves are of the greatest amplitude and slowest frequency. Deep
dreamless sleep is the lowest frequency. Humans dream in 90 minute cycles. When the delta brainwave frequencies increase into the frequency of theta brainwaves, active dreaming takes place. Rapid eye movement (REM) is
characteristic of active dreaming.Although one brainwave state may predominate at any given time, depending on
activity level, the remaining three brain states are present in the mix of brainwaves at all times. Knowledge of
brainwave states enhances ability to make use of specialized characteristics of those states. (being intensely focused,
relaxed, creative and in restful sleep.)Doctors doing electroencephalograph (EEG) work on clients with ADD find that
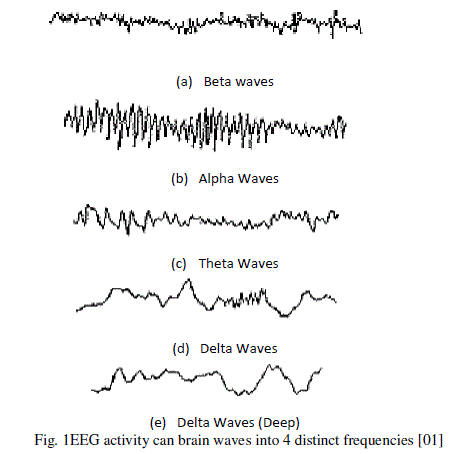
the person has a predominant theta brainwave pattern. People without ADD are normally in the beta range.In seen Fig.1
bellow types of brainwave even though this electrical power is very limited, it does occur in very specific ways that are
characteristic of the human brain [01].EEG activity can be broken down into 4 distinct frequency bands: Beta activity >
13 Hz , Alpha activity 8 Hz-13 Hz, Theta activity 4 Hz-7 Hz, Delta activity < 4 Hz |
 |
| There are 4 brainwave states that range from the high-amplitude, low-frequency delta to the low-amplitude, high
frequency beta. These brainwave states range from deep dreamless sleep to high arousal. The same 4 brainwave states
are common to the human species. Men, women, and children of all ages experience the same characteristic
brainwaves. They are consistent across cultures and country boundaries.Research has shown that although one
brainwave state may predominate at any given time depending on the activity level of the individual, the remaining 3
brain states are present in the mix of brainwaves at all times. In other words, while somebody is an aroused state and
exhibiting a beta brainwave pattern, that person's brain a component of alpha, theta, and delta even though these may be
present only at the trace level.It has been my personal experience that knowledge of brainwave states enhances a
person's ability to make use of the specialized characteristics of those states. These include being mentally productive
across a wide range of activities such as being intensely focused, relaxed, creative, and in restful sleep [01]. |
SYSTEM MODEL |
| Magnetic sensors have been in use for well over 200 years. Early applications were for direction finding, or navigation.
Today, magnetic sensors are still a primary means of navigation but many more uses have evolved.We designed an
electromagnetic extremely low frequency sensor with the added element of EEG for controlling an extra parameter to
sense the extremely low frequency waves. We plan on processing this extra parameter through hardware and through DSP base preamplifier and amplifier to find this frequency. There have been many variations on the ELF sensor but
we are designing the electromagnetic elf sensor use of EEG to control the instrument, and we are hoping our idea will
work well and be useful instead of a novelty in sensor technology with EEG ELF sensor in human neural network
system. There have been many variations on the ELF electromagnetic sensor but we are unaware of any that
incorporate the use of EEG to control the instrument, and we are hoping our idea will work well and be useful instead
of a novelty. This Bio sensor using in medical brain treatments in implant or modify brainwaves. This biosensor using
in ECG, MRI and extremely low frequency sense in different areas [01], [02]. [03]. |
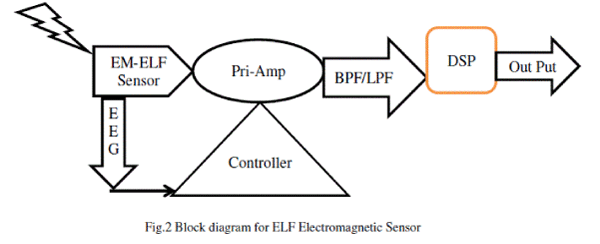
| This research project divided two parts, first is Design and develop Extremely Low Frequency sensor and second is
Developed EEG base amplifier for medical purpose. In Design Sensor using Electromagnetic loop antenna and Pre
amplifier and low pass filter and low pass frequency mixer and controller for sense this Low frequency signal for
amplifier in mansion bellow Fig.2 |
 |
ELECTROMAGNETIC SENSOR |
| When a conductor carrying a current is placed in a magnetic field, the voltage distribution within the conductor is
modified. The changes depend on the relative orientation of the current, the magnetic field and the measured changes
These effects have been classified into three groups [02]: |
| Hall Effect: the applied magnetic field is along the z-axis perpendicular to the current along the x-axis and the Hall
voltage is measured along the y-axis perpendicular to both the current and the magnetic field. |
| Longitudinal magneto resistive effect: the magnetic field is applied along the x axis, parallel to the applied current
also along the x-axis. The voltage change is measured along the x-axis. This is effectively a small change in
conventional resistance. |
| Transverse magneto resistive effect: the magnetic field is applied along the y-axis transverse to the current flow along
the x-axis and the voltage changes are measured along the x-axis. Again, this corresponds to a change in the
conventional resistance, but there are effects due tothe thickness or cross-section of the conductor.Air Electromagnetic
sensor coils are very stable and linear, but have limited sensitivity. Coils with a ferromagnetic core have higher
sensitivity, but are less stable and markedly nonlinear. In order to reach low demagnetization, they should be long and
thin. In the design of induction coils for high frequencies the coil self-capacitance should be considered. Induction
sensors are passive, and they should be distinguished from inductance. Basic applications of induction sensors are in
geophysics, where they measure micro pulsations of the Earth’s magnetic field (1 MHz-1 Hz frequency range), in audio
frequency applications, and in magnetic recording techniques. The measurement of secondary magnetic fields, caused
by the Earth’s currents after artificial excitations at frequencies up to the audio range, is called magneto telluric
exploration [02], [03]. Geophysical exploration may also use natural electromagnetic field variations in the 1 Hz to 20
kHz band. Induction coils are also used in plasma experiments, in space research, in submarines and trains; magnetic
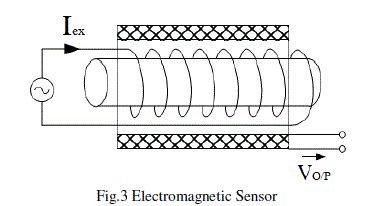
antennae are used for navigation and communication. Sensors, which are based on the change of the sensor inductance
and which need excitation in mansion bellow Fig.3 [03] |
 |
| Before we get too far into electromagnetism, we begin with a review of the properties of an inductor as used in
electronic circuits. An inductor is a passive circuit element that resists changes in current. The equation (1) governing |
its behaviour is:  (1) (1) |
| Where Lis the inductance in units of henrys as we can see from this equation, there is a voltage across the inductor
whenever the current changes. The minus sign indicates that the voltage (V) opposes the change in current (I) which is
to say that whenever an external circuit tries to cause more current to flow, it must provide a voltage in order to
overcome the voltage that arises in the inductor. Using this analogy, we can easily see how to build a large array of
inductance-measuring circuits, which are exactly like resistance-measuring circuits (dividers and bridges). In fact, the
most common approach to inductance measurement is a bridge. How big is a typical inductance? The inductance of a |
coil is given by equation (2):  (2) (2) |
| Assume we have a coil with a 1-cm diameter and a 1-cm length, with 1000 loops of wire in find value in equation (3).
Ifwe want to measure the effective resistance of this device, we will need to apply an oscillating voltage at some
frequency [04]. |
 (3) (3) |
| An interface or asignal conditioning circuit has a specific purpose: to bring signal from the sensor up to the format that
is compatible with the load device. Fig.4 shows a stimulus that acts on a sensor, which is connected to a load through
an interface circuit. To do its job effectively, an interface circuit must be a faithful slave of two masters: the sensor and
the load device. Its input characteristics must be matched to the output characteristics of the sensor and its output must
be interface able with the load [04]. |
 |
This paper, however, focuses on the sensors, therefore, below we will discuss only the front stages of the interface
circuits. Also, we will discuss some typical excitation circuits that are required for active sensors, that is, for the sensors
which need electrical signals to produce electrical outputs.The input part of an interface circuit may be specified
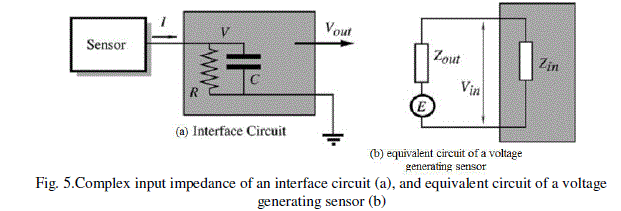
through several standard numbers. These numbers are useful for calculating seen value in equation (05) show
accurately the circuit canprocess the sensor’s output signal. Fig.5 shows an equivalent circuit for a voltage generating sensor. The circuit is comprised of the sensor output,Zout, and the circuit input,Zin, impedances.  (4) (4) |
| The output signal from the sensor is represented by a voltage source, which is connected in series with the output
impedance. Instead of a voltage source, for some sensors it is more convenient to represent the output signal as
outgoing from a current source, which would be connected in parallel with the sensor output impedance. Both
representations are equivalent to one another, so we will use voltage. Accounting for both impedances, the circuit input
voltage,Vin is represented asIn any particular case, an equivalent circuit of a sensor should be defined. This helps to
analyze the frequency response and the phase lag of the sensor-interface combination. For instance, a capacitive
detector may be modeled as a pure capacitance connected in parallel with the input impedance [04]. |
 |
To illustrate the importance of the input impedance characteristics, let us consider a purely resistive sensor connected to
the input impedance as shown in Fig.5. The circuit’s input voltage as function of frequency, f, can be expressed by a
formula where  is the corner frequency, (i.e., the frequency where the amplitude drops by 3 dB). If we
assume that1% accuracy in the amplitude detection is required, then we can calculate the maximum stimulus frequency
that can be processed by the circuit: is the corner frequency, (i.e., the frequency where the amplitude drops by 3 dB). If we
assume that1% accuracy in the amplitude detection is required, then we can calculate the maximum stimulus frequency
that can be processed by the circuit:  The inputbias current iois also internally generated by the circuit.
Its value is quite high for many bipolar transistors, much smaller for the JFET s, and even more lower for the CMOS
circuits. This current may present a serious problem when a circuit or sensor employs high-impedance components.
The bias current passes through the input impedance of the circuit and the output impedance of the sensor, resulting in
a spurious voltage drop. This voltage may be of a significant magnitude. For instance, if an Electromagnetic sensor is
connected to a circuit having an inputresistance of 1 GO(109O) and the input bias current of 1 nA (10-9A), the voltage
drop at the input becomes equal to 1 GO·1 nA¼1 V, a very high value indeed. In contrast to the offset voltage, the error
resulting from bias current is proportional to the output impedance of the sensor. That “battery” may take a long time to
lose its charge: from few seconds to many hours. The voltage generated by that “battery” is added to the sensor’s signal
and may cause significant errors. If an inductor must be employed at the input stage, a film capacitor should be used
instead of ceramic. The inputbias current iois also internally generated by the circuit.
Its value is quite high for many bipolar transistors, much smaller for the JFET s, and even more lower for the CMOS
circuits. This current may present a serious problem when a circuit or sensor employs high-impedance components.
The bias current passes through the input impedance of the circuit and the output impedance of the sensor, resulting in
a spurious voltage drop. This voltage may be of a significant magnitude. For instance, if an Electromagnetic sensor is
connected to a circuit having an inputresistance of 1 GO(109O) and the input bias current of 1 nA (10-9A), the voltage
drop at the input becomes equal to 1 GO·1 nA¼1 V, a very high value indeed. In contrast to the offset voltage, the error
resulting from bias current is proportional to the output impedance of the sensor. That “battery” may take a long time to
lose its charge: from few seconds to many hours. The voltage generated by that “battery” is added to the sensor’s signal
and may cause significant errors. If an inductor must be employed at the input stage, a film capacitor should be used
instead of ceramic. |
PRI-AMPLIFIER |
| Most passive sensors produce weak output signals. The magnitudes of these signals may be on the order of microvolts
(mV) or picoamperes (pA). On the other hand, standard electronic data processors, such as A/D converters, frequency
modulators, data recorders, etc. require input signals of sizable magnitudes on the order of volts (V) and milliamperes
(mA). Therefore, an amplification of the sensor output signals has to be made with a voltage gain up to 10,000 and a
current gain up to 1 million. Amplification is part of a signal conditioning. There are several standard configurations of
amplifiers that might be useful for the amplifying signals from various sensors. These amplifiers may be built of
discrete components, such as semiconductors, resistors, capacitors, and inductors. Alternatively, the amplifiers are
frequently composed of standard building blocks, such as operational amplifiers and various discrete components.It
should be clearly understood that a purpose of an amplifier is much broader than just increasing the signal magnitude.
An amplifier may be also an impedancematching device, an enhancer of a signal-to-noise ratio, a filter, and an isolator
between input and output. |
| Operational Amplifiers: One of the principle building blocks for the amplifiers is the so-called operational
amplifier(OPAM), which is either an integrated (monolithic) or hybrid (a combination of monolithic and discrete parts)
circuit. An integrated OPAM may contain hundreds of transistors, as well as resistors and capacitors. An analog circuit
designer, by arranging around the OPAM discrete components (resistors, capacitors, inductors, etc.), may create an
infinite number of useful circuits, not only the amplifiers, but many others circuits as well. Operational amplifiers are
also used as cells in custom-made integrated circuits of the analog or mixed technology types. These circuits are called
application-specific integrated circuits or ASICs for short. Below, we will describe some typical circuits with OPAM,
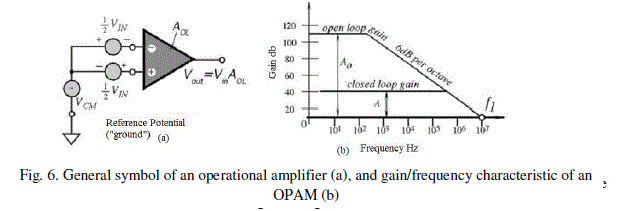
which are often used in conjunction with various sensors.As a building block, a good operational amplifier has the
following properties(The schematic representation of OPAM is shown in Fig.6): |
| Two inputs: one is inverting and the other is non-inverting; |
| A high input resistance (on the order of hundreds of MΩor even GΩ); |
| A low output resistance (a fraction of Ω); |
| An ability to drive capacitive loads; |
| A low input offset voltage mV (few mV or even mV); |
| A low input bias current (few pA or even less); |
| A very high open loop gain AOL(at least 104 and preferably over 106 That is, the OPAM must be able
to magnify (amplify) a voltage difference Vin, between its two inputs by a factor ofAOL; |
| A high common mode rejection ratio (CMRR). That is, the amplifier suppresses the in-phase equal
magnitude input signals (common-mode signals) VCM applied to its both inputs; |
| low intrinsic noise; |
| A broad operating frequency range; |
| A low sensitivity to variations in the power supply voltage; |
| A high environmental stability of its own characteristics. |
| For the detailed information and the application guidance the user should refer to data sheets and catalogues published
by the respective manufacturers. Such catalogues usually contain the selection guides for every important feature of an
OPAM. For instance, OPAMs are grouped by such criteria as low offset voltages,low bias currents, low noise,
bandwidth, etc. Fig.6. depicts an operational amplifier without any feedback components. Therefore, it operates under
the so-called open-loop conditions.The first stage of the ECG circuit include instrumentation amplifier it is the most
important part in the circuit it should provide high gain to amplify the weak of ECG or EEG signal and be able
immunity the noise (common mode signal ) and other signal in electromagnetic spectrum. |
 |
| Noise:Noise from the environment will easily swamp the tiny pulse signal from the heart. The leads connecting the
electrode to the amplifier will act like an antenna which will inadvertently receive unwanted radiated signals. Such
signals are for example the 50Hz from power lines and emf’s from fluorescent lights will add a tiny sinusoidal wave
which is generally quite difficult to filter away, but in our project we will not concern this type of noise (50Hz) since
our range of signal is from 0.5-5 Hz. Noise and interference signals acquired in this type of system are caused by the
electric installation. The signals from the heart are too small and it is necessary to amplify the signal and reduce the common-mode voltage on the system. Other aspects that generate noise are muscle contractions, respiration, and
electromagnetic emissions from electronic components. |
| Enhancements: To address the issues above, the following measure will be taken:(a)A high gain instrumentation
amplifier with a high Common Mode Rejection Ratiowill be used to receive the desired signal. (b)A band pass filter
will be implemented to remove the noise. Because most of the noise types discussed are of high frequency while the
desired signal is relatively low. (c) Peak detection circuit to detect the failure in electrodes connection. (d) Oscillator to
generate signal with frequency approximately 50 hz that pass through the instrumentation amplifier when the loss
connection occurred. (e) Analog to digital circuit to processing the signal using computer techniques. |
| EEG amplifier: The signal acquisition is the first consideration when an HRM is implemented. But the signal is too
small and contains a lot of added noise. As we said above the signal extracted from the heart has amplitude of
approximately 0.5mV.Since, it is necessary to amplify the signal and filter the noise, and then extract the QRS
complex.An instrumentation amplifier is usually the very first stage in an instrumentation system. This is because of
the very small voltages usually received from the probes need to be amplified significantly to be proceeding stages
[09]. Let us take some review about instrumentation amplifier: |
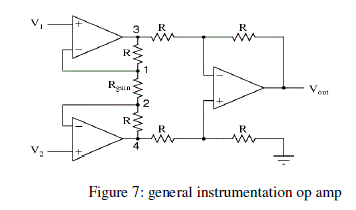 |
| This intimidating circuit is constructed from a buffered differential amplifier stage with three new resistors linking the
two buffer circuits together. Consider all resistors to be of equal value except for Rgain. The negative feedback of the
upper-left op-amp causes the voltage at point 1 (top of Rgain) to be equal to V1. Likewise, the voltage at point 2
(bottom of Rgain) is held to a value equal to V2. This establishes a voltage drop across Rgain equal to the voltage
difference between V1 and V2. That voltage drop causes a current through Rgain, and since the feedback loops of the
two input op-amps draw no current, that same amount of current through Rgain must be going through the two "R"
resistors above and below it. This produces a voltage drop between points 3 and 4 equal to [07]: |
 |
| The regular differential amplifier on the right-hand side of the circuit then takes this voltage drop between points 3 and
4, and amplifies it by a gain of 1 (assuming again that all "R" resistors are of equal value). Though this looks like a
cumbersome way to build a differential amplifier, it has the distinct advantages of possessing extremely high input
impedances on the V1 and V2 inputs (because they connect straight into the non-inverting inputs of their respective opamps),
and adjustable gain that can be set by a single resistor. Manipulating the above formula a bit, we have a general
expression for overall voltage gain in the instrumentation amplifier [09]: |
 |
| Gain Selection: The INA128 and INA129 are low power, general purpose instrumentation amplifiers offering excellent
accuracy. Their versatile 3-op amp design and small size make them ideal for a wide range of applications. Currentfeedback
input circuitry provides wide bandwidthEven at high gain (200 kHz at G = 100). A single external resistor
sets any gain from 1 to10, 000. INA128 provides an industry standard gainEquation; INA129’s gain equation is
compatible with the AD620. The INA128/INA129 is laser trimmed for very low offset voltage (50μV), drift
(0.5μV/0C) and high common- mode rejection (120dB at G >=100). It operates with power supplies as low as >2.25V,
and quiescentCurrent is only 700A ideal for battery operated systems. Internal input protection can withstand up to<40V without damage. The INA128/INA129 is available in 8-pin plastic DIP, and SO-8 surface-mount packages,
specified for the –400C to +850C temperature range. The INA128 is also available in dual configuration, the INA2128
[10]. |
FEATURES: |
| (a). LOW OFFSET VOLTAGE: 50V max, (b). LOW DRIFT: 0.5Vμ/0C max |
| (c). LOW INPUT BIAS CURRENT: 5nA max, (d). HIGH CMR: 120dB min |
| (e). INPUTS PROTECTED TO >40V, (f). WIDE SUPPLY RANGE: >2.25 to <18V |
| (g). LOW QUIESCENT CURRENT: 700μA, (h). 8-PIN PLASTIC DIP, SO-8 |
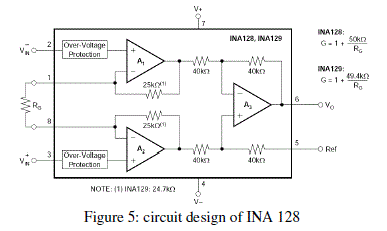 |
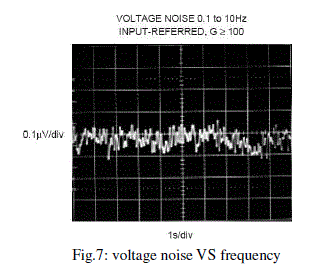
From our design we choose RG= 1kΩ since the gain we get 51 v/v actually the gain not very large for reason that
although the instrumentation amplifier has high common mode rejection ratio but the noise still effect to the output of
the circuit according to this equation:Noise signal =  volt /hertz 1/2
, so this signal that depends on the
frequency that will pass through instrumentation op amp [09], [10]. volt /hertz 1/2
, so this signal that depends on the
frequency that will pass through instrumentation op amp [09], [10]. |
 |
| filtering stage: The required band width for ECG or EEG signal (0.5 hz- 30 Hz) for normal heart human so we chose
the bandwidth of the circuit near to this range, now if we choose the bandwidth (0.5-120Hz) notching filter required in
design to remove 50hz noise from power line grid [10] , [11], [12] |
RESULT AND DISCUSSION |
| A steady state response can be generated at faster stimulus presentation or stimulus modulation rates of about 70-100 Hz.
Fast rate steady state evoked potentials (SSEP) were initially thought to result from superimposition of the slow wave of
the auditory brainstem response (the low frequency component of the ERS), which has a peak latency of about 10-12 msfor tonal stimuli. Recent evidence suggeststhat midbrain and cortical auditory pathways also contribute to the high rate
EEG ECG software on MATLAB Toolbox. EEG LAB Toolbox using in MALTAB are measured in the frequency
domain as a peak in the amplitude spectrum of the electrical activity recorded from the scalp corresponding to the
modulation rate of the stimulus and/or some measure of non-random phase behaviour of the response such as phase
coherence. A very different type of auditory evoked potential are the Auditory Steady-State Responses (ASSR), which
are responses to stimuli presented at rates such that the brain response to one stimulus is overlapped with responses to
other stimuli. Responses to slower modulation rates (<20 Hz) appear to originate largely in cortical structures;
responses to faster rates (70 Hz and higher) appear to reflect brainstem processes.ASSRs to rates >70-Hz show great
promise for rapid assessment of hearing infants. The multiple auditory steady-state evoked response (MASTER)
technique provides a rapid and objective assessment of hearing. The technique is based on the statistical evaluation of
the electrophysiological responses evoked by multiple auditory tones presented simultaneously. These auditory steadystate
responses can be recorded from the human scalp intermixed with the other activity in the electroencephalogram
(EEG).EEG LAB Toolbox generated by amplitude-modulated sinusoids can used to measure unaided and aided hearing
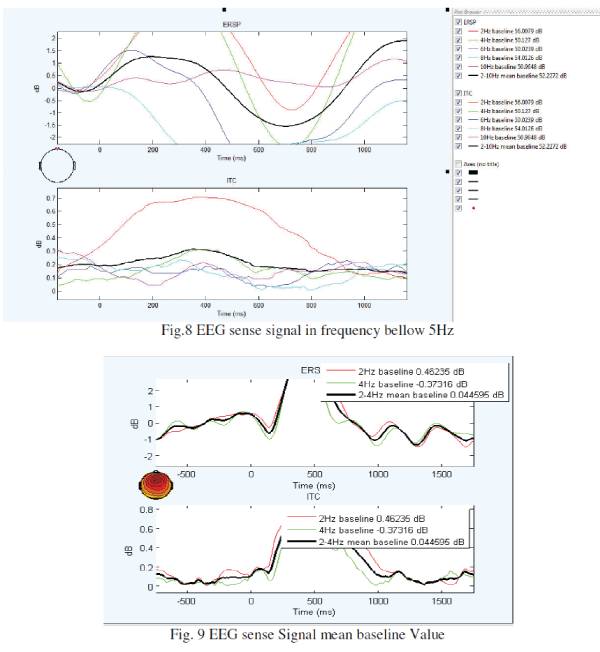
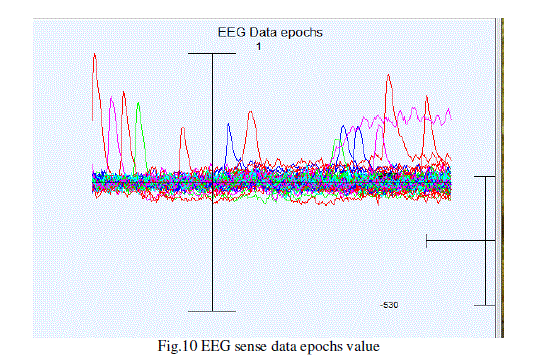
thresholds in hearing impaired children with reasonable accuracy result seen in Fig.8 and Fig 9 and Fig.10 |
 |
 |
CONCLUSION |
| This research paper is research area of extremely low frequency in electromagnetic sensor find different waves signal.
This signal is very important role of study about brainwaves. The brain is a complex and intricate organ serving yet
leading the rest of the body. Mapping the areas of the brain is the first step in understanding how humans think and
interact. Using sensor as non-invasive amplifier techniques is taking those first steps into the brain. Where there is great
achievement there is also a great responsibility. |
| |
References |
- Lubar, J. F.,âÃâ¬Ã EEG biofeedback and learning disabilitiesâÃâ¬ÃÂ, Research Articles Theory into Practice, 24(2), 106-111,2003
- Park YE, Wise KD,âÃâ¬ÃÂAn MOS switched-capacitor readout amplifier for capacitive pressure sensorsâÃâ¬ÃÂ, .IEEE Custom IC Conf380âÃâ¬Ãâ384K,1983.
- Pease R.A,âÃâ¬ÃÅImprove circuit performance with a 1-op-amp current pumpâÃâ¬ÃÂ,EDN, 85âÃâ¬Ãâ90, Jan. 201983
- J. Fraden,âÃâ¬ÃÂHandbook of Modern SensorsâÃâ¬ÃÂ, Ch-5,SpringerScienceÃÆþBusiness Media, LLC,DOI 10.1007/978-1-4419-6466-3,pp..249-315, 2010
- Williams J ,âÃâ¬ÃÂSome techniques for direct digitization of transducer outputsâÃâ¬ÃÂ, AN7,LinearTechnology Application Handbook,1990
- PavelRipka, AloisTipeâÃâ¬ÃÅModern sensorsâÃâ¬Ã handbook/edited Great Britain and the United States in by ISTE Ltd,2007
- SCHOTT, C., BLANCHARD, H., POPOVIC,R.S., RACZ, R., HREJSA, J.: âÃâ¬ÃÅHigh accuracy analog Hall probeâÃâ¬ÃÂ, IEEE-Transactions onInstrumentation and Measurement, Vol. 46, no.2, pp. 613âÃâ¬Ãâ616, 1997.
- Pre-processing EEG for Direct Human-System Interface, a paper selected for presentation at IEEE Conference on Intelligence in Neural andBiological Systems at Washington,USA on Nov. 4, 1996
- Jone Wilson, âÃâ¬ÃÅSensor Technology HandbookâÃâ¬ÃÂElsevier British Library Cataloguing-in-Publication DataA catalogue record for this book isavailable from the British Library. ISBN: 0-7506-7729-5, 2005
- JOGN G.WEBSTER ,"Medical Instrumentation, Application And Design" Hand book in ch- 2,pp.45-107,2001 .
- Jessica ambourn,"Portable ECG Logger", pp.07-28, October 2003.
- J. C. Chiou, Li-Wei Ko, Chin-Teng Lin, Chao-Ting Hong, Tzyy-Ping Jung, âÃâ¬ÃÅUsing Novel MEMS EEG Sensors in Detecting DrowsinessApplication,âÃâ¬Ã IEEE Biomedical Circuits and Systems Conference, 2006
|