ISSN ONLINE(2319-8753)PRINT(2347-6710)
ISSN ONLINE(2319-8753)PRINT(2347-6710)
A.Brinda1, N.Balaganesh2 and M.S.Bhuvaneswari2
|
| Related article at Pubmed, Scholar Google |
Visit for more related articles at International Journal of Innovative Research in Science, Engineering and Technology
Recent surveys say that users prefer secure services to affordable services. The systems that are connected to a network are highly vulnerable and the resources are under a chance of exploitation. The attackers are attracted towards such vulnerabilities which provoke them to deploy their attacks more effectively causing a denial of service. This leads to the loss of information and rise of many zombie machines. If one system is compromised and becomes a zombie, the dependent systems are more prone to similar attacks. Moreover, as the users share computing resources through the same switch and file systems, there is also a chance of insiders turning into attackers to obtain information about opponents. The attackers can launch several attacks such as buffer overflow and remote code execution to gain the root access privilege. Hence, the detection of such zombie exploitation attacks is extremely difficult. In this paper, a vulnerability detection mechanism is proposed. It is built on attack graph-based models. The major components are a network intrusion detection agent and an attack graph generator. It comprises of two phases: Identification phase and Graph generation phase. It performs attack detection and identifies the corresponding vulnerability that has been exploited by means of an attack graph.
Keywords |
| Security, Intrusion detection system, vulnerability, attack graph |
INTRODUCTION |
| Security has one major purpose: to protect assets. Traditionally, this meant building strongwalls to stop the opponent and establishing small, well-guarded doors to provide secure access foracquaintances. This formula worked well for the centralized mainframe computers and closed networks. With the increased number of LANs and personal computers, the Internet began to create infinitenumbers of security risks. Firewall devices, which come under either software or hardware that stress onan access control policy between two or more networks, came into picture. This technology gavebusinesses a solution so that it can balance between security and simple outbound access to the Internet, which wasmostly used for mail and internet surfing. Most people expect security measures to serve the following:Users can perform only authorized tasks. Users can obtain only authorized information. Users cannot cause damage to the data, applications, or operating environment of a system.The word securitymeans protection against malicious attack by opponents. Statistically, there are more attacks from inside sources. Security also includes reducing theimpacts of errors and equipment failures. Anything that can protect against a malicious behavior will probably prevent further damages, too. The top security threat is the exploitation of vulnerabilities and system resources to generate attacks. [1]. |
| In [2], Vinay et al. addressed taxonomies of attacks and vulnerabilities which say that security assessment of a system is a difficult problem. Most of the current effortsin security assessment involve searching for known vulnerabilities. Finding unknownvulnerabilities still largely remains a subjective process. The process can be improvedby understanding the characteristics and nature of known vulnerabilities. The knowledge thus gained can be organized into a suitable taxonomy, which can then be usedas a framework for systematically examining new systems for similar but as yet unknown vulnerabilities. |
| In [3], Ju yung et al. reviews the different countermeasure schemes and solutions that can address therisksoffered by the threats and attacks relatedtoWSNs have been identified and discussed. Although these threats cannot be totally eliminated, a desired level of security can be achieved by adopting suchcountermeasure. The goal isto assist managers in making decisions by providingthemwithabasicunderstanding of the nature of the various threats associated with wireless networking and available countermeasures. |
| The difficulty in managing security threats and vulnerabilities for small and medium-sizedenterprises (SME) are investigated in [4]. A detailed conceptual framework for asset andthreat classifications is proposed. This framework aims to assist SMEs to prevent and effectively mitigate threats and vulnerabilities in assets. The framework models security issues in terms of owner, vulnerabilities, threat agents, threats, countermeasures, risksand assets,and their relationship; while the asset classification is a value-based approach, and threat classification is based on attack timeline. |
| To effectively detect and analyze the attacks and exploitation, a vulnerability detection mechanism is proposedthat detects and identifies the corresponding vulnerability that has been exploited. |
RELATED WORK |
| In this section, papers related to areas such as zombie detection and prevention, and attack graph construction are discussed. The work by Duan et al. [5] signifies the detection of compromised machines that have been made as spam zombies. The method, SPOT, is based on sequentially scanning outgoing messages while employing a statistical method Sequential Probability Ratio Test (SPRT), to quickly determine whether a system is under the control of an attacker or not. BotHunter [6] detects machines under the control of the opponent based on the idea that a thorough malware infection process has steps that allow correlating the intrusion alarms triggered by incoming traffic with resulting outgoing traffic patterns. BotSniffer [7] uses consistent spatial-temporal behavior featuresof attacker controlled machines to detect zombies by clustering flow patterns according to server connections and detecting the same pattern in the flow. |
| An attack graph can represent a sequence of attacks that lead to a state, where an opponent has obtained rootaccess to a machine. There are many tools to construct attack graph. Sheyner et al. proposed atechnique based on a modified symbolic model checking NuSMV [8] and Binary Decision Diagrams (BDDs) toconstruct attack graph. Their model can produce allpossible attack paths; however, the scalability is a drawback. P.Amman et al. [9] came up with theassumption of monotonicity, which states that the preconditionof a given exploit is never invalidated by thesuccessful application of another exploit. Hence,attackers do not have the need to go back again in their attack path. |
| Using this fact,they can obtain a precise, scalable graph format forencoding the attack tree. Ou et al. [10] introduced an attack graphtool called MulVAL, which makes use of a logic programmingapproach and Data log language to model and analyzenetwork system. The attack graph in the MulVAL isgenerated by collecting the real facts of thenetwork system under inspection. The process of constructing attack graph will finish off efficiently because the number of facts ispolynomial in system. MulValâÃâ¬ÃŸs attack graph structure can be further extended and modified. |
SYSTEM MODELS |
| In this section, the method of how to model attack graphs that are used to model security threats and vulnerabilities is described. |
| A. Threat model: |
| The opponentâÃâ¬ÃŸs main aim is to utilize vulnerable virtual machines and make them as zombies. Traffic on the network is taken as the major source of input for detection of threats.This work does not include host-based IDS and does not take the issue of how to handle encrypted traffic for attack detections. |
| B. Attack Graph model: |
| An attack graph is a representation that can illustrate all possibleattack paths that are extremely difficult tounderstandand then to decide on the appropriate remedial steps. In an attack graph, each node signifieseither precondition or consequence of an exploit. Theactions need not necessarily be an active attack because normalprotocol operations can be mistaken for attacks. Attackgraph is employed for identifying potential threats, relevantattacks, and known vulnerabilities in a virtual networking system.As the attack graph gives details of all knownvulnerabilities in the system and the topology information the possibleattacks can be predictedby correlating detected events or activities. If a behavior is identified as a potential attack, specific measurescan be implementedto reduce its effect or takeactions to prevent it from damaging the system. |
SYSTEM DESIGN |
| The system consists of servers which contains a number of virtual machines in it. Each server consists of an intrusion detection agent that monitors the traffic in and out of the virtual machines or among the servers itself. The Agent is a light weighted network intrusion detection agent (NIDS) installed in each server. The Agent, an intrusion detection engine is used to capture and filter malicious traffic. The alerts generated by the agent are forwarded to the attack graph generator when suspicious or anomalous traffic is captured. These alerts are handled by the attack graph generator. |
| The attack graph generator observes the severity of the alerts by referring to an attack graph designed for the particular network. This attack graph is established based on vulnerability information got from vulnerability scans and penetration scans run on the network. The attack |
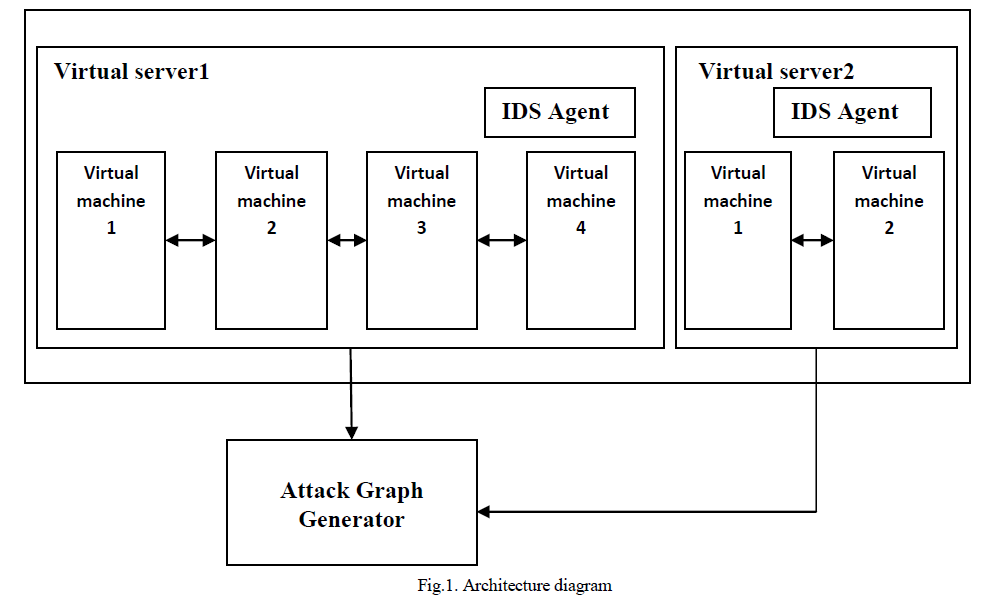 |
| graph generator then selects a countermeasure from a countermeasure pool based on cost benefit analysis of the effectiveness of countermeasures. The system can be further enhanced by implementing selected countermeasure actions. The attack graph generator plays a major role in the construction of attack graph and in the identification of attackers. |
| The architecture diagram of the system is shown in the Figure1. |
| A. Identification Phase: |
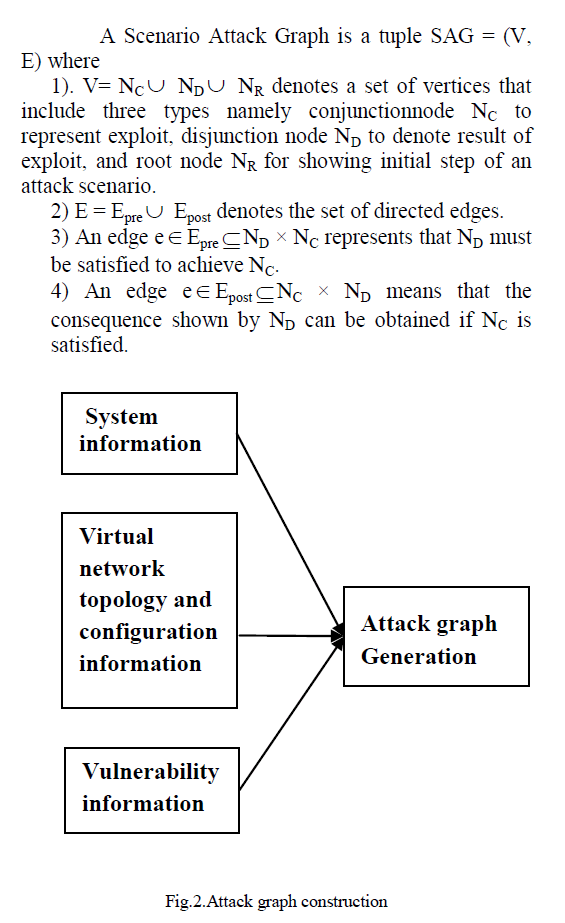
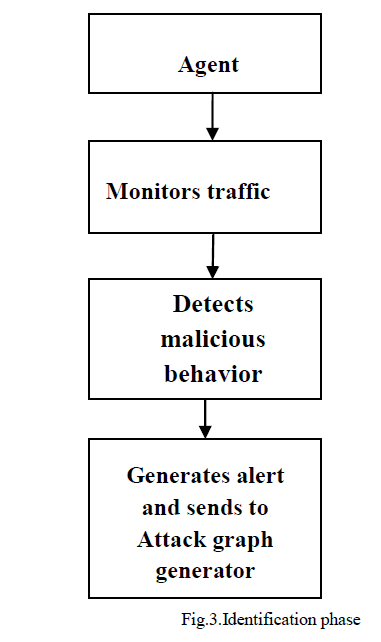
| In the identification phase, the agent located in each server scans the traffic among the virtual machines and in and out the servers. The agent sniffs a mirroring port on each virtual bridge. Each bridge forms an isolated subnet. The traffic generated is mirrored to a specific port on a specific bridge. An attack graph for the network is constructed using information such as system information, virtual network topology and configuration information, and vulnerability information as shown in Figure 2. If any malicious traffic is detected, then the IDS generates an alert which is handled by the attack graph generator as shown in Figure3. |
| B.Graph Generation Phase: |
| An attack graph is a modeling tool to illustrate multistage, multihost attacks. It helps to understand threats in a system. In an attack graph, each node represents either precondition or post condition of an exploit. It is helpful in identifying potential threats, possible attack and known vulnerabilities in a system. The attack graph provides details of all known vulnerabilities and connectivity information of the system. If an event is identified as a potential attack, specific countermeasures can be applied to mitigate its impact from damaging the virtual system. |
 |
 |
IMPLEMENTATION |
| In the alert generation phase, the network traffic is monitored by a software agent called NICE-A. This agent scans the traffic generated by the virtual machines. If any malicious or anomalous traffic is detected then the agent generates an alert. Based on the severity of the alert, the suspicious virtual machines are put in inspection or quarantine modes. Each alert consists of parameters such as source IP address, destination IP address, and type of the alert and timestamp of the alert. This alert is handled by the attack graph generator and based on the attack graph constructed for the particular network. |
| The attack graph is constructed based on information such as cloud system information, virtual network topology, configuration information, and vulnerability information got from various components of the system. Once new vulnerabilities are discovered and countermeasures are deployed the attack graph is reconstructed. The process of constructing and utilizing the attack graph consists of three phases. |
| 1. Information gathering |
| 2. Attack graph construction |
| 3. Potential exploit path analysis |
| A. Information gathering |
| The information is gathered from various sources such as virtual machine controller and scanners. The information gathered from them includes information such as number of virtual machines in the server, running services on each virtual machine and virtual machineâÃâ¬ÃŸs virtual interface information. Thetopology and network configuration information provides information like virtual network topology, host connectivity, virtual machine connectivity, virtual machineâÃâ¬ÃŸs IP address, MAC address, port information and traffic flow information. The vulnerability information is gathered by running ondemand vulnerability scans and regular penetration tests using the vulnerability databases such as Open Source Vulnerability Database (OSDVB), Common Vulnerabilities and Exposures List (CVE) and NIST National Vulnerability Database(NVD). |
| B. Graph Generation |
| The attack graph is constructed using the above mentioned information such assystem information, virtual network topology, configuration information and the network vulnerability information. Each node in the attack graph represents vulnerability or an exploit by the attacker. |
| C. Potential Exploit path analysis |
| The attack graph provides information about the possible paths that an attacker can follow. A path from the initial node to the target node represents a successful attack. Thus analyzing the attack graph gives the current security status of the network, for which the attack graph model has been constructed. The attack graph helps in predicting the attackerâÃâ¬ÃŸs behavior. When each of thevulnerability is exploited, alerts are generated. The severity of the alert provides information about the efficiency of the attacker. This helps in selecting a suitable countermeasure for the attack. |
RESULTS AND DISCUSSIONS |
| The Wireshark packet capturing tool is used to capture the network traffic. The tool captures all the live packets in the connected network through the specified interface. The interfaces may be specified as either Local area Connection or Wireless Network connection. The tool automatically lists the available interfaces in the system. Using the specific interface, packets are captured. The captured packets are listed in the packet window. |
| The captured packets are displayed in the Packet window with specific color formats as required. These formats can be set by the user. This feature is called „packet colorizationâÃâ¬ÃŸ.Then this packet information is saved in plain text file. |
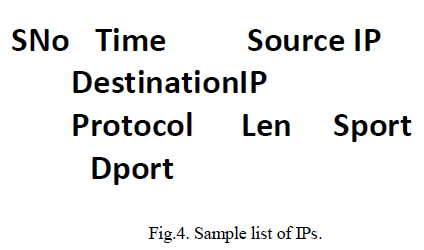
| This plain text file contains information about the packet such as Packet number (serial number), source IP address, Destination IP address, protocol used by the packet, length of the packet, source port number and the destination number. This packet information is extracted and displayed in the format.Considering this captured packetsâÃâ¬ÃŸ information as the input dataset as shown in Figure 4, certain conditions are checked. The conditions ensure that no vulnerabilities are exploited in the network. Two types of simple vulnerabilities have been demonstrated. One is port number vulnerability and the other one is based on the number of requests to a particular system. |
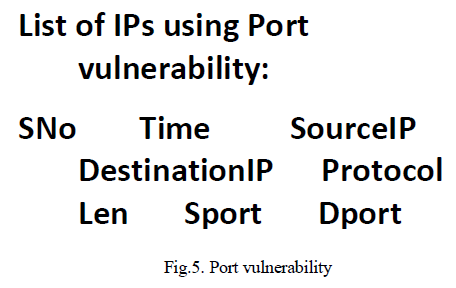
| To demonstrate this, distinct IPs from the destination IPs list is taken. Then the destination IP which is suspected to be attacked is entered. The restricted ports of the suspected IP are displayed. The source IPs that send requests to the restricted ports of the destination IP are considered to exploit the port vulnerability as shown in Figure 5. The list of IPs that sends packets to the destination IP is taken. If it is above a particular threshold value it is taken as an attacker IP. The threshold value taken is „nâÃâ¬ÃŸ and if the number of requests exceeds „nâÃâ¬ÃŸ, then the source IP is considered to perform denial of service attack. |
 |
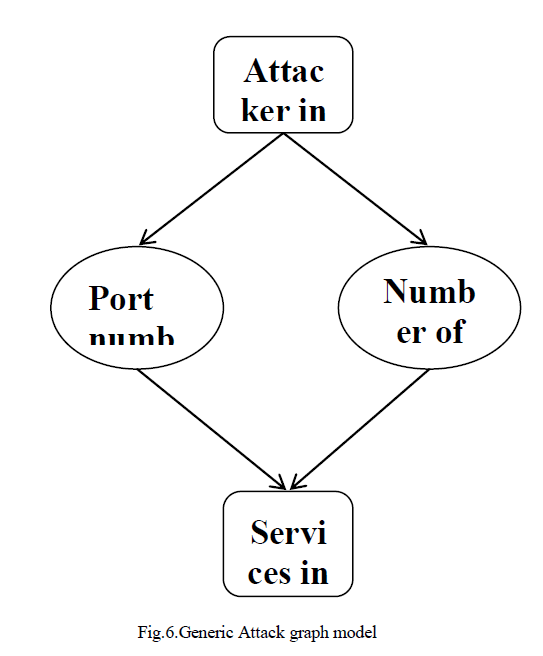
| The attack graph construction phase is demonstrated with a depth level of two. The source node or the root node of the graph is taken as the location of the attacker. Two types of vulnerability are shown namely the port vulnerability and the requests vulnerability. The target node is the node which is suspected to be attacked. |
| The attack graph is a labeled graph with directed edges. If any of the vulnerabilities are exploited, a directed edge from the source to the destination IP is constructed, confirming a successful attack. Some of the other types of vulnerabilities are buffer overflow, remote code execution, login without authentication, predictable random variable etc,. The generic model of the attack graph is shown in Figure 6. |
 |
 |
 |
CONCLUSION |
| In this paper, a vulnerability detection mechanism is proposed which is built on attack graph based analytical models and virtual network based countermeasures. It detects and mitigates collaborative attacks in the virtual environment. Attack graph model is used to conduct attack detection and prediction. Thus the proposed solution can greatly reduce the risk of the virtual network system from being exploited by internal and external attackers. This project illustrates only the network based IDS approach to counter zombie explorative attacks. |
FUTURE ENHANCEMENT |
| This project can be further enhanced by incorporating host based IDS solutions to improve the detection accuracy and to counter attacks. |
ACKNOWLEDGMENT |
| The authors wish to express their heartfelt thanks and gratitude to the Department of Computer Science and Engineering of Mepco Schlenk Engineering College, Sivakasi for providing good support and encouragement for this work.The authors also thank their principal and managementfor providing the necessary facilities to carry out this work. |
References |
|