ISSN ONLINE(2278-8875) PRINT (2320-3765)
ISSN ONLINE(2278-8875) PRINT (2320-3765)
Dr.K.Ravichandrudu1, Jhansi Rani2 and YN.Vijay Kumar3
|
| Related article at Pubmed, Scholar Google |
Visit for more related articles at International Journal of Advanced Research in Electrical, Electronics and Instrumentation Engineering
Ensuring the safety and performance of small scale wiind turbine using DAQ for the conversion of wind turbine energy is monitored and vibration analysis to calculate the life time of the wind turbine. A Data Acquisition System composed of a mocro controller and a series of resistors are used to measure the current and voltage and calculate the corresponding power and wind turbine.Using serial port,data are sent to personal computer(PC). The data transferred to the PC are recorded to a text file using a proposed-designed program for this system.Wind power system is one type of renewable energy and small wind power system is widely used in home-used system.Small wind power system can be constructed with materials which can be easily got with in local market.This paper provided a cost effective solution to avoid the malfunctioning of the system in worst case conditions.Better performance can be achieved by taking all other effective parameters such as pressure , humidity etc in to consideration.A modified Cost Effective Data Acquisition and integration system along with direct digital storage replaces the conventional radio tape storage techniques in use.Wind power generation and distribution along with the support from electric grid/board is expected to provide a greater employment opportunity to a considerable mass.
Keywords |
| LabView, DAQ, Wind Turbine, current sensor |
INTRODUCTION |
| Wind is one of the renewable natural air movements available in our environment. Wind has a lot of advantages with a few disadvantages and it does not harm water and soil and does not cause air pollution. Wind can be captured and consumed as a form of energy. The energy captured from the wind can be converted into other forms of energy. The mechanical energy of the wind turbine can be used directly, like in grain grinding or water pumping. On the other hand, energy produced by windmill can be converted in to electricity through a generator connected to the turbine shaft. Wind turbines are essential for generating electricity from wind. Wind turbine is very sensitive to wind. Even small differences or variations in speed cause a considerable difference in the energy output. Hence, Monitoring of parameters is necessary in order to examine the efficiency of wind turbine. As the uncertainties in the atmosphere are quite natural , it is also important to control the parameters in case of worse conditions. |
A: WIND POWER RESOURCE ASSESSMENT |
| Presently, India has an installed power generation capacity of a little over 207.8 GW, of which renewable account for about 25 GW, and wind makes up a majority of this installed capacity. In 2011 the state-run Centre for Wind Energy Technology reassessed India’s wind power potential as 102,778 MW at 80 metres height at 2% land availability6, up from the earlier estimate of approximate 49,130 MW at 50 metres, also at 2% land availability. If the estimated potential of 102 GW were fully developed, wind would provide only about 8 percent of the projected electricity demand in 2022 and 5 percent in 2032 [LBNL 2012]. |
| These research studies need ground level validation through long-term wind measurements at 80 and 120-meter hub height. Nevertheless their findings may have a significant impact on India’s renewable energy strategy as it attempts to cope with a substantial and chronic shortage of electricity. In a positive development the Ministry of New and Renewable Energy (MNRE), has now signed a Memorandum of Understanding with the Lawrence Berkeley Lab to collaborate on several issues related to the estimation of wind resource potential and grid integration. |
WIND TURBINE SITE SELECTION |
A: METMAST FOR WIND RESOURCES AND CONSTRUCTION |
| A Wind Turbine without Wind is like a Dam without Water. To identify the windy sites by collecting wind data, direction and other parameters, to design the wind farm layout and Micro siting, to achieve optimal generation, to estimate the expected generation from the project metmast is important. |
| A Metmast is a temporary structure installed for a period of 2 years and may be removed after study. A series of identical conventional and reliable cup anemometers has been arranged on booms. The anemometers measure the windspeed at eight different height levels. The lowest level is at 18m, the highest level is at 95m. Registration of the wind direction is implemented by means of conventional wind vanes. |
 |
| The met mast is constructed from T6 tempered aluminum mast tubes, chosen for their weight, allowing the diameter to be kept to a minimum. The small diameter minimizes wind and ice loading, which in turn reduces the required holding strength of the ground anchors. |
| The met mast tubes are coupled together using precision machined internal pins which increases the allowable buckling load. The base plate is laser cut and folded from galvanized steel plate. |
| The guy connection points (spiders) are laser cut and formed under numerical control from stainless steel plate. We supply the complete 12 m mast, including packing, instrumentation, ground anchors and manual drive rod. A mast-only kit without instrumentation is available. Alternative specifications and installer kits are available on request. |
B: HOW WIND TURBINE WORKS |
 |
| Wind is a form of solar energy. Winds are caused by the uneven heating of the atmosphere by the sun, the irregularities of the earth’s surface, and rotation of the earth. Wind flow patterns are modified by the earth’s terrain, bodies of water, and vegetation. Humans use this wind flow, or motion energy, for many purposes: sailing, flying a kite, and even generating electricity. |
| The terms wind energy or wind power describes the process by which the wind is used to generate mechanical power or electricity. Wind turbines convert the kinetic energy in the wind into mechanical power. This mechanical power can be used for specific tasks (such as grinding grain or pumping water) or a generator can convert this mechanical power into electricity. So how do wind turbines make electricity? Simply stated, a wind turbine works the opposite of a fan. Instead of using electricity to make wind, like a fan, wind turbines use wind to make electricity. The wind turns the blades, which spin a shaft, which connects to a generator and makes electricity. |
C: CONTROLSYSTEM |
| This is the tirumala wind power plant control system and the control panel. |
 |
| Controller has two independent computers. The master computer is located in the switch board in the bottom of the tower and a slave is located in the nacelle. It has 24 bit digital signal processor and Micro controller based programming is used. |
INTRODUCTION TO LABVIEW |
| In LabVIEW, you build a user interface by using a set of tools and objects. The user interface is known as the front panel. You then add code using graphical representations of functions to control the front panel objects. This graphical source code is also known as G code or block diagram code.The block diagram contains this code. In some ways, the block diagramresembles a flowchart. You can purchase several add-on software toolkits for developing specialized applications. All the toolkits integrate seamlessly in LabVIEW. Refer to the National Instruments Web site at ni.com\toolkits for more information about these toolkits. |
A: BLOCK DIAGRAM |
| After you build the front panel, you add code using graphical representations of functions to control the front panel objects. The block diagram contains this graphical source code, also known as G code or block diagram code. Front panel objects appear as terminals on the block diagram. |
| The following VI contains several primary block diagram objects—terminals, functions, and wires. |
 |
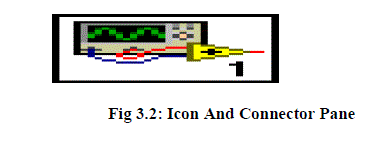
B: ICON AND CONNECTOR PANE |
| After you build a VI front panel and block diagram, build the icon and the connector pane so you can use the VI as a subVI. The icon and connector pane correspond to the function prototype in text-based programming languages. Every VI displays an icon, such as the one shown as follows, in the upper right corner of the front panel and block diagram windows. |
 |
C: RUNNING AND DEBUGGING VIs |
| To run a VI, you must wire all the subVIs, functions, and structures with the correct data types for the terminals. Sometimes a VI produces data or runs in a way you do not expect. You can use LabVIEW to identify problems with block diagram organization or with the data passing through the block diagram. |
D: RUNNING VIs |
| Running a VI executes the operation for which you designed the VI. You can run a VI if the Run button on the toolbar appears as a solid white arrow, shown as follows. |
   |
| A VI runs when you click the Run or Run Continuously buttons or the single-stepping buttons on the block diagram toolbar. While the VI runs, the Run button changes to a darkened arrow, shown as follows, to indicate that the VI is running. |
WIND TURBINE MONITORING PROGRAM |
A: DATA ACQUISITION BOARD |
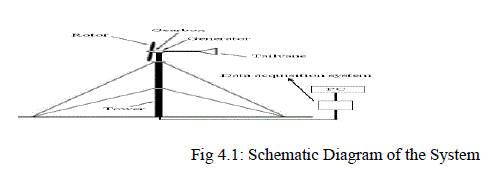
| This system is made up four main parts:, personal computer, data acquisition system and connecting cables. Figure shows the schematic diagram of our system. Power output is connected to an electronic apparatus which measures the power produced. The measured power is converted to data language and data about power will be recorded by using a PC. |
 |
| Data acquisition board is the measurement apparatus used in this project specially designed and programmed for our investigation; it can measure from 0 to 10 voltages with very high accuracy up to ±10−5. Input of this electronic board is power output of the Rutland WG913 wind turbine and outputs are data about voltage, current, power and wind speed. This board is made of one micro controller, voltage adopter, resistors and one LCD. The micro controller is an interface between turbine and computer; the voltage coming from the turbine is decreased by resistors and measured by controller; at the same time current, power and wind speed is calculated by this device. The instantaneous current and voltage will be displayed on the LCD and the same data will be sent to a PC before passing the voltage adopter. |
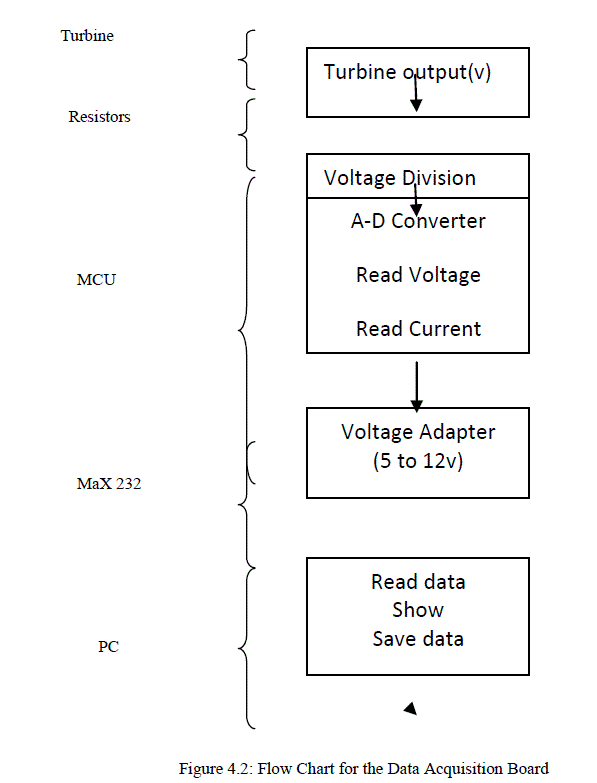 |
| Voltage adopter is an IC which increases the voltage from 5 to 12, in order to be received by serial port of PC. In another word this data acquisition board is an interface between turbine and PC. The duty of this hardware is to measure the power produced by wind turbine, at the same time sent it to computer as a data. PC receives data and displays instantaneous voltage, current, power and vibration parameter on the monitor and save them at the same time. This hardware helps us to take data automatically, otherwise all the measurements should be done manually which is very difficult and sometimes impossible. The advantage of using this device is continuous data taking and recording. In this case there will not be any lost of data. |
| The flow chart shows each component of the system separately. Voltage output from the turbine is guided to resistor series by wire, voltage range is between 0-15V at turbine output, where it drops to 0-5V when it passes from resistors. Since the voltage and resistance R are known as two constants, According to voltage division rule, the current can be calculated. After current calculation power will be obtained with multiplication of current and voltage. The wind speed can be estimated from voltage versus wind speed curve of the turbine given in instruction manual of the turbine. |
 |
B. DAQ PROPERTIES AND FEATURES |
| Software such as LabVIEW controls the acquisition and processing of such data. Here we have to consider the following properties of the input signal. |
| 1. Sampling Rate |
| 2. Resolution |
| 3. Range |
| 4. Amplification |
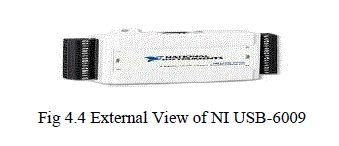
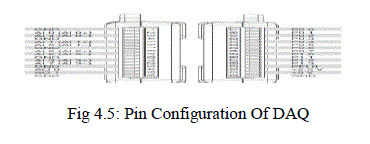
| Here the DAQ being used is NI USB – 6009. C: PIN CONFIGURATION |
  |
D: CURRENT SENSOR |
PIN CONFIGURATION AND RATINGS : V- I CHARACTERISTICS |
 |
E.ELECTRICAL CHARACTERISTICS: |
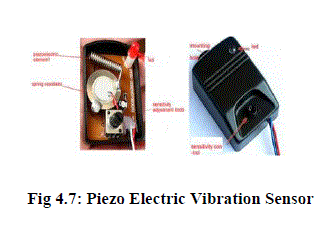
| VIBRATION SENSOR |
 |
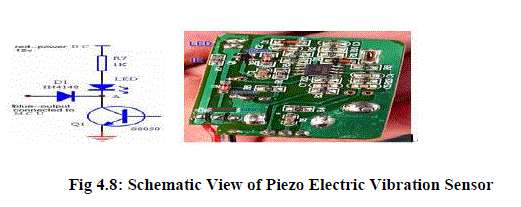 |
| Piezoelectric sensors have proven to be versatile tools for the measurement of various processes. They are used for quality assurance, process control and for research and development in many different industries. Although the piezoelectric effect was discovered by Pierre Curie in 1880, it was only in the 1950s that the piezoelectric effect started to be used for industrial sensing applications. Since then, this measuring principle has been increasingly used and can be regarded as a mature technology with an outstanding inherent reliability. It has been successfully used in various applications, such as in medical, aerospace, nuclear instrumentation, and as a pressure sensor in the touch pads of mobile phones. In the automotive industry, piezoelectric elements are used to monitor combustion when developing internal combustion engines. The sensors are either directly mounted into additional holes into the cylinder head or th spark/glow plug is equipped with a built in miniature piezoelectric sensor. |
| One disadvantage of piezoelectric sensors is that they cannot be used for truly static measurements. A static force will result in a fixed amount of charges on the piezoelectric material. While working with conventional readout electronics, imperfect insulating materials, and reduction in internal sensor resistance will result in a constant loss of electrons, and yield a decreasing signal. Elevated temperatures cause an additional drop in internal resistance and sensitivity. The main effect on the piezoelectric effect is that with increasing pressure loads and temperature, the sensitivity is reduced due to twin-formation. While quartz sensors need to be cooled during measurements at temperatures above 300 °C, special types of crystals like GaPO4 gallium phosphate do not show any twin formation up to the melting point of the material itself. |
IMPLEMENTATION & RESULTS |
A. BLOCK DIAGRAM: |
 |
B. WORKING PRINCIPLE: |
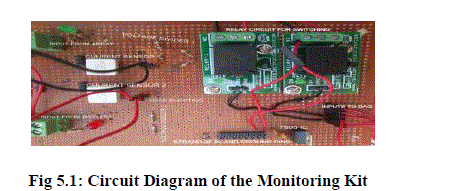
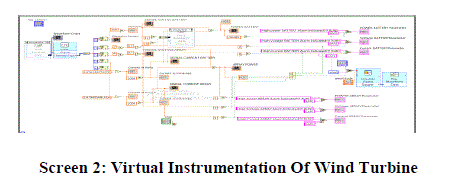
| The principle involves in wind energy is collecting the wind in the kinetic energy from and then converted into mechanical form and then to electrical form. Whenever the wind turbine runs the rotor blades get into direction and the motor starts rotating .An motor -generator combines to gives the electrical energy .There is a connectivity to the sensors for measuring the voltage, current and vibration and then the anemometer is connected to measure the wind speed. The sensors are connected to the NI Data Acquisition System and then the DAQ gives the connectivity to the software performed labview and then monitoring the performance for the collection of the data storage, processing etc., |
CIRCUIT DIAGRAM OF THE MONITORING KIT 5.3: VIRTUAL INSTRUMENTATION |
 |
 |
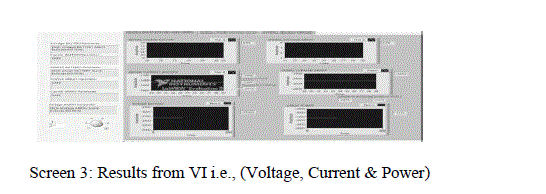
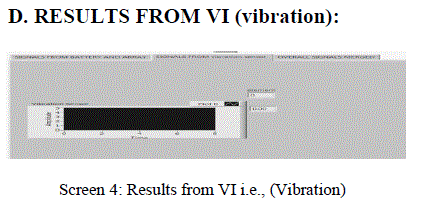
C. RESULTS FROM VI (i.e., voltage,current and power) |
 |
 |
E. RESULTS FROM THE LABVIEW VI IN WAVEFORMS: |
F. OBSERVATION RESULTS FROM BATTERY |
| Individual parameters measurement |
 |
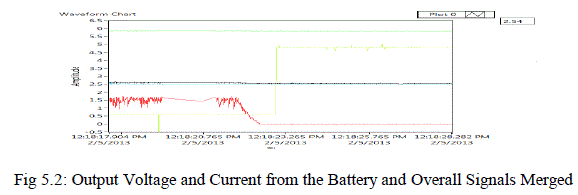
G. Overall Signals from the VI |
 |
CONCLUSION |
| A more effective method to sense , record and control the parameters affecting the performance of wind turbine is designed. This method involves continuous monitoring of the system and hence protects the system against the undesirable effects. This leads to the development of a system with increased safety and security. Also, as this deals with the environmental parameters, the performance of the system is increased to greater extent. Small-scale wind shows potential for offsetting electrical consumption of 3,800 parcels in the County. Although many of these parcels will choose not to install turbines for economic reasons, agricultural parcels in particular may be well served by small wind turbines. They generally have higher electricity demand than residential units, large spaces on which to site a turbine and can take advantage of more favorable incentives and rebate programs. |
References |
|