Research & Reviews: Journal of Engineering and Technology
ISSN: 2319-9873
ISSN: 2319-9873
Souheila Mellari*
Department of Genie Climatique (HVAC Engineering), University of Constantine 1, Constantine, Algeria
Received: 28-Dec-2022, Manuscript No. JET-22-84944; Editor assigned: 30-Dec-2022, PreQC No. JET-22-84944 (PQ); Reviewed: 16-Jan-2023, QC No. JET-22-84944; Revised: 27-Feb-2023, Manuscript No. JET-22-84944 (R); Published: 06-Mar-2023, DOI: 10.4172/2319-9873.12.1.001
Citation: Mellari S. Estimating Ice Slurry's Apparent Viscosity at Various Additive Concentrations. RRJ Eng Technol. 2023;12:001.
Copyright: © 2023 Mellari S. This is an open-access article distributed under the terms of the Creative Commons Attribution License, which permits unrestricted use, distribution, and reproduction in any medium, provided the original author and source are credited.
Visit for more related articles at Research & Reviews: Journal of Engineering and Technology
This work attempted to conduct an experimental study which demonstrates the effect of the initial concentration of solute on the apparent viscosity of ice slurry in a horizontal circular pipe. The study was conducted on ice slurry based on monopropylene glycol, MPG, varying from 5% to 24% with different ice mass fractions varying from 5% to 25%. During the experiments, the initial concentration of the MPG, ice concentration, and flow rate were modified as parameters. The flow tests were performed on laminar flows. The results of the investigation revealed that the ice slurry behaved like a non-Newtonian fluid while it sometimes behaved like a Newtonian fluid. The rheological behavior of the ice slurry is reflected by its viscosity. For the shear thickening behavior, the apparent viscosity increases with increasing the shear rate, and for the shear thinning behavior, the viscosity decreases with increasing the shear rate, while for the Newtonian behavior, the viscosity remains almost constant. Then it was revealed that the viscosity of the mixture became too high for low shear rates at high ice mass fractions by increasing the concentration of the solute. The power law was used to establish a relationship between the apparent viscosity and the indexes of flow and consistency of ice slurry.
Ice slurry; Horizontal pipe; Viscosity; Monopropylene gycol; Non-Newtonian fluid; Power law
After the elimination of CFCs and HCFCs, another alternative solution aims to reduce the charge and the confinement of the refrigerants which lead to the installation of indirect refrigeration systems, despite the increase in power absorbed by the compressors due to the complementary exchange and the pumping energy [1].
This indirect refrigerating has been done so far through single phase coolant fluids using their sensible heat, but the latent heat is more important, it is for this reason that the idea of using partial pumpable fluids is developing two phase liquid solid refrigerants called ice slurry [2].
Due to these characteristics, ice slurry, a mixture of fine ice particles and an aqueous solution, has attracted much attention as a cooling medium due to its high energy storage capacity. It has been used in many applications around the world, for examples in indirect applications requiring intermediate heat exchangers (building air conditioning systems adopted much more by Japan and Korea, large kitchens such as that of the "Klinikum hospital Stuttgart” in Germany); direct contact food cooling application (bakery, product packaging and fishing); medical applications (protection against cardiac arrest, minimally invasive laparoscopic renal surgery protective cooling and especially for improving organ recovery and transplantation). Currently, many researchers are studying the storage of electricity by pumping. Ice slurry can also be used to fight fires; the large latent heat of fusion would cool the fire.
For 30 years, researchers have been working on the thermo physical and rheological properties of ice slurries, including viscosity. The viscosity can be defined as all the phenomena of resistance to the movement of a fluid for a flow with or without turbulence; therefore, it decreases the freedom of flow of the fluid and dissipates its energy i.e. it determines its velocity [3].
The shear viscosity of ice slurry is generally determined by Thomas equation 1965, taking into account the hydrodynamic interaction of the particles, the rotation of the particles, the particle particle collision and the agglomeration phenomena. The value 2.5 of the Thomas equation extends the work of Einstein cited by Barnes valid for dilute suspensions (C<0.02 and dp<2 μm), in laminar flow, which describes the homogeneous suspension as single phase. The values of the viscosity of carrier fluid or aqueous solutions can be obtained by Melinder, Tsvetkov and Lugo, et al [4].
Jeffrey, quoted by Darby, with a constant 4.5 instead of 2.5 of Einstein's equation was able to obtain good results with the experimental values [5].
Kitanovski and Poredos found that in a 200 mm tube, the difference in the viscosity of ice slurries formed with ice particles of diameter 0.25 mm and 1 mm is 6.2%. Kitanovski explains this low value of the constants of Thomas, he continues to comment and that in the real case this difference must be greater than 30%.
After Hansen, et al., demonstrated the influence of the particle size distribution on the viscosity of ice slurry, they showed that at a constant ice concentration, the diameter of the particles increases and the number of particles decreases (effect of agglomeration).
Also, the effect of variation in particle slenderness (diameter/length) on viscosity has been illustrated in the work of Kitano et al., and reproduced from the bibliographic review of Metzner [6-10].
The dependence of the relative viscosity, with respect to the volume concentration of the solid and the granular extent of the particles, has been illustrated by Chong, et al. They show that on bimodal suspensions formed by a mixture of 25% of spheres with diameter d and 75% of spheres with diameter D, for a given concentration, the viscosity increases when the granular extent d/D decreases [11].
Frei and Egolf noticed that there is an influence of time on the diameter of the ice particles and consequently on the viscosity of the ice slurries. Because of these constraints, many experimental results led to significant deviations between the results obtained and those of Einstein and Thomas [12].
Shire, et al., in their experimental work studied the flow characteristics of ice slurry for narrow tubes from 4.3 to 10.2 mm.The analysis of the rheological properties revealed that the fluid had a pseudo plastic behavior in both regimes,laminar and turbulent.
Kumano, et al., did an experimental study on the effect of the initial concentration on the rheology of the ice slurry,they showed that the rheological behavior of the ice slurry depends on the concentration of the aqueous solution inthe ice slurry. The ice slurry tends towards a pseudo-plastic fluid for an initial mass concentration of 5% and 10% andNewtonian from a 2% ethanol solution [13].
On the other hand, Trabelsi, et al., have made an experimental investigation combined with a numerical study in orderto characterize the rheological behavior of ice slurries. Two additives were used, namely ethylene glycol and propyleneglycol at three initial concentrations 5%, 14% and 24%. The ice fraction varies from 5% to 65%. Flow ramp tests areperformed using an HR-2 hybrid rheometer. The Herschel-Bulkley model is then used to predict the rheologicalbehavior of ice slurry. The rheograms showed that the ice slurries behave as shear thinning (n<1) or shear thickening(n>1) depending on the initial concentrations of additive and ice [14].
Frazao, et al., carried out numerous rheological measurements using an HR2 hybrid rheometer for ice slurry with anice fraction between 10% and 65%. Four additives, namely sodium chloride, ethanol, ethylene glycol and propyleneglycol, were considered at a fixed mass concentration of 14%. They came to the conclusion that ice slurries based onsodium chloride and ethanol have the lowest dynamic viscosity compared to those obtained with the other twoadditives [15].
Rayhan, et al., attempted to conduct an experimental study on the flow of ice slurry in a horizontal circular pipe. Thisstudy was conducted on ice slurry supplemented based on 20% ethylene glycol at various ice mass fractions of 10% to30%. The results of this investigation revealed that the ice slurry behaved like a Newtonian fluid at a mass fractionbelow 10%, while it also behaved like a non-Newtonian fluid at a mass fraction above 15%. They deduced that tomaximize the use of ice slurries as cold energy storage, the mass fraction of ice must be kept below 20% in laminarflow [16].
Rayhan, et al., their study, attempted to investigate the rheological characteristics of ice slurry at different freezingpoints through experiments with ethylene glycol, ethanol and sodium chloride as solutes at a fixed initialconcentration of 20%. The rheology tests were channeled on the passage from laminar to turbulent flows in a circularpipe with a diameter of 12.7 mm while the mass fraction of ice varied between 0% and 28%. They showed that the iceslurry behaved as a Newtonian fluid at 10%–15% ice mass fractions, a shear thinning fluid at 15%–20% ice massfractions and a fluid shear thickening at ice mass fractions of 20-28%. In addition, the experimental viscosity datawere compared with those found in the literature. The best result was only obtained with the Morio model for ice massfractions <15%.
One finds in the literature measurements of viscosity as a function of ice concentration for each type of behavior.Table 1 lists some of the most commonly used viscosity models in the study of ice slurries by Kauufeld, et al.
The objective of this paper is that, so far, there are no models that can accurately describe the viscosity of iceslurries. There are only results specific to each author. The mixing method for calculating the thermo physical properties of ice slurries is well suited for density, conductivity, heat capacity and enthalpy but for dynamic viscosity gives very poor values compared with the experimental results of the authors. Hence, this work focused on the influence of initial concentrations of MPG and ice concentration on the apparent viscosity of ice slurry to contribute a better understanding of the behavior of ice slurries [17].
The experimental study was conducted on MPG added (5%, 11%, 14%, 19% and 24%) with varied ice mass fractions (5%, 10%, 15% 20% and 25%). The entrance section was designed to have 6 m in length to fulfill the fully developed flow, while the test section pipe used a circular pipe with 25.4 mm inner diameter and 1 m length. The mass flow for each ice fraction was varied from 400 kg.h-1 to 2000 kg.h-1.
| Authors | Model |
|---|---|
| Ostwald-de Waele | 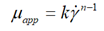 |
| Bingham | 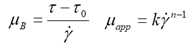 |
| Herschel-Bulkley |  |
| Shangraw-Grim-Mattocks | 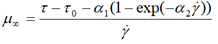 |
| Casson | 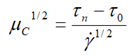 |
| Einstein | 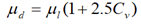 |
| Thomas |  |
Table 1. Some viscosity model by Kauufeld, et al.
Experimental set up and procedure
The installation consists of two loops (Figure 1). In the primary one, 10 kg of R404 A circulates between condensing unit, 16 kW and heat exchanger. The condensing unit equipped with two electronic pressure switches (HP,LP) Thomson control model. The first step of the methodology consists to cool gradually the mixture (water-MPG) until the freezing point temperature, then by natural heating up to the melting temperature which must be equal [18]. Second step knowing the freezing point temperature Ti, according to the expression of the liquids based on the excess function of the temperature of mixture given by Lygo, et al., one derives the initial mass fraction of the solute xi (Ti). Therefore, for a desired ice concentration, xg, the final solute concentration, xf, was calculated by the following equation:
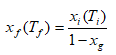

Figure 1: Layout of flow chart of the experimental setup (CEMAGREF).
On the experimental apparatus, the temperature is lowered up to the temperature Tf(xf) which was calculated beforehand by the inverse function of Lugo, et al.
The latent heat of vaporization of the refrigerant causes the formation of ice particles on the external surface of two evaporator discs situated in a brushed surface heat exchanger Headscarf model. The ECSR is driven by a LEROY SOMER LS90L three phase asynchronous motor 1.5 kW- 3.7 A, allowing to increase the agitation and to avoid the formation of a crust on the exchange surface [19].
Ice slurry was delivered to the second loop from a storage tank, capacity 270 1 equipped with single phase stainless steel paddle mixer R245 B2B type, 150 W used to allow a homogeneous mixture of ice slurry.
It is in the distribution part where mass flow, density and pressure drop were carried out trough test section using the Mass flow meter Coriolis ABB/MC 2000 type while the flow rate varied from 400 kg h-1 to 2000 kg h-1 with an accuracy of 1%, the velocity regulator MV502ACl type and differential pressure meter rose mount 3051/3001 with an accuracy of 1%. At each flow, one must wait 15 minutes for the establishment of the thermal equilibrium. A centrifugal pump Samson multi H203, 0.55 kW was placed allows ice slurry to be circulated from storage tank to exchanger heat.
On either side of the measurement section, there are two main thermocouples T type (-15°C and 0°C) 1.5 mm in diameter calibrated using a thermo stated glycol water bath KB25-1 Calcon type with an accuracy of 0.05 K.
During the defrost, the power supply to the solenoid valve is cut off so the valve closes. The low pressure in the compressor drops causing the stop of the compressor as soon as the level set on the LP pressure switch is reached then the defrost resistance operates [20].
All the instrumentations were relied to an acquisition card connected to a measurement unit, it connected to a computer. The Agilent Bench link data logger software was used to collect and analyze data.
Empirical characterization of the rheological properties of ice slurries
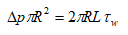
In steady state established in a horizontal circular pipe, one used the following equation given by Bird.
The shear rate is opposite to the local velocity gradient γ =-dVz/dr, in the case of laminar flow in a horizontal cylindrical pipe, the shear rate can be determined using experimental data (flow rate and pressure drop), as well as the Rabin witch and Mooney formula proposed by Skelland.
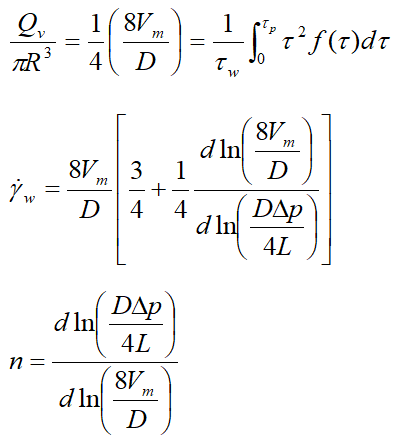
To determine the rheological behavior index of the ice slurries formed, one must plot for each ice mass fraction the curves in(DΔp/4L)=f(In(8Vm/D) for each ice mass fraction from the pressure drops measured by differential pressure meter and the flow rate Vm provided by the coriolis effect flow meter. Figure 2 gives an example of this type of curve in the case of ice slurry loaded from 5 to 25% of ice and for 14% MPG. The slopes of the five linear trend curves of the experimental data correspond to the behavior indices relating to the ice mass fractions considered.

Figure 2: Curves In(DΔp/4L)=f(In(8Vm/D) of ice slurry for xi=14%.
This method allows us to plot the curves of the ice slurry behavior indices as a function of the mass fraction of ice for the five solute concentrations, as shown by the curves in Figure 3(a-e). Then, the terms of the consistency coefficientsτw/γw are also determined as a function of the ice mass fraction and the five initial solute concentrations (Figure 4(a-e)). As no important yield has been found, the rheograms can be simply fitted by a power law under the form:μapp=kγn-1.

Figure 3: Evolution of the ice slurry behavior index as a function of the mass fraction of ice for different initial mass fractions of the solute (a) xi=5%; (b) xi=11%; (c) xi=14; (d) xi=19%; and (e) xi=24%.

Figure 4: Evolution of the consistency index of the ice slurry as a function of the mass fraction of ice for different initial mass fractions of the solute (a) xi=5%; (b) xi=11%; (c) xi=14%; (d) xi=19%; and (e) xi=24%.
The various test campaigns were carried out to study the influence of the MPG concentration, its particle content as a function of the shear rate on the apparent viscosity of ice slurry. 125 points of the pressure drop, the mean velocity and the density of ice slurry are measured and analyzed.
The experimental results were obtained at ice fractions between 5% and 25% for each initial MPG concentration which, varies from 5% to 24%. The values of the experimental behavior index of the ice slurries obtained in Figure 3(a-e) show that the flow index decreases with the ice concentrations. For MPG concentrations ≤ 11%, the ice slurry ice behaves like a non-Newtonian fluid. With increasing ice fraction, the flow transitions from shear thickening (n>1) to shear thinning (n1). On the other hand, for initial MPG concentrations ≥ 14%, the ice slurry is close to Newtonian for low ice concentrations and it exhibits shear thinning flow for high ice concentrations. Similarly, Ben Lakhdar and Guilpart, et al., have demonstrated that ice slurries present Newtonian behavior for low ice concentrations and non-Newtonian behavior for high ice concentrations.
Then for xi=19% -xg=25% and xi=24% -xg=20% and 22% of Figures 3d and 3e, the flow index becomes higher. This can be interpreted by the structure of the ice slurry. In fact, the average diameter of the particles decreases with the increase of the solute concentration. At this stage, the particles are finer, as demonstrated by Smith when their sizes are less than 50 μm as illustrated by Stamatiou. Therefore, because of their small size, these particles can interact at a distance from each other by different colloidal forces such as the London–Vander Waals forces. Consequently, at high ice concentrations, the particles tend to stick together and form an agglomeration at the top of the tube because the density of ice is lower than the solution. This is the phenomenon of stratification, where the transition from the heterogeneous regime to the moving bed causes a significant particle particle and particle-wall friction forces at low velocities. In the present study, it is clear that the index flow was not always equal to unity, which reflects the non-Newtonian behavior of ice slurry. The experimental results make it possible to establish correlations for the behavior and the consistency indexes as a function of the mass fraction of ice (the points at xi=19%, xg=25% and at xi=24%, xg=20, 22% with very high values of n and k were not taken into account).
Figures 5-9 display the evolution of the apparent viscosity of ice slurry for the five initial concentrations of solute as a function of the shear rate at ice fractions ranging from 5 to 25%. For xi=5%, the curves show that for shear thickening fluid (n>1), the viscosity increases with increasing the shear rate at ice fraction, 5% and 10%, while for xg ≥ 15% the viscosity of ice slurry decreases with increasing the shear rate. This switch from shear-thickening to shear-thinning, depending on the ice fraction, has already been reported by Trabelsi, et al.

Figure 5: Evolution of the apparent viscosity of the ice slurry as a function of the shear rate for xi=5%.

Figure 6: Evolution of the apparent viscosity of the ice slurry as a function of the shear rate for xi=11%.

Figure 7: Evolution of the apparent viscosity of the ice slurry as a function of the shear rate for xi=14%.

Figure 8: Evolution of the apparent viscosity of the ice slurry as a function of the shear rate for xi=19%.

Figure 9: Evolution of the apparent viscosity of the ice slurry as a function of the shear rate for xi=24%.
For xi=10%, one can see for xg=20% the viscosity does not vary much with the shear rate. The ice slurry can be considered as Newtonian as the flow index is very close to unity (n=1.03).
For xi=14%, the ice slurries exhibit shear thinning behavior (n<1) as a measure of the viscosity decreasing with increasing the shear rate, regardless of the ice fraction reported by Ben Lakhdar.
For xi=19%, the flow index tends to 1 for ice fractions 5% and 10%. After that, the ice slurry exhibits a shear thinning behavior of ice fractions 13% and 20%.
For xi=24%, the ice slurry can be considered as Newtonian for xg ≤ 15% as one can see clearly that the curves of the viscosity are practically horizontal. However, for (xi=19% -xg=24%) and (xi=24% -xg=20%, 24%) viscosity becomes higher and tends to be vertical at low shear rate (80-120 s-1) resulting in a significant increase in the amount of pumping energy in this case.
In addition, one can note that, up to a critical shear rate of around 250s-1, the viscosity follows a power law. After this critical value, the viscosity becomes constant. Frazao, et al., located the critical shear rate at around 115 s-1 for 14% ethanol (Figure 10).

Figure 10: Comparison of the viscosity versus shear rate.
The experimental values of the viscosity of ice slurries exhibiting Newtonian behavior for (xi=11%-xg=20%, n=1.037); (xi=19%-xg=5%, n=1.03); (xi=11%-xg=10%, n=1.033) and (xi=24%-xg=10%, n=1.069) are (μexp=10.01); (μexp=8.5); (μexp=12.5) and (μexp=10) respectively. The corresponding dynamic viscosity values derived from the Thomas equation are (μd=7.52); (μd=9.84); (μd=16.96) and (μd=8.29) respectively, where μexp and μd are expressed in mPas. One can clearly see that the viscosity from the experimental results and those given by the Thomas equation are very close.
The viscosity values of Rayhan in Figure 11 are obviously higher than those of the present work, according to a comparison with the experimental study done by Rayhan, et al., on ice slurries based on 20% glycol with varied ice mass fractions (10%, 15%, 20%, 25%, and 30%) through a circular pipe with a 12.7 mm inner diameter and 1.3 m length.

Figure 11: Comparison of the experimental viscosity and correlations values.
Since the diameter was less than that of the current study, this can be attributed to the ice slurry's storage duration, which increased the crystal development rate and, as a result, the viscosity. One can note that the viscosity values start to rise quickly with an ice fraction of 20%. Except for xg=25% of the present paper, there was a considerable increase in viscosity without significant variation in the shear rate. This means that the shear starts at 70 s-1, corresponding to 0.14 ms-1, which is less than 0.3 ms-1, despite that the flow continues. Indeed, in the study of Kitanovski and Poredos, they showed that the deposition velocity decreases with the decrease in the diameter of the tube and of the particle (example, they found that for 10% ethanol at xg=20% and a particle diameter of 0.25 mm, the deposition velocities of 0.52 ms-1 and 0.06 ms-1 correspond to diameters of 200 mm and 100 mm, respectively).
While the diameter used in Rayhan's work was half the diameter used in the present work, this explains why Rayhan's velocities were above the deposition velocity. However, the critical shear rates for the two works are around 200 s-1.
In the end, it is quite challenging to provide a general correlation to calculate the apparent viscosity of ice slurry because the behavior of ice slurry varies substantially with MPG and ice concentrations. Based on solute concentrations and ice fractions, two behavior and consistency correlation indexes have been established (Table 2).
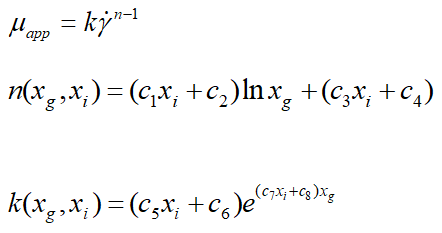
| c1 | c2 | c3 | c4 | c5 | c6 | c7 | c8 | Comments |
|---|---|---|---|---|---|---|---|---|
| 4.833 | -1.031 | -7.833 | 3.408 | 0.00078 | -3.00E-05 | -350.5 | 64.9 | 0.05 ≤ xi ≤ 0.11 0.05 ≤ xg ≤ 0.25 |
| -6 | 0.77 | 14.04 | -0.905 | -0.095 | 0.02 | 343.4 | -36.5 | 0.11<xi ≤ 0.14 0.05 ≤ xg ≤ 0.25 |
Table 2. Coefficient values of correlations.
Comparison between the experimental viscosity and the correlation values: The curves in Figure 11 illustrate a comparison between the experimental viscosity and the correlation values.
For 5% ≤ xi ≤ 11%, the experimental values of the apparent viscosity predict 26% of all experimental data with an accuracy of ± 10% and an accuracy of ± 20% to ± 30% for 31% of all experimental results.
For 11% ≤ xi ≤ 14%, the experimental values of the apparent viscosity predict 50% of all experimental data with an accuracy of ± 10% and an accuracy of ± 20% to ± 30% for 40% of all experimental results.
The difference between the model and the experimental measurements can be explained for several reasons:
•The uncertainty in the calculation of the ice fraction is of the order of 10% for a temperature variation of0.5°C. This partly explains the dispersion of the experimental points of the flow index and the consistencycoefficient. As it is an industrial material, it was too difficult to maintain the ambient temperature constant.
•Uncertainties on the mass flow, the velocity measurements even also on the length and the diameter.
•In addition, the flow index and the consistency coefficient were correlated from initial solute concentrations of5%, 11%, 14% and 19% for mass fractions of ice between 5% and 25%. The initial solute concentration of 24%was excluded from the correlations since they present very variable rheological behavior and could be thesource of a very large difference between the experimental points and the correlations.
The experimental results are given for five fixed initial concentrations of MPG (5%, 11%, 14%, 19% and 24%) and ice mass fractions varying from 5% to 25%. The shear rate varies from 50 to 350 s-1.
The principles of the capillary viscometer were applied in order to measure the mass flow, density and the pressure drops. It was possible to highlight the influences of initial solute concentration and ice concentration on the apparent viscosity of ice slurries. The experimental results show that the apparent viscosity of the ice slurry through the characterization pipe increased with increasing ice mass concentrations for different initial concentrations of solute.
In addition, the result shows that the viscosity increases with increasing the shear rate for shear thickening flow and decreases with increasing the shear rate for shear thinning flow. For Newtonian cases, as n approaches 1, the viscosity hardly varies with shear rate.
For the cases, xi=19% -xg=24% and xi=24% -xg=20% and 22% the values of the apparent viscosity are very high at low shear rate. This is due to the change in the structure of the ice slurry.
Finally, correlations between the flow and the flow consistency coefficients are established, which can describe the apparent viscosity as a function of solute concentration (5%, 11%, 14% and 19%). The experimental value of the apparent viscosity predicts 32% of all experimental data with an accuracy of ± 10% and 35% of all experimental data with an accuracy of ± 30%.
The author declares no competing interests.
The author is grateful to J. Guilpart and L.Fournaison for making their facility available to accomplish the experimental data at Cemagref.
[Crossref]
[Crossref] [Google Scholar] [PubMed]