Research & Reviews: Journal of Engineering and Technology
ISSN: 2319-9873
ISSN: 2319-9873
1Department of GiGA business, KT Corporation, Korea
2Department of Industrial and Management Engineering, POSTECH, Korea
Received Date: 24/06/2016; Accepted Date: 20/07/2016; Published Date: 27/07/2016
Visit for more related articles at Research & Reviews: Journal of Engineering and Technology
Since key technologies have become one of the core competencies in enterprises, a variety of technology strategies have appeared. However, companies often have problems in identifying which capabilities need to be concentrated upon to gain a future competitive advantage. This paper suggests a methodology to identify the most important future events and to extract the key capabilities needed in a future environment for technology exploitation with a case study of smart grid company. It can help investment decision to develop capabilities according to the priority of capabilities and select the appropriate alternative for technology exploitation.
Technology exploitation, Key capabilities, Scenario planning, Smart grid
Key technologies are becoming part of the core competencies that may provide a long term competitive advantage as technology upgrades are accelerating [1,2]. A company’s technology strategy consists of policies, plans and procedures for acquiring technology, management of that technology and the ability within the company and exploiting them for profit [3].
Technology exploitation is an important way of generating profit or other aims that the company wants to achieve [4]. The technology exploitation strategy needs to be carefully planned, especially in order to align the right resources into the correct areas to guarantee success [5].
Technology exploitation requires strong and varied capabilities. Enterprise capability is described as a company’s ability to deal with different combinations of competitive environments and levels of entrepreneurial turbulence [6]. Also, Key capability plays a crucial role in realizing the business objectives of the company [7]. The choice of capabilities permits the firm to make the best response to market opportunities [8]. So, companies have tried to recognize the most important capabilities and develop their key capabilities to build a future competitive advantage [9].
To determine the most valuable and necessary capabilities for the company, organizations should reconfigure their capabilities to match changes to the business [10]. Even though the external environment has been established and must be accepted, the internal aspects of the organization can be managed [11]. Thus, a company should optimize the balance between the environment demands and the organization’s capabilities. In an uncertain and radically changing environment, organizations have to continuously evaluate, reconfigure and redeploy the organization’s resources and capabilities and recognize environmental changes to match the organization’s resource and capability portfolio to environmental changes [12].
Proper strategic planning, which anticipates environmental change, can provide the lead time necessary for retraining workers, for replacing capital equipment, and for changing suppliers and marketing channels [13]. Companies have tried to forecast the possible future business environment. The Scenario Method is a well-established methodology widely adopted in many management fields to build the landscapes of possible future environments [14]. By identifying basic trends and uncertainties based on the perspective of the macro environment and the industrial environment, multiple scenarios can be constructed [15]. However, managers cannot easily adjust at wrong set of organizational capabilities to the emergence of market opportunities [8].
While there are many studies that analyzed the external environment and the internal environment as separate parts [10,16], less study has been done on the relationship between external environments and internal capabilities at the execution level. Therefore, this paper suggests a methodology to identify the most important future events and to extract the key capabilities needed for the requirements of the future. To identify the most important future events, the probability and the impact of future events are estimated. By identifying the relationship between organizational capabilities and future requirements, key capabilities can be extracted.
This paper is organized as follows. Section 2 reviews the previous studies relating to the analysis of the external environment and internal capabilities. Section 3 suggests a methodology to extract the key capabilities. Section 4 concludes this paper with some remarks on the limitations of this study.
Research related to forecasting the future business environment to exploit technology
As technology exploitation is influenced by external environment forces, strategic business managers should understand the business environment. External factors can be classified according to their attractiveness and the success probability of opportunities and seriousness and probability of occurrence of threats [17]. The external business environment can be viewed from two major angles; the macro environment and the industrial environment [18].
From the macro environment perspective, Cooper [19] introduced five basic environmental forces: political, behavioral, economic, social, and technological. Each of these forces affects different aspects of the product development process. Preez et al. [20] state that environment change can be seen as a response to various political, social, economic, and technological forces.
From the industrial environment perspective, Porter classifies the industrial environment as buyers, suppliers, potential entrants, substitutes, and industry competitors [21]. These various environment forces drive the technological trends and global demands that cause technological change [20] and technological change requires a new set of engineering and scientific principles which can open up new applications and market segments [22].
The Scenario Method is widely used to build the landscapes of possible future environments [15]. The Scenario Method has often been used to manage the uncertainty of the technological environment and to support the shaping of a long-term technology strategy [23]. There is a lot of research available using the Scenario Method to forecast future environments and establish technology strategies. Lee et al. [24] used scenario based technology road-mapping to systematically assess the impact of future changes on organization’s plan. Wright and Goodwin [25] suggested use of the Scenario Method to reduce the perceived level of environmental threat and lead to a stepwise change in strategic decision making. Preez et al. [20] provided a scenario building process for anticipating technological change and assessing the specific technological threats and opportunities facing the organization. Kurttila et al. [17] suggested a framework to analyze each possible future scenario with SWOT analysis and AHP comparisons.
A technology roadmap is also a flexible technique that is used within industries to support strategic and long-range planning [26]. It helps to determine proper technology alternatives, and map them with resource allocation plans [5]. Anderson et al. [27] emphasized the importance of a roadmap of future technology in order to be competitive. They present a framework to characterize and forecast progress in wireless communication technology.
Factors affecting technology exploitation
Identifying internal and external factors is important to an enterprise’s future [17]. Many research examples present several major factors which would affect technology exploitation from various perspectives.
From the perspective of external factors, Kumar and Jain [28] pinpointed four major stakeholder groups: industrial companies, financial institutions, technology institutions and policy-makers and facilitators as important factors. Kastrinos [29] discussed the influence of three sets of factors that may interfere in the exploitation of R&D results by individual companies, factors relating to the participating companies, factors relating to the finances, and factors that differentiate R&D projects. Grupp et al. [30] established differences in national technology policies and their impact on corporate activity.
As the perspective of the internal factors, Phaal et al. [31] emphasized the integration of technical, marketing, human resources and financial functions for successful technology exploitation. Wang et al. [32] states that successful technology exploitation depends on obtaining radical innovation R&D capabilities, innovation decision capabilities, marketing capabilities, manufacturing capabilities, and capital capabilities. Zehner [33] emphasized the link between management strategy and management of technology to create customer value and get a competitive advantage in today’s technological environment.
However, the influence of each internal and external factor may be different according to the technology characteristic and the organizational situation. Therefore, it is necessary to evaluate the influence degree of these factors for the exploitation of technology.
Research related to extracting key capability for technology exploitation
Zahra and Nielsen [9] examined the effect of a company’s four capabilities, internal and external human capabilities and internal and external technological capabilities on successful technology commercialization. The results show that internal human and technology based manufacturing sources are positively associated with successful technology commercialization.
Erensal et al. [1] used the fuzzy analytical hierarchy process to determine the most important capabilities in technology management for maximizing a company’s financial performance. They evaluated the importance of each competency towards the aim of achieving a competitive advantage.
Hafeez et al. [7] provided a framework for determining the key capabilities required by using the Analytic Hierarchy Process. Financial and non-financial measures are employed providing a balanced scorecard for capability evaluation. In their case study, the five main capabilities of a company were selected e.g., purchasing, sales and marketing, R&D, manufacturing, and performance management. The performance measures were compared pairwise to assign subjective priorities provided by the management of the company.
Despite of the important impact of external environments for technology exploitation, the above research examples did not consider them. There are several studies available which consider external environments with internal environments. Hou et al. [34] use a four-dimensional framework to judge a company’s technical capability which includes technology innovation capacity, technology transfer capacity, technology learning capacity and manufacturing capacity. However, the research provides only the concept of the relationship between the internal and external environments.
Bergman et al. [12] suggest the scenario process as a tool for assessing the requirements of a changing business environment and identifying the capabilities needed in alternative future scenarios. However, the research does not suggest a structured method to extract the key capability.
Even though these research considered the effect of the external environment, they did not suggest a structured method for extracting the key capabilities. So, a structured method based on analyzing the relationship of internal and external environments is required to extract the key capabilities at a practical level.
A company needs to identify the most important capabilities and develop these key capabilities while considering the future business environment for the successful exploitation of technologies.
This paper suggests a methodology for assessing the effect of the possible future environment, and extracting the key capabilities needed in the future environment for the exploitation of technology through analyzing the relationship of internal and external environments.
This methodology can also help companies to figure out the strengths and weaknesses of their key capabilities in the context of the future business environment. Also, a company can understand the lead time necessary for strengthening insufficient key capabilities before the exploitation point of new technologies.
As (Table 1) shows, the methodology consists of five phases. In phase 1, through the analysis of possible future opportunities and threats, the major events are identified which could affect the exploitation of technology. In phase 2, as future events are uncertain, the occurrence possibility of each event is estimated based on the judgment of experts. In phase 3, the impact of each event could be different. So, the relative impact of each event is assessed with a pairwise comparison. In phase 4, the company’s internal factors are analyzed.
Table 1: Methodology for extracting key capabilities.
| Phase 1 | Analyzing the future environment |
| Identifying major events | |
| Phase 2 | Building expert group related to the technology exploitation |
| Sharing information and discussing the possibility | |
| Assessing the probability of each event | |
| Phase 3 | Constructing matrix formation |
| Evaluating relative impact by pairwise comparison | |
| Assessing the impact of each event | |
| Phase 4 | Selecting capabilities related to the technology exploitation |
| Assessing the level of each capability | |
| Matching each event with related capabilities | |
| Evaluating the performance of capabilities for each event | |
| Phase 5 | Analyzing the relationship of internal and external environment |
| Extracting key capabilities |
After identifying the major capabilities related to technology exploitation, the level of each capability is assessed. Also, by matching each event with the strongly related capabilities, the company’s level for each event can be estimated. In phase 5, based on the above, aspects such as the probability, the impact, and the performance, key events and key capabilities can be extracted for the successful exploitation of technology.
Phase 1 Identifying future major events
It is of significance to identify possible opportunities and threats in business environments [35]. Scenario planning is widely used to see the future environment broadly in fundamental trends and uncertainties [25]. By identifying basic trends and uncertainties, a manager can construct a series of scenarios.
In this paper, we refer to the major issue which will effect to the exploitation of technology as an ‘event’. The methodology approaches the event from a ‘divide and conquer’ orientation [36] to analyze and evaluate the future environment with an organization’s capabilities. Through the analysis of future scenarios, the major events are identified by a company’s experts.
Phase 2 Estimating the probability of each event
Because of the importance of the future business environment for a company’s survival, many companies have tried to forecast the future business environment. Although the future cannot be predicted with certainty, it is important to estimate the possibility of the occurrence of future opportunities or threats for the exploitation of new technology [13]. According to the occurrence possibility of an event, a company will have to prepare for the event on a different level. The probability is obtained by human experts through assessment [37]. The occurrence probability for each event can be estimated by a group of responsible executives [38].
In this paper, the probability of each event’s occurrence is estimated through a group decision making process. The decision making group is composed of a panel of people who are experts regarding the events that characterize the scenarios [39]. After the process of sharing information and discussing their opinion is completed, the consensus of the expert group will be obtained to work out the probability of occurrence of each event.
Phase 3 Assessing the impact of each event
It is important to assess the business impact of future events facing the organization [20]. Each event may have a different impact for the exploitation of technology. So, the relative priorities of each criterion can be assessed by pairwise comparisons using the judgments of experts [40]. The priorities of the impact of each event are assessed by each pairwise comparison using Analysis Hierarch Process (AHP). After constructing a set of pairwise comparison matrix for the events, the priorities of the impact are obtained from the comparisons.
The relative importance of events is compared by the computation of eigenvalues and eigenvectors.
R × w=λmas × w
Where is w is the eigenvector, the weight vector, of matrix R, and λmas is the largest eigenvalue of R. AHP calculates a consistency ratio (CR) to reflect the consistency of the decision maker’s judgments during the evaluation phase. The CR and consistency index (CI) in both the decision matrix and in the pairwise comparison matrices are calculated with the followed equation.
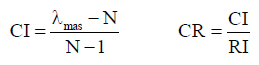
Where RI is the random index and N is the number of items. If the inconsistency index approaches zero, the consistency of the assessments will be increased. The relevant ratio should be lower than 0.10 to accept the AHP results as consistent.
For the example in Table 2, the 5 main events are identified and the matrix formation is constructed to assess the priority of each event. Based on the experts’ judgment, the relative degree of each event’s impact is assessed using a pairwise comparison.
Table 2: The impact of each event.
| Event 1 | Event 2 | Event 3 | Event 4 | Event 5 | Priority I(ei) | |
|---|---|---|---|---|---|---|
| Event 1 | 1 | 1/4 | 1/6 | 1/4 | 1/8 | 0/036 |
| Event 2 | 4 | 1 | 1/3 | 3 | 1/7 | 0.122 |
| Event 3 | 6 | 3 | 1 | 4 | 1/2 | 0.262 |
| Event 4 | 4 | 1/3 | 1/4 | 1 | 1/7 | 0.075 |
| Event 5 | 8 | 7 | 2 | 7 | 1 | 0.506 |
Phase 4 Assessing the level of a company’s capability
There are various definitions of the terms ‘resources,’ and ‘capabilities’. In this study, the following definition of capabilities has been adopted. The terms ‘resources’ and ‘capabilities’ are used interchangeably and refer to the tangible and intangible assets firms used to develop and implement their strategies [41].
A company possess various kinds of capabilities such as brand names, in-house knowledge of technology, employment of skilled personnel, trade contacts, machinery, efficient procedures, capital, and so on [42]. Among them, a company needs to recognize the key capabilities and develop them to gain future competitive advantage [9]. The key capabilities of a company are varied depending on the company size, objectives and technology characteristics [4].
Various capabilities identified should be examined by the company’s experts to assess whether these capabilities are appropriate for use in the exploitation of technology. Selected future capabilities of the company are assessed according to their levels in comparison with industry competitors based on the judgment of experts. Then, they need to recognize the relationship between internal capabilities and external events in order to harmonize them. So, each event is matched to the capabilities that could handle the event on the relationship matrix. The concept of the relationship matrix is based on similar thinking to the House of Quality (HOQ) [43]. The capability level for each event is obtained by calculating the score of capabilities which is related to each event as follows.
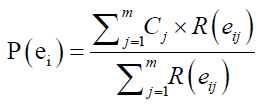
P(ei): the level of capabilities related to ith event
Cj : the level of jth capability
R(eij): the relation between ith event and jth capability. If the relation is existed between ith event and jth capability, R(eij) is 1 and if the relation is not existed between ith event and jth capability, R(eij) is 0.
m: the number of selected capabilities
In the example shown in Table 3, the 7 capabilities are selected and their levels are evaluated for the exploitation of technology. Also, each event is matched to strongly related capabilities. For example, event 1 is matched with capability 4 and capability 5 which could handle the event. So, the capability level for event 1 is 4 which is the mean of matched capability 4 and capability 5.
Table 3: The level of capabilities for each event.
| Event 1 | Event 2 | Event 3 | Event 4 | Event 5 | ||
|---|---|---|---|---|---|---|
| Capacity 1 | 1.50 | ○ | ||||
| Capacity 2 | 4.25 | ○ | ||||
| Capacity 3 | 2.75 | ○ | ○ | |||
| Capacity 4 | 3.00 | ○ | ||||
| Capacity 5 | 4.75 | ○ | ○ | |||
| Capacity 6 | 1.75 | ○ | ○ | |||
| Capacity 7 | 1.25 | ○ | ○ | |||
| mean | 3.88 | 1.92 | 4.50 | 1.38 | 2.25 |
Phase 5 Analyzing the relationship of internal and external factors
Through the above phases, the probability, the impact and the capability level of each event are measured. Using these three-dimensional aspects, the key events and key capabilities can be extracted using an extended Importance-Performance Analysis (IPA).
IPA considers the importance and performance dimensions to define priorities and guide resource allocation decisions [44]. It is a simple and effective tool that is most helpful in determining how limited resources can be most effectively utilized to achieve a goal [45]. IPA constructs a two dimensional matrix based on the importance and the performance of criteria. With regards to the importance and performance, it divided the quality characteristics into four quadrants by treating the median as the matrix split value. (1) Concentrate here (2) Keep up the good work (3) Low priority (4) Possible overkill [46]. To reflect the uncertainty attribute of future events, the importance aspect is split into two areas; the probability and the impact for this study. And the performance aspect represents the capability level.
The evaluation results from the probability, the impact, and the performance perspectives are plotted in a three-dimensional matrix as shown in Figure 1. The front right hand cells of the matrix represent that the events in this cells are extremely important based on the probability and the impact perspectives. The events occupying these cells are key events which would strongly effect the exploitation of the technology.

Figure 1: The position of each event.
In Figure 2, the key events are event 3 and event 5 with high probability and high impact. Also, from the grid we can see that the event 3 has a high level relating to capabilities but the event 5 has low a level relating to capabilities.

Figure 2: Scenarios for smart grid.
Table 4 explained each octant of the three-dimension matrix. Octant I shows that the event is very important and a company possesses a high enough degree of capability relating the event. In other hand, octant II shows that the event is very important but the level of related capabilities is not good enough.
Table 4: The classification framework of each octant.
| Classification | Impact | Probability | Performance | Explanation | |
|---|---|---|---|---|---|
| Octant I | Big chance | HIGH | HIGH | HIGH | Capture the opportunity by managing the capabilities vigorously |
| Octant II | Concentration | HIGH | HIGH | LOW | Strengthen the capabilities by reallocating internal resources or acquiring external resources from the outside |
| Octant III | Careful monitor | HIGH | LOW | HIGH | Monitor the indication of the event and maintain the degree of the capabilities |
| Octant IV | Potential risk | HIGH | LOW | LOW | Monitor the indication of the event and find external resources from soutide |
| Octant V | Beware of mutation | LOW | HIGH | HIGH | See the sign of change and maintain the capabilities passively |
| Octant VI | Fence-sitting | LOW | HIGH | LOW | See the sign of the change and find external resources from outside |
| Octant VII | Overcapacity | LOW | LOW | HIGH | Release some resources for Octant II |
| Octant VIII | Low priority | LOW | LOW | LOW | Wait and see |
From the example above, event 3 is in the Octant I. So, a company would have to manage the degree of the level of the capabilities continuously. Event 5 is in the octant II. So, a company would have to concentrate and develop in this area.
Now, we can extract the key capabilities. The key capabilities are the ones which are matched to key events. In this example, the key capabilities are capability 2 and capability 5 which are matched with key event 3, and capability 3 and capability 6 which are matched with key event 5.
Table 3 showed that the capability 2 and the capability 6 from the key capabilities have high level scores. Thus, the company needs to maintain their degree of the capabilities. On the other hand, capability 3 and capability 4 have low level scores. A company has to concentrate here to upgrade these capabilities to commercialize new technologies successfully.
Ford (1988) provided four technology exploitation strategies as employed in their own production system, contracted-out manufacturing, joint venture or licensed-out. The strategic managers of a company must make the decision to either go it alone or collaborate with more established companies because of limited complementary capabilities for internal technology exploitation [47]. Also, strategic investment decisions are needed such as capability development, or outsourcing according to the organizational situation for the exploitation of technology.
Case Study
The methodology is applied by company K to assess the future business environment and extract the key capabilities needed in the field of smart grid technology. Company K provides wired and wireless telecommunication services in Korea. It was established in 1981 and it has about 35,000 employees. Company K plans to secure a growth engine by making continuous investments in green businesses such as the smart grid and green internet data centers. Company K has been preparing for the exploitation of smart grid Advanced Metering Infrastructure (AMI) which is a technology that collects, measures and analyzes energy usage by enabling the transfer of data over a two-way communications network connecting advanced meters and the utility’s control systems [48].
Phase 1 Identification of major future events
Each scenario tells a story of how various relationships between elements can be formalized, so it can help an expert group to easily understand the future environment’s image as a communication tool.
Four alternative scenarios were provided for the smart grid. Two dimensions for the scenarios were selected by identifying the high impact issues in the smart grid industry, which include a strong supporting policy versus a weak supporting policy and multiple service providers versus a monopolized organization.
Through an interview with five experts from the new business planning department and the research laboratory in company K, the major events for the smart grid AMI were identified. The experts have a role in examining technological trends and creating the policy for the smart grid within the country, and referencing overseas cases that exploited smart grid AMI technology.
Through interviews, 15 events which would affect the exploitation of Smart Grid AMI were extracted based on scenario named, Smart-Grid Leader. After the discussion with the experts, 9 major events are selected as shown in Table 5.
Table 5: The major events for smart grid.
| Content | ||
|---|---|---|
| Event 1 | Continue support from the government | |
| Event 2 | A perfectly competitive electricity market | |
| Event 3 | Enforcement of Real-time power rate | |
| Event 4 | Setting up a smart-meter in every home | |
| Event 5 | Saving the use of electricity voluntarily over 5% | |
| Event 6 | Over 30% share of electric vehicle in the vehicles market | |
| Event 7 | Over 50% share of direct current in the power production | |
| Event 8 | Over 30% share of renewable energy in the power production | |
| Event 9 | Occurrence of security and privacy accident | |
Phase 2 Estimating the probability of each event
In the smart grid industry, the main issues are the policy of the government and the participation level of the Korea Electric Company. Because this case study is based on one scenario named, the ‘Smart-Grid Leader’, we assume that there will be the strong support policy from the government and the active participation of the Korea Electric Company.
To estimate the probability of each event, five experts of Company K participated in an expert group. The industrial experts are not in favor of the heavily-used mathematical method, but prefer to use knowledge based on their experiences for decision making. After the discussion process for the probability of each event was completed, a consensus opinion of the expert group was obtained. The probability of each event’s occurrence is shown in Table 6.
Table 6: The probability of each event’s occurrence.
| Event Factor | Probability | |
|---|---|---|
| Event 1 | Continuous support from the government | 90% |
| Event 2 | A perfectly competitive electricity market | 80% |
| Event 3 | Enforcement of Real-time power rate | 90% |
| Event 4 | Setting up a smart-meter in the every home | 80% |
| Event 5 | Saving the use of electricity voluntarily over 5% | 70% |
| Event 6 | Over 30% share of electric vehicles in the vehicles market | 60% |
| Event 7 | Over 50% share of Direct current in the power production | 50% |
| Event 8 | Over 30% share of renewable energy in the power production | 70% |
| Event 9 | Occurrence of security and privacy accidents | 80% |
Phase 3 Assessing the impact of each event
To assess the relative impact of each event, the questionnaire survey was performed by seven experts which included five industrial experts in the field and two scholastic researchers. The questionnaire was used to derive the relative priorities on absolute scales from both discrete and continuous paired comparisons between the events. The AHP provides a measure called the consistency ratio to check the consistency of judgment [49]. A consistency ration of 0.1 is considered as the acceptable upper limit [7].
On the first run, two responses under an inconsistency ratio of 0.1 were accepted but five responses were re-evaluated from their judgments because the inconsistency ratio was greater than 0.1. Next time, all of the seven responses were under the inconsistency ratio of 0.1 and accepted. To prioritize each event according to the impact, Expert Choice, AHP software was used. The software is able to execute each phase of the evaluation and then synthesize these judgments. It is also able to check the consistency ratio for pairwise comparisons automatically. As the aggregation of individual judgments, the geometric mean method is used [50]. The result of the impact of each event is shown in Table 7.
Table 7: The impact of each event.
| Event Factor | Impact | |
|---|---|---|
| Event 1 | Continuous support from the government | 0.150 |
| Event 2 | A perfectly competitive electricity market | 0.127 |
| Event 3 | Enforcement of Real-time power rate | 0.131 |
| Event 4 | Setting up a smart-meter in the every home | 0.211 |
| Event 5 | Saving the use of electricity voluntarily over 5% | 0.077 |
| Event 6 | Over 30% share of electric vehicles in the vehicles market | 0.056 |
| Event 7 | Over 50% share of Direct current in the power production | 0.046 |
| Event 8 | Over 30% share of renewable energy in the power production | 0.045 |
| Event 9 | Occurrence of security and privacy accidents | 0.156 |
Phase 4 Assessing the level of company’s capability
Phase 4.1 Selecting company’s capabilities
Technology exploitation requires varied capabilities. It depends not only on technological capabilities, but also on critical capability in the various areas [32].
Internal business systems could be separated out into value generating activities referred to as the value chain [18]. Through interviews with the company experts, the 7 functional areas related to smart grid technology were identified. They included capital management, human resource management, technology development, collaboration and alliance, operation, marketing and sale, and installation.
Based on an understanding of the value creation process, 21 capabilities related to the exploitation of smart grid AMI were identified through interviews with the company experts. The list of the capabilities is shown in Table 8.
Table 8: The major capabilities related to smart grid and the level of each capability.
| Capability | Description | Level | Capacity Category |
|---|---|---|---|
| Capacity 1 | Fund ability for new market entrance | 4.1 | Capital management |
| Capacity 2 | Training program of the relevant field | 3.5 | HRM |
| Capacity 3 | Wireless devices technology | 3.7 | Technology development |
| Capacity 4 | M2M technology | 3.4 | |
| Capacity 5 | Power line communication technology | 2.5 | |
| Capacity 6 | Renewable-energy technology | 1.6 | |
| Capacity 7 | Demand-response system technology | 2.6 | |
| Capacity 8 | Relationship with major subcontractors | 3.4 | Collaboration & Alliance |
| Capacity 9 | Support programs for subcontractors | 3.4 | |
| Capacity 10 | Negotiation capability | 3.8 | |
| Capacity 11 | Customer database | 4.4 | Marketing & Sales |
| Capacity 12 | Control ability of customer contact point | 4.0 | |
| Capacity 13 | Brand reputation | 4.7 | |
| Capacity 14 | IT/Energy consulting capability | 3.4 | |
| Capacity 15 | Mileage point service | 2.9 | |
| Capacity 16 | Quality of wired and wireless networks | 4.9 | Operation |
| Capacity 17 | Experience of energy industry | 2.7 | |
| Capacity 18 | IT security | 4.4 | |
| Capacity 19 | Operation of monitor and control center | 4.0 | |
| Capacity 20 | Smart-meter installation capability | 2.1 | Installation |
| Capacity 21 | DC operation capability | 3.7 |
Both tangible and intangible resources are considered to be major capabilities and play an important role in industry. Intangible resources such as the brand and the knowledge assist in the creation and sustaining a competitive advantage [51]. In the smart grid industry, the convergence capabilities of electric areas and telecommunication areas are required in addition to more common management capabilities. For collaboration with superior subcontractors, a support program for them and negotiation capabilities is selected.
Phase 4.2 Assessing the level of company’s capabilities
To assess the current level of each capability, a questionnaire survey was conducted. The questionnaire uses a 5-point Likert scale which has the advantage of being a well-accepted technique mainly due to its simplicity and reliability [52].
The questionnaire was sent to 15 employees who are in the different departments of the company to reflect various opinions. 14 responses were accepted and 1 unreliable response was discarded. Table 8 shows the level of each capability.
Phase 4.3 Matching each event with the related capabilities
To identify the relation between each event and each capability, the expert group discussed and matched each event with strongly related capabilities. Table 9 shows the relationship between them and the capability degree for each event.
Table 9: The relationship matrix between events and capabilities.
| Matching | Event 1 | Event 2 | Event 3 | Event 4 | Event 5 | Event 6 | Event 7 | Event 8 | Event 9 | ||
|---|---|---|---|---|---|---|---|---|---|---|---|
| Capacity 1 | 4.1 | V | |||||||||
| Capacity 2 | 3.5 | ||||||||||
| Capacity 3 | 3.7 | ||||||||||
| Capacity 4 | 3.4 | V | |||||||||
| Capacity 5 | 2.5 | ||||||||||
| Capacity 6 | 1.6 | V | |||||||||
| Capacity 7 | 2.6 | V | V | ||||||||
| Capacity 8 | 3.4 | ||||||||||
| Capacity 9 | 3.4 | ||||||||||
| Capacity 10 | 3.8 | ||||||||||
| Capacity 11 | 4.4 | V | |||||||||
| Capacity 12 | 4.0 | V | |||||||||
| Capacity 13 | 4.7 | V | |||||||||
| Capacity 14 | 3.4 | ||||||||||
| Capacity 15 | 2.9 | ||||||||||
| Capacity 16 | 4.9 | V | |||||||||
| Capacity 17 | 2.7 | V | V | V | |||||||
| Capacity 18 | 4.4 | V | |||||||||
| Capacity 19 | 4.0 | V | V | V | V | ||||||
| Capacity 20 | 2.1 | V | V | V | |||||||
| Capacity 21 | 3.7 | ||||||||||
| mean | 3.7 | 3.6 | 3.3 | 3.1 | 4.0 | 3.6 | 3.7 | 2.8 | 4.2 |
For example, event 1 is matched with capability 13 and capability 17 which could handle the event. Therefore, the capability level for event 1 is 3.7 which is the mean of the level of capability 13 and capability 17.
Phase 5 Analyzing the relationship of internal and external factors
The key events for the exploitation of smart gird AMI were determined by plotting each event in a three-dimension matrix form as shown in Figure 3.

Figure 3: The position of each event in three-dimension matrix.
Based to the degree of each event’s probability and impact, key events are determined. So, the key events with high scores on both of probability and impact dimensions are event 1, ‘continuous support of the government’, event 3, ‘enforcement of a real-time power rate’, event 4 ‘setting up a smart-meter in every home’, and event 9 ‘occurrence of security and privacy accidents’.
Because of the limited resources of the company, choice and concentration are required for capability development. The decision problem is focused on finding out which would be the best targets as key capabilities. Key capabilities are the most important capabilities for the most significant events.
Finally, we extracted the key capabilities that were matched to key events. The key capabilities were capability 1, 7, 12, 13, 17, 18, 19, and 20 as shown in Table 10.
Table 10: The key capabilities in the smart grid.
| Key Capability | Ability | ||
|---|---|---|---|
| Capability 1 | Fund ability for new market entrance | 4.1 | High |
| Capability 7 | Demand-response system technology | 2.6 | Low |
| Capability 12 | Control ability of customer contact point | 4.0 | High |
| Capability 13 | Brand reputation | 4.7 | High |
| Capability 17 | Experience of energy industry | 2.7 | Low |
| Capability 18 | IT security | 4.4 | High |
| Capability 19 | Operation of monitor and control center | 4.0 | High |
| Capability 20 | Smart-meter installation capability | 2.1 | Low |
Capability 1, 12, 13, 18, and 19 from the key capabilities have a high degree of capability level. So, these key capabilities are required to maintain the capability degree. On other hand, the key capability 7, 17, and 20 have a low capability degree. Thus, the company has to concentrate here to upgrade these capabilities for the successful exploitation of technology.
The methodology provides the company K with the most important future events and the key capabilities necessary for technology exploitation. It also provides the strengths and weaknesses of the company’s key capabilities. Based on the result, it can be a support guide for undertaking strategic investment decisions for capability development according to the priority of capabilities for the exploitation of technology.
This study suggests a methodology for extracting the key capabilities as part of a technology exploitation strategy. The methodology also extracts the most important events which could effect to the exploitation of technology. It identifies major future events by forecasting future external environments and estimates the influence by assessing the probability and the impact of each event. To identify the relationship between organizational capabilities and future requirements, it matches each external event with the internal capabilities that could handle the event and evaluates the level of the capabilities for each event.
It can be applied to a new business implementation for extracting key capabilities. It is important to find the parameters that influence the success of new business [28]. So, this methodology is helpful to find the major external parameters and to identify the most important capabilities for the new business implementation. The methodology was applied to a real case, in the smart grid industry. Base on the result, the key events were identified, that could affect the smart grid industry and key capabilities were extracted, which the organization needs to concentrate on for the successful exploitation of technology.
One of the limitations of this paper is that the research considers the limited number of internal and external factors. If a wider set of factors is taken into consideration, the result could be more sophisticated and robust. Based on the time series analysis, and until the technology exploitation is implemented, the validity of decisions and factors that are proposed by the methodology can be evaluated.