INTRODUCTION
|
| In today's networked world, the need to maintain the security of information or physical property is increasingly important and increasingly difficult. From time to time we hear about the crimes of credit card fraud, computer break-in by hackers, or security breaches in company or government buildings. In most of these crimes, the criminals were taking advantage of a fundamental flaw in the conventional access control systems: the systems do not grant access by "who we are", but by" what we have", such as ID cards, keys, passwords, PIN numbers, or other's maiden name. None of these means are really defining us. Rather, they merely are means to authenticate us. It goes without saying that if someone steals, duplicates, or acquires these identity means, he or she will be able to access our data or our personal property any time they want. Recently, technology became available to allow verification of "true" individual identity. This technology is based in a field called "biometrics". |
| In this paper Wavelet transform is utilized to extract features from face images and use NN classifier to classify the unknown face image. |
DESIGN OF FACE RECONGNITION
|
| Like any biometric system, face recognition system operates in one of the two modes: Verification or identification, Verification: one-to-one (1:1) matching or authentication – establishes the validity of a claimed identity by comparing a verification template to an enrolment template. Verification answers the question: “Am I who I claim to be?” Identification: one-to-many (1:N) matching– determines a person’s identity by searching against a biometric database. Positive identification answers the question: “Who is this person?”. Both systems perform the task of user enrolment. The enrolment module registers individuals in to the biometric system database. Identification module identifies an enrolled user based on their biometric characteristic without the user having to claim an identity. The entire system is divided in to two process enrolment and identification. Both processes involves following operations User interface, Preprocessing, Feature extraction, Matching, Accept/reject. |
| User interface: Facial image of person seeking recognition, is obtained through a digital camera and stored in a computer. |
| Preprocessing: The effectiveness of the system is highly dependent on image capture conditions. Hence in an any face recognition system preprocessing is essential. There are many image representations and filtering techniques such as color normalization, histogram equalization, edge detection noise reduction etc |
| Feature extraction: Feature extraction is the process where pre-processed face images are considered and powerful points are extracted which represents. |
| Matching: Test image is compared with images stored in the data base for matching. |
| Accept/reject: Result of comparison is displayed. |
WAVELET TRANSFORM
|
| A. INTRODUCTION |
| The wavelet transform, which was developed independently on different fronts, is gradually substituting the Fourier transform in some essential signal processing applications. Multiresolution signal processing, used in computer vision; sub-band coding, developed for speech and image compression; and wavelets series expansions developed in applied mathematics, have been recognized as different views of a single theory. Wavelet transform applies to both continuous and discrete signals. This transformation provides a general technique that is applicable to many tasks in signal processing. |
| The wavelet transform is successfully applied to non-stationary signals for analysis and processing and provides an alternative to the Short-time Fourier transform (STFT). In contrast to STFT, which uses a single analysis window, the wavelet transform uses short windows at high frequencies and long windows at low frequencies. This flexibility is introduced in the spirit of so-called .constant Q. or constant relative bandwidth frequency analysis. For some applications it is desirable to obtain the wavelet transform as signal decomposition onto a set of basis functions, referred to as wavelets. These basis functions are obtained from a single prototype wavelet by dilations and contractions (scaling) as well as shifts. Recent surge in application of wavelet transform in various areas of signal processing resulted from the effectiveness of this mathematical tool for analysis and synthesis of signals. |
| B. WAVELET ANALYSIS [5] |
| The analysis of a non-stationary signal using the FT or the STFT does not give satisfactory results. Better results can be obtained using wavelet analysis. One advantage of wavelet analysis is the ability to perform local analysis. Wavelet analysis is able to reveal signal aspects that other analysis techniques miss, such as trends, breakdown points, discontinuities, etc. In comparison to the STFT, wavelet analysis makes it possible to perform a multi-resolution analysis. |
| C. MULTI-RESOLUTION ANALYSIS |
| The time-frequency resolution problem is caused by the Heisenberg uncertainty principle and exists regardless of the used analysis technique. For the STFT, a fixed time-frequency resolution is used. By using an approach called multiresolution analysis (MRA) it is possible to analyze a signal at different frequencies with different resolutions. The change in resolution is schematically displayed time frequency |
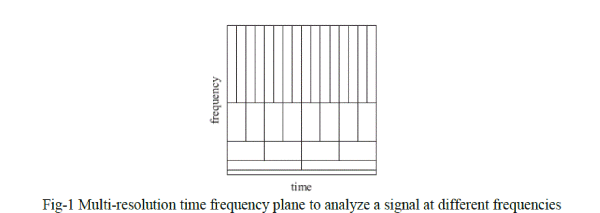 |
| For the resolution of Fig-1 is assumed that low frequencies last for the entire duration of the signal, whereas high frequencies appear from time to time as short burst. This is often the case in practical applications. The wavelet analysis calculates the correlation between the signal under consideration and a wavelet function ψ(t). The similarity between the signal and the analyzing wavelet function is computed separately for different time intervals, resulting in a two dimensional representation. The analyzing wavelet function ψ(t) is also referred to as the mother wavelet. |
| D. WAVELETS |
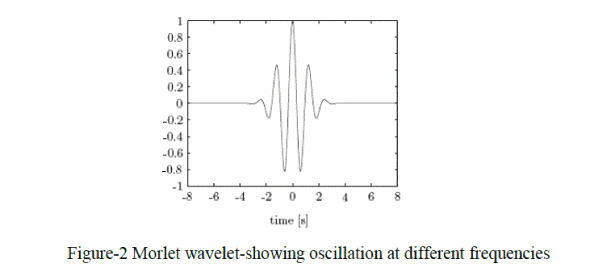
| In comparison to the Fourier transform, the analysing function of the wavelet transform can be chosen with more freedom, without the need of using sine-forms. A wavelet function [6] ψ(t) is a small wave, which must be oscillatory in some way to discriminate between different frequencies. The wavelet contains both the analyzing shape and the window. Figure-2 shows an example of a possible wavelet, known as the Morlet wavelet. For the CWT several kind of wavelet functions are developed which all have specific properties. |
 |
| An analyzing function ψ(t)is classified as a wavelet if the following mathematical criteria are satisfied: |
| 1. A wavelet must have finite energy |
 |
| 2. If (f) is the Fourier transform of the wavelet ψ(t), the following condition must hold |
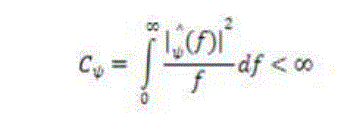 |
| This condition implies that the wavelet has no zero frequency component (ψ(t)=0), i.e. the mean of the wavelet ψ(t), must equal zero. This condition is known as the admissibility constant. The value of C depends on the chosen wavelet. |
| 3. For complex wavelets the Fourier transform ψ(t), must be both real and vanish for negative frequencies. |
| E. CONTINUOUS WAVELET TRANSFORM |
| The continuous wavelet transform is defined as |
 |
| The transformed signal Xwt(τ, s) is a function of the translation parameter τ and the scale parameter s. The mother wavelet is denoted by ψ , the * indicates that the complex conjugate is used in case of a complex wavelet. The signal energy is normalized at every scale by dividing the wavelet coefficients by 1/√|s|. This ensures that the wavelets have the same energy at every scale. |
| The mother wavelet is contracted and dilated by changing the scale parameter s. The variation in scale s changes not only the central frequency fc of the wavelet, but also the window length. Therefore the scale s is used instead of the frequency for representing the results of the wavelet analysis. The translation parameter specifies the location of the wavelet in time, by changing the wavelet can be shifted over the signal. For constant scale s and varying translation the rows of the time-scale plane are filled, varying the scale s and keeping the translation τ constant fills the columns of the time-scale plane. The elements in XWT (τ, s) are called wavelet co-efficients, each wavelet coefficient is associated to a scale (frequency) and a point in the time domain. |
DISCETE WAVELET TRANSFORM (DWT)
|
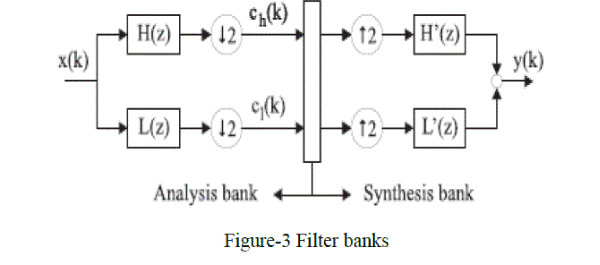
| A filter bank consists of filters which separate a signal in to frequency bands. An example of a two channel filter bank is shown in Figure-3. A discrete time signal x(k) enters the analysis bank and is filtered by the filters L(z) and H(z) which separate the frequency content of the input signal in frequency bands of equal width. The filters L(z) and H(z) are therefore respectively a low-pass and a high-pass filter. The output of the filters each contains half the frequency content, but an equal amount of samples as the input signal. The two outputs together contain the same frequency content as the input signal; however the amount of data is doubled. Therefore down sampling by a factor two, denoted by # 2, is applied to the outputs of the filters in the analysis bank. Reconstruction of the original signal is possible using the synthesis filter bank. In the synthesis bank the signals are up sampled (↓ 2) and passed through the filters L0(z) and H0(z). The filters in the synthesis bank are based on the filters in the analysis bank. The outputs of the filters in the synthesis bank are summed, leading to the reconstructed signal y(k).The different output signals of the analysis filter bank are called sub bands, the filter-bank technique is also called sub band coding. |
 |
DEVELOPED ALGORITHM ON FEATURE EXTRACTION
|
| A. WAVELET PACKETS |
| Wavelet packets have proved to be a powerful tool for signal processing. Their strength compared to other transforms is the ability to adapt to varying signal statistics. A “best” basis can be chosen from the redundant packet in order to represent the signal by as few, significant co-efficient as possible. This adaptive, sparse representation for a wide class of signals is useful for problems like signal analysis, filtering or compression. |
| WAVELET PACKET DECOMPOSITION: |
| The (continuous) wavelet transform of a 1-D signal is defined as: |
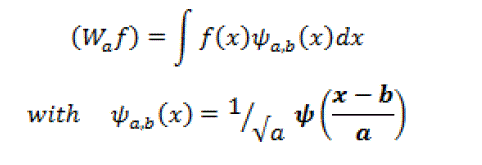 |
| The mother wavelet has to satisfy the admissibility function. Equation (3.4) can be discretized by restraining and to a discrete lattice a=2n, b ÃÂÃâ z . Typically, some more constraints are imposed on to ensure that the transform is nonredundant, complete and constitutes a multiresolution representation of the original signal. This leads to an efficient real-space implementation of the transform using quadrature mirror filters. The extension to the 2-D case is usually performed by applying a separable filter bank to the image. Typically, a low filter and a and pass filter ( H and G respectively) are used. The convolution with the low pass filter results in a so-called approximation image and the convolution with the bandpass filter in a specific direction results in so-called details images In classical wavelet decomposition, the image is split into an approximation and details images. The approximation is then split itself into a second-level approximation and details. For a n-level decomposition, the signal is decomposed in the following way: |
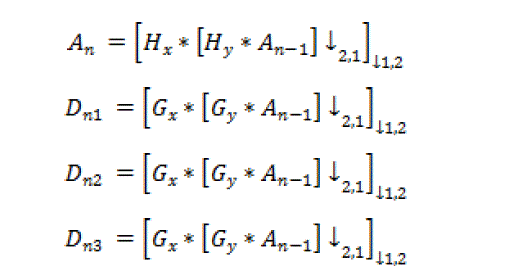 |
| Where * denotes the convolution operator, ↓2 1 ( ↓1 2)sub-sampling along the rows (columns) and A0 = I(x,y) is the original image. An is obtained by low pass filtering and is the approximation image at scale . |
| The details images Dni are obtained by band pass filtering in a specific direction and thus contain directional detail information at scale . The original image is thus represented by a set of sub images at several scales; {An, Dni}[7]. |
| The wavelet packet decomposition, that approached in our experiment, is a generalization of the classical wavelet decomposition that offers a richer signal analysis (discontinuity in higher derivatives, self-similarity). In that case, the details as well as the approximations can be split. This results in a wavelet decomposition tree. Usually, an entropybased criterion is used to select the deepest level of the tree, while keeping the meaningful information. |
| FEATURE VECTORS EXTRACTION USING WAVELET PACKETS: |
| Two levels wavelet packet decomposition is performed. At the second level of decomposition, we obtain one sub band of approximation (low-resolution image) and 15 sub bands of details. Therefore, the face image is described by 16 wavelet coefficient matrices which represent quite a huge amount of information (equal to the size of the input image). It is well-known that, as the complexity of a classifier grows rapidly with the number of dimensions of the pattern space, it is important to take decisions only on the most essential, so-called discriminatory information, which is conveyed by the extracted features. Thus, we are faced with the need of dimensionality reduction. Each of the 16 coefficient matrices contains information’s about the texture of the face. An efficient way of reducing dimensionality and characterizing textural information is to compute a set of moments. Thus, we extract 2 measures from the lowresolution image which are the mean value and the standard deviation of the face, The inside area will provide information about the face texture and the skin-tone. From the other 15 detail images, we extract the means and standard deviation (i=2,..,16). Thus, the feature vectors contain a maximum of 19 components, then the sum of product of mean and standard deviation is calculated, the feature vector is normalized, thus the normalized vector is stored as feature vector of training set. |
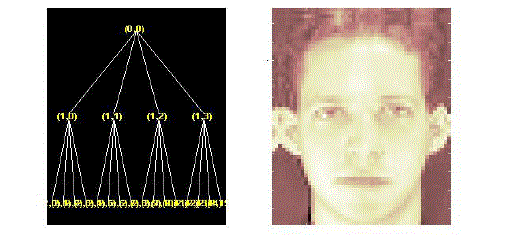 |
| Figure-4 : Wavelet packet tree and decomposed image at node (1,0) thus, the feature vectors contain a maximum of 19 components and are described as follows: |
 |
| Where μ is mean of sub-bands , σ is standard deviation of sub-bands ,here in this method 1-D mean and standard deviation is calculated instead of 2-D because the recognition rate decreases to 40-45% in 2-D mean and standard deviation hence 1-D is used. A large number of features are commonly used to describe each texture. The feature extraction by the above mentioned methods is computationally very demanding. Moreover this method have the limitation in achieving good classification rate when the textures are corrupted by noise. In order to mitigate these problems, a new approach for image texture classification using singular value decomposition with wavelet domain is presented below. |
NEIGHBOR CLASSIFICATION
|
| The classification approach used is the Nearest Neighbor (NN).The Nearest Neighbor classifier calculates the distance of the face under evaluation for all other faces (neighbors) in database. The face in question will be attributed to the person belonging to the face with the smallest distance (nearest neighbor)[13]. Theoretically, NN can be defined as follows. |
| Given the m coefficients for the person j, {y1jk, y2j ,…, ymj } and the amplitudes of the training coefficients from the person j in pose k, {w1j, w2jk ,…, wmjk } , where wijk being the coefficient of same position as yij . Consider now a test face f and its DCT coefficients’ {v1jk, v2j ,…, vmj }, with vij a coefficient in the same position as ymj The distance between a test face f and a person j in pose k, with j = 1, 2, …, p and k = 1, 2, …, q, is given by: |
 |
| So according to the above equation ,a test face f is classified as the person j when, |
 |
| The minimum degree of similarity is zero, and that value means that the face being classified is exactly the same of some of the faces in the database. A negative value does not happen because the used distance has absolute values. |
DATABASE
|
| The ORL (Olivetti Research Lab) Face Database was used in the tests. This database has 400 images (each with 112 pixels by 92 pixels), corresponding to 40 persons in ten poses each, including both males and females. All the images are taken against a dark homogeneous background, very little variation of illumination, slightly different facial expressions and details (open/closed eyes, smiling/non smiling, glasses/no glasses). |
| The 6 poses of ORL’s person number 1. |
EXPERIMENTAL RESULTS
|
 |
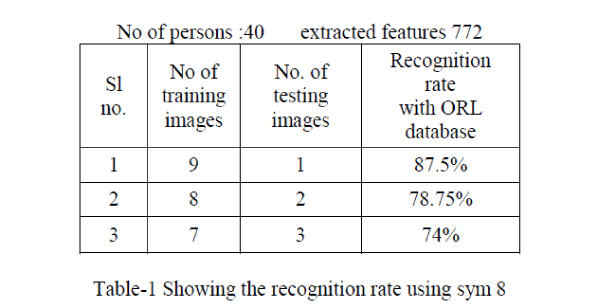
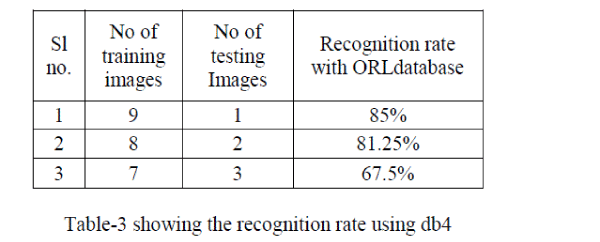
| In order to test the efficiency the algorithms,these are tested ORL database. In this experiment, for training images the feature vector is extracted using wavelet packets with different wavelet families namely db4,sym 8,bior 1.1,coif 5,then statistical measures such as mean and standard is applied and stored,similarly same method is applied to test image to extract the feature vector.the NN –classifier is used to classify test image into the correct class.The recognition rate is as shown in table below, |
 |
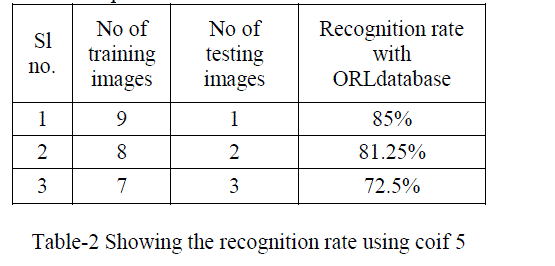 |
| No of persons :40 extracted feature 660 |
 |
CONCLUSION AND FUTURE WORK
|
| Recognition accuracy, robust method and computational costs are topics that must be taken into account when analysing a face recognition method. The proposed method is feasible as it achieves high recognition accuracy (98%) without any pre-processing step. Testing the proposed algorithm using only the ORL database is not enough to fully validate the method, but it’s important to compare the methods. Despite the fact that in literature this face database is always being referred, it does not include all variations needed for evaluating the robustness of the method. |
| The feature extraction method and the classification (NN) methods defined in this work can be improved in order to increase the recognition accuracy. Future developments to the method will focus on improving the feature extraction and classification methods. Additionally, tests must be done on the other face databases. |
References
|
- T. Ahonen, A. Hadid, and M. Pietikainen. “Face Recognition with Local Binary Patterns”. In European Conference on Computer Vision, 2004, pp. 469-481.
- Zhao, W., Chellappa, R., Phillips, P. J., Rosenfeld “ Face recognition: A literature survey”, ACM Computing Surverys (CSUR), Vol. 35, Issue 4, pp. 399-458, 2003.
- Podilchuk, C. Xiaoyu Zhang, “Face Recognition using DCT-Based Feature Vectors”, IEEE International Conference on Acoustics, Speech, and Signal Processing, 1996, vol. 4, pp. 2144-2147.
- Fabrizia M. de S. Matos, Leonardo Vidal Batista, JanKees van der Poel , “Face Recognition Using DCT Coefficients Selection” , ACM Symposium on Applied Computing (SAC), Fortaleza, Ceara, Brazil, Pages 1753-1757 , March 16-20, 2008.
- V. Perlibakas. “Distance Measures for PCA-Based Face Recognition”. Pattern recognition Letters. vol. 25, no. 6, pp. 711-724, 2004.
- D.R. Kisku, M. Tistarelli, J.K. Sing, and P. Gupta, “Face Recognition by Fusion of Local and Global Matching Scores using DS Theory: An Evaluation with Uni-Classifier and Multi-Classifier Paradigm”. Computer Vision and Pattern Recognition Workshop, 2009, pp. 60-65.
|