The detection of fast moving vehicle is an important part in Intelligent Transportation System.This paper presents a new method for detecting vehicles, which violate rules in real time traffic scenario. The main Process done in three steps: Moving vehicle detection, Number plate detection and Blur Removal. Firstly, Capture the fast moving vehicle by using novel algorithm, which convert video into image frames. Then Number plate extraction of vehicle by using several geometrical features. Finallyremoving the blur from the vehicle number plate by using blind image DE convolution. Experiment results show that this method can improve the efficiency of the moving vehicles number plate detection without blur greatly.
Keywords |
| Vehicle detection, Number plate Detection,
Noise Removing |
INTRODUCTION |
| With the rapid development of highway and the wide
use of vehicle, researchers start to pay more attention on the
efficient and accurate intelligent transportation systems
(ITS). It is widely used for detecting car’s speed, security
control in restricted areas, highway surveillance and electric
toll collection [1]. Vehicle license plate (VLP) recognition
is one of the most important requirements of an ITS.
Although any ITS and specifically any VLP recognition
contains two part in general, license plate detection and
recognition, detecting and segmenting VLP correctly is
most important because of existing conditions such as poor
illumination, vehicle motion, view- point and distance
changes. The problem of automatic VLP recognition has
been studied since 1990s. The first approach was based on
characteristics of boundaries [2,3]. In this method, an image
was binarized and then processed by certain algorithms,
such as Hough trans- form, to detect lines. In general, the
most common approaches for VLP detection include
texture [1,4], color feature [5], edge extraction [6],
combining edge and color[7], morphological operation
[5,8] and learning-based method [9]. Using color feature is
benefit when lighten- ing is unchanged and stable. However methods based on edge and texture are nearly invariant to
different illumination and so they are widely used for VLP
detection. These methods use the fact that there are many
characters in the license plate, so the area contains rich edge
and texture information. Zhang et al. [9] proposed learning
based method using AdaBoost for VLP detection. They
used both global (statistical) and local (Haar-like) features
to detect the license plate. |
| In this paper, we do pre processing for image
enhancement at first. The some regions are candidate as a
license plate during three procedures. Finallyconsidering
geometrical features, the license plate is segmented nearly
independent of image capturing conditions. |
| This paper is organized as follows: in Section 2. We
express how our image bank is provided. In Section 3, the
proposed algorithm is described and in Section 4 the
experimental results are reported. Finally, in Section 5 we
have conclusion. |
PROVIDED IMAGE BANK |
| As respects, the aim of this paper is detecting the
license plates in images with complex scenes. Due to the
unavailability of required images, in several stages by using
2 digital cameras and mobile cameras, we have provided
350 images under various illumination (lightening),
different distances and angles of stationary and moving
vehicles. After providing images, in order to increase the
processing speed and facilitate the license plate detection,
input color image is converted to gray scale image. The size
of images is 640×480 pixels. |
EFFICIENT LICENSE PLATE DETECTION |
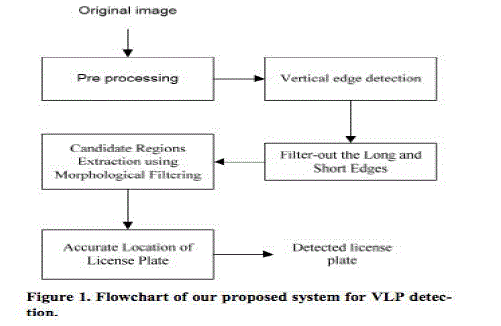
| Our, proposed method is composed of several parts,
Figure1 shows the flowchart |
A.Pre Processing |
| Low contrast may have the most important effect
on failing a license plate detection algorithm. Severe
lightening conditions, changing plate orientation and
various distances are main reasons for having low contrast and quality in the car images. Therefore, contrast enhancement
seems to be necessary, specially at locations where
might be a license plate. So, in following we improve
different images using two methods, they are intensity
variance [6] and edge density [7], and choose the best for
pre processing images. |
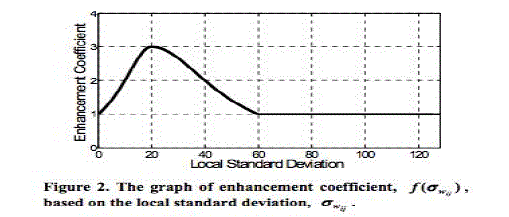
| Zheng et al. [6] used the local variance of pixel
intensi- ties to improve image contrast at regions that may
be plate. They proposed an enhancement function
whichincreases image contrast at regions that local variance
of intensity is around 20. The enhancement function was
suggested as follows: |
 |
 |
 |
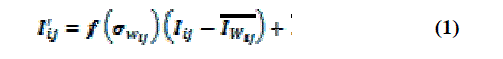
| Where , and denote the intensities of the pixel inthe
input grayscale image and enhanced image, and is a
window centered on pixels of grayscale image. and
Are average luminance and standard deviation
respectively. The enhanced coefficient is defined as
follows: |
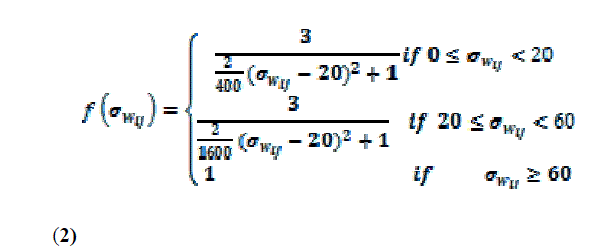 |
| With respect to Figure 2, the intensities of pixels in the
input grayscale images with local variance between 0 and
60 are enhanced. |
C. Edge Density |
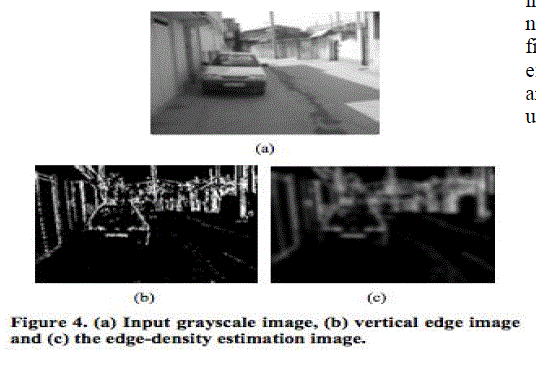
| Abolghasemi et al. [7] used the density of vertical edges
(instead of the variance of intensity) as criterion for local
enhancement of car image. License plate of the car con- sist
of several characters (8 characters for Iranian VLP), so the
license plate area contains rich edge information. We can
employ the edge information to find the location of plate in
an image. At first, they [7] used the vertical sobel mask and
obtained the gradient image. |
B.Intensity Variance |
 |
| Then, they compared pixel values with a predefined
threshold and the vertical edge image has been achieved.In
the next step, the vertical edge image is convolved with the
2-D Gaussian kernel and estimation of the edge density is
yielded. The results on a sample image are shown in Figure
4. |
| In order to enhance the input image with respect to the
estimations of edge density, an enhancement coefficient is
suggested as follows: |
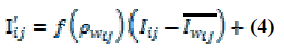 |
| where , And are explained in the previous step. f(p1)
is the weighting function, regarding theestimation
of edge density. This function is sketched in Figure 4. |
| As can be seen in Figure 5, the intensity of pixels with
the edge density among 0.15 to 0.45 is to be enhanced. The
enhancement coefficient f(p1) is defined as follows: |
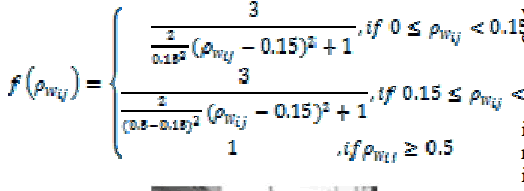 |
 |
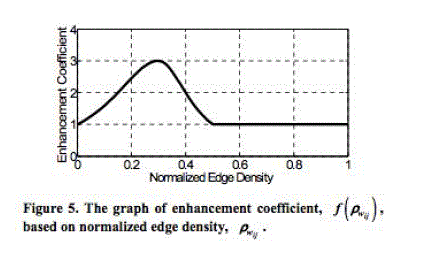 |
DETECTING THE VLP |
| After enhancing an input image by using suitable
method (edge density), we should detect any existed license
plate in the improved image. We do the following stages
for this purpose. |
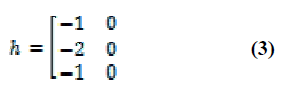
A.Vertical Edge Detection |
| Edge detection is one of the most important processes in
image analysis. An edge represents the boundary of an
object which can be used to identify the shapes and area of
the particular object. When there is contrast difference
between the object and the background, after applying edge
detection, the object edges will be illustrated. We select the vertical sobel operator, Equation (3), to detect the vertical
edges. |
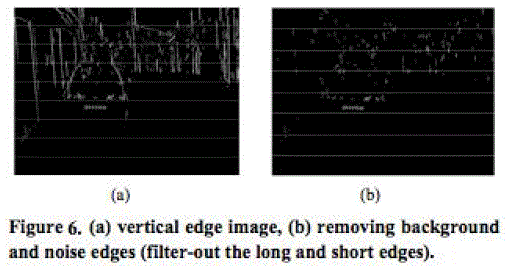
B.Filter-Out the Long and Short Edges |
| After extracting vertical edges from the enhanced
image, using morphological filtering obtains candidate
regions those may be a license plate. But, as it can be seen
in Figure 6(a), there are many long background and short
noise edges that may interference in the morphological
filtering process. In order to resolve this problem, an
effective algorithm is used to remove the background
andnoise edges [6]. The filter-out image after removing
unwanted edges is shown in the Figure 6(b). |
 |
C. Candidate Regions Extraction Using |
Morphological Filtering |
| Morphological filtering is used as a tool for extracting
image components and so representing and describing
region shapes such as boundaries. In this part, we use a
morphological operation for extracting candidate regions.
Hence, we implement the morphological closing and
opening that defined as follows: |
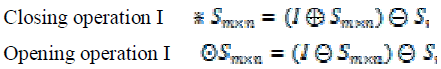 |
| Where and denote dilation and erosion operations,
respectively. S1 denote a structuring element with
size m all entries in S1 are one. The output of this
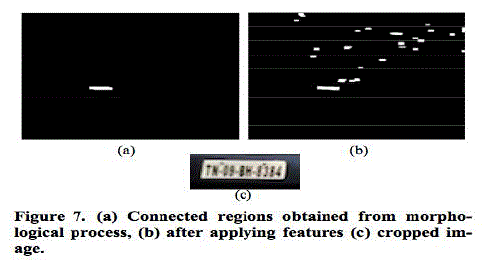
stage is shown in Figure 7(a). |
 |
D. Accurate Location of License Plate |
| After using morphological filtering, still many regionsre
candidating as a license plate. So we consider some features
such as area, aspect ratio (height per width) and edge
density in order to discard wrong candidate regions. Values
for these features are set experimentally based on our test
images. These features are scale-, luminance- and rotationvariant.
Progressive of using these features to remove nonplate
candidate regions can be seen in Figure 7(b). |
DE-BLURRING THE NUMBER PLATE |
| First, the blur kernel is estimated from the input image.
Then Estimation process is performed in a coarse-tofine
fashion in order avoids local minima. Second, using the
estimated kernel we apply a standard Deconvolution
algorithm estimate latent image.The user supplies four
inputs to the algorithm: blurred image B, a rectangular
patch within the blurred image, a upper bound on the size
of the blur kernel (in pixels), after an initial guess as to
orientation of the blur kernel. Additionally, require input
image B to have been converted to a linear color - space
before processing. In our experiments, applied inverse
gamma correction1 with γ= 2.2. In order to estimate the
expected blur kernel, we combine all the color channel of
the original image within the user specified patch to
produce a grayscale blurred patch P. |
A.Estimating the blur kernel |
| Given the a grayscale blurred patch P, we estimate K and
then latent patch image finding values with highest
probability, guided by prior on the statistics of L. Since
these statistics are based on a image gradients rather than
the intensities, perform the optimization in the gradient
domain, using and the gradients of and P.
Because convolution is linear operation, then patch gradients should be equal to the convolution the latent
gradients and the kernel: = K, plus noise. We
assume that this noise is the Gaussian with variance .As
we discussed in the previous section, the prior P( on
alatent image gradients is mixture of C zero-mean
Gaussians. We use a scarcity prior P(K) for the kernel that
encourage zero values in the kernel, and requires all entries
to be positive. Specifically, the prior on kernel values is a
mixture of D there exponential distributions.Given the
measured image gradients , we can write the posterior
distribution over the unknowns with Bayes’ Rule: |
 |
| Where I indicates over image pixels andjindicates over
blur kernel elements. So N and E denote Gaussian and
Exponential distribution respectively. For tractability, we
assume gradients in are independent of each other, as
are the elements in and K. |
B.Image Reconstruction |
| The multi-scale inference procedure outputs an estimate of
the blur kernel K, marginalized a over all possible
reconstructions. To recover the de-blurred image given this
estimate the kernel, we experimented with a variety of
non-blind, de-convolution methods, including those of
Geman [1992], Neelamani [2004] and van Cittert [Zarowin
1994]. While many of these methods perform
wellsynthetic test examples, our real image exhibits a
range of non- linearities not present in synthetic cases,
such as non-Gaussian noise, saturated pixels, residual
nonlinearities in tonescale and estimation errors in the
kernel. Disappointingly, when run our images, most
methods produced an unacceptable level of artifacts.We
also used our variation inference scheme on the gradients
of the whole image ∇B, while holding K fixed The
intensity of image then formed via Poisson reconstruction
[Weiss 2001]. Aside from being slow, the inability to
model the non-linearities mentioned above resulted in
reconstructions no better than other approaches. |
| As L typically is large, speed considerations a simple
methods attractive. Consequently, we reconstruct the latent
color image L with the Richardson-Lucy (RL) algorithm [Richardson1972; Lucy 1974]. While the RL performed
comparably to the other methods evaluated, it has the
advantage of taking only a few minutes, even on large
images (other, more complex methods, took hours or
days). RL is non-blind de-convolution algorithm that
iteratively maximizes the likelihood function of a Poisson
statistics image noise model. One benefit this over more
direct methods is that it gives only non-negative output
values. We use Mat lab’s implementation of the algorithm
to estimate L, given K, treating each color channel
independently Used10RL iterations, although for alarge
blur kernels, more will needed. Before running RL, we can
clean up K by applying a dynamic threshold, based on the
maximum intensity values within the kernel, which sets all
elements below an certain value to zero, so reducing the
kernel noise. The output of RL was by gamma corrected
using γ = 2.2 and its intensity histogram matched to that of
B (using Matlab’s histeq function), resulting in L. |
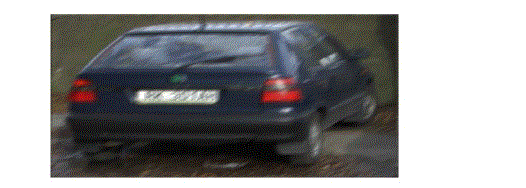
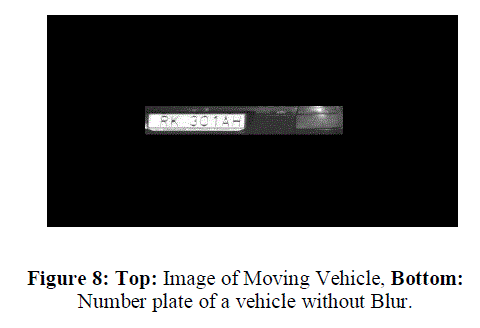
5. Expermient Results |
| To detect the effect of the proposed algorithm, we use the
following traffic video image sequences, with the size of
320*240, for testing. Fig.8 shows the detection results. |
 |
 |
CONCLUSION |
| In this paper, we have presented a new and fast vehicle
detecting system capable of robustly working under most
circumstances. The system is general enough to be capable
of detecting and classifying vehicles while requiring only
minimal scene-specific parameters, which can be obtained
through training. The exact detection of the vehicle number
plate in different scenarios makes the key part. |
References |
- APOSTOLOFF, N., AND FITZGIBBON, A. 2005. Bayesian video matting using learnt image priors. In Conf. on Computer Vision and Pattern Recognition, 407âÃâ¬Ãâ414.
- BASCLE, B., BLAKE, A., AND ZISSERMAN, A. 1996. Motion Deblurring and Super resolution from an Image Sequence. In ECCV (2), 573âÃâ¬Ãâ582.
- BEN-EZRA, M., AND NAYAR, S. K. 2004. Motion-Based Motion Deblurring.IEEETrans.on Pattern Analysis and Machine Intelligence 26, 6, 689âÃâ¬Ãâ698.
- BIGGS, D., AND ANDREWS, M. 1997. Acceleration of iterative imagerestorationalgorithms. Applied Optics 36, 8, 1766âÃâ¬Ãâ1775.
- CANON INC., 2006. What is optical image stabilizer? http://www.canon.com/bctv/faq/optis.html.
- CARON, J., NAMAZI, N., AND ROLLINS, C. 2002. Noniterative blind data restorationby use of an extracted filter function. Applied Optics 41, 32 (November), 68âÃâ¬Ãâ84.
- FIELD, D. 1994. What is the goal of sensory coding? Neural Computation 6, 559âÃâ¬Ãâ601.
- GEMAN, D., AND REYNOLDS, G. 1992. Constrained restoration and the recovery ofdiscontinuities. IEEE Trans. on Pattern Analysis and Machine Intelligence 14, 3,367âÃâ¬Ãâ383.
- GULL, S. 1998. Bayesian inductive inference and maximum entropy. In MaximumEntropy and Bayesian Methods, J. Skilling, Ed. Kluwer, 54âÃâ¬Ãâ71.
- SHAPIRO, G. GLUHCHEV AND D. DIMOV, âÃâ¬ÃÅTOWARD A MULTINATIONAL CAR LICENSE PLATE RECOGNITION SYSTEM,âÃâ¬Ã MACHINE VISION APPLICATION, VOL. 17, NO. 3, JULY 2006, PP. 173-183. DOI:10.1007/S00138-006-0023-5
|