Flaw detection is a common application of industrial ultrasonic testing. The propagation of sound waves through materials has been used to detect discontinuities within them. Sound waves reflect from flaws in a way that can produce distinguishable echo patterns. Thus the presence of flaw within materials can be determined. In addition to the flaw echo, reflections from microstructure contribute to reverberation, which interferes with the signal. Reverberation is expected to have complex interference structure. This interference pattern varies with the transmitted frequency. To take advantage of this phenomenon, a wide band signal is transmitted to effectively reduce the influence of reverberation. So it is assumed that the reflections from the flaw is insensitive to frequency and produces a steady output. This property has been utilized for flaw detection. Eliminating the unwanted reflections using conventional filtering techniques removes the flaw signal also, since both the received echo and reverberation are generated from the same transmitted signal itself and has similar spectral distributions. So, it has been proved that Split Spectrum processing algorithm followed by Order Statistic Filter can provide an optimized result. Multiple pulses will betransmitted and Order Statistic filters can be used for post processing of the received pulses. Thus, by processing the multiple echoes corresponding to a set of transmitted signals, the effect of microstructure reflections can be suppressed with respect to the flaw echo.
Keywords |
| Flaw Detection, Wide-band signal, Order Statistic Filters, Split Spectrum Processing. |
INTRODUCTION |
| Non-destructive testing is a technique to find the quality of a material or structure without doing harm to the specimen
under test. There are many non-destructive testing methods to find the deformities within materials. Of them, ultrasonic
testing is more effective, as ultrasound can penetrate more deep into the material under test. The basic principle is that
when an ultrasonic pulse is transmitted through the material, it propagates down the material and if a flaw is present,
part of the energy is reflected back due to the discontinuity in the medium. This reflected signal (echo) is received and
processed to find the presence of the flaw. The location of the flaw can be found from the time difference from the
transmitted pulse and received echo. The processing of the echo is hampered by the presence of spurious reflections
from many smaller discontinuities in the material i.e., the microstructures within a range cell, defined by a distance
cT/2, where c is the speed of sound in the medium and T is the transmitted pulse length. |
| The signal from a range cell contains the echo from the flaw as well as many random reflectors such as grains which
makes the detection of flaw difficult as both the echo and the grains will have same spectral characteristics. The echo to
grain ratio can be improved by changing the portion of the transmitter receiver transducer at different locations and
averaging the signals corresponding to different locations [13]. An alternative technique used in radar when targets are
embedded in smaller random targets known as clutter (same as grains) is a technique known as frequency diversity or
agility. This is achieved by transmitting many channels with different frequencies or by shifting the transmitted
frequency between pulses. The de-correlated received clutters signals are then averaged which results in improved
signal to clutter ratio. The use of broadband transducer and a broadband transmitted signal consisting of many narrow
band signals was introduced in [13]. The resulting echoes are subsequently averaged to get improvement in flaw to
grain echo ratio. To employ this frequency diversity concept, a wide-band signal is transmitted. |
| In this paper, a wide band signal is transmitted and the flaw enhancement will be achieved by the use ofSplit Spectrum
processing algorithm followed by the post-processing using Order Statistic Filters. In this, the received broad band signalis split into many continuous narrow bands by digital filter banks. It is based on the assumption that the super
position of many scattering points from a range cell; is frequency sensitive, meaning that the grain noise will be
different for different bands. The sub-bands are separated by more than the inverse of pulse length. The grain echoes
will, be de-correlated while the flaw echo remains constant across the bands. The correlation between the observations
can be reduced by reducing the bandwidth overlap of each channel. The de-correlation effect on the grain echoes is due
to the effect of complex interference of different frequency components of the wideband signal adding with different
phases. The filter bank is realized using DFT. |
| Analysis of the signal spectrum of reflections caused by microstructure of the material under test will show that most of
this signal energy lies within the same frequency band as the flaw (target) signal energy. So flaw detection becomes
difficult. Conventional filters (such as using a low pass, high pass, band pass filter or averaging)are not found to be
successful. Any such filter designed to eliminate the microstructure signal also eliminates the flaw signal. SSP(Split
Spectrum processing) followed by Order Statistic Filters helps in the reduction of microstructure signal while
enhancing the flaw signal visibility [5]. The popularly usedpost detection processors are the n-pulse integrator and
binary integrator [6]. n-pulse integrator is the oldest technique in post processing. It averages the return signals of the
multiple transmitted signals to reduce the noise. Binary integrator applies two thresholds, one at the input and another
at its output. It counts the number of times the return signal exceeds a threshold and the number of times the first
threshold was exceeded, is compared to another threshold for the decision purpose. The OS (Order Statistic) filter is
equivalent to the binary integrator when a threshold is applied to the output of the OS filter. |
LITERATURE SURVEY |
| In 1976 [ 9] Nihat M Bilgutay et al, developed a random flaw detection system with enhanced signal to noise ratio by
utilizing correlation and time integration techniques. The proposed system is advantageous for highly absorbent
materials and to detect smaller flaws at greater distances. The system is superior when compared to the conventional
techniques that were present at that time, like the pulse-echo flaw detectors. But the system is not efficient when clutter
noise is present, which is due to the grain structure of the material. In 1981 [10] N.M.Bilgutay et al, describes a flaw to
grain echo enhancement technique called split spectrum processing which improves the flaw to grain echo ratio in large
grained materials. The technique suppresses the grain echoes using a novel minimization and conventional averaging
algorithms. Frequency diversity concept is used here as in radar systems. The ability of order statistic filters to perform
post detection processing in various target and clutter environments, is explained [6] .The performance of two popular
post detection processors like n-pulse and binary integrators are compared. Each has its own superiority with respect to
the shapes of the target and clutter distribution functions. In 2011 [4], J. Saniie.et al, presented an FPGA based system
to perform the target detection for real time ultrasonic imaging. The use of FPGA made the Split Spectrum algorithm
flexible and robust. This enabled the evaluation of the implementation impact caused by parameter changes(such as
number of band pass filters, bandwidths, etc) in the Split spectrum processing algorithm.It is shown by Krauss and
Goebbeb as in [13] and Kennedy and Woodmansee as in [7] that the echo to grain ratio can be improved by changing
the portion of the transmitter receiver transducer at different locations and averaging the signals corresponding to
different locations. This is based on the effect of grain echo de-correlation resulting from the shift of the transducer.An
alternative technique used in radar when targets are embedded in smaller random targets known as clutter (same as
grains) is a technique known as frequency diversity or agility. This is achieved by transmitting many channels with
different frequencies or by shifting the transmitted frequency between pulses. The de-correlated received clutters
signals are then averaged which results in improved signal to clutter ratio.Krauss and Goebbeb as in [13] extended the
concept of frequency diversity and proposed the use of broadband transducer and a broadband transmitted signal
consisting of many narrow band signals. The resulting echoes are subsequently averaged to get improvement in flaw to
grain echo ratio. To employ this frequency diversity concept, a wide-band signal is transmitted. |
PROPOSED ALGORITHM |
| Split spectrum processing (SSP) utilizes the idea of frequency diversity approach by using one wideband signal and
then splitting the spectrum into separate sub-bands using a filter bank. These sub-band signals are then combined,
usually by some nonlinear operation, into a filtered signal, to get the final output. |
| The receiver uses a Split Spectrum Processing algorithm. Here, the received signal is cross correlated with the reference
signal and its spectrum is found by FFT. This spectrum is split for post-processing, refer Fig-1. In the received signal,
microstructure reflections(reverberation/clutter) and flaw reflections(echo) lie within the same frequency
band.Conventional filtering when clutter is present does not improve SCR because signal and clutter are correlated. |
| In the received signal spectrum, echo remains constant while the reverberation significantly varies due to the
interactions of the random phase and the amplitudes of the different frequencies contained in the signal. But the echo
signal from the defect will contain spectral energies over a wide frequency band. So there will be no significant
variations for the echo signal from the target. This property is exploited in the processor -SSP combined with Order
Statistic filters, to provide improved output signal to clutter ratio. |
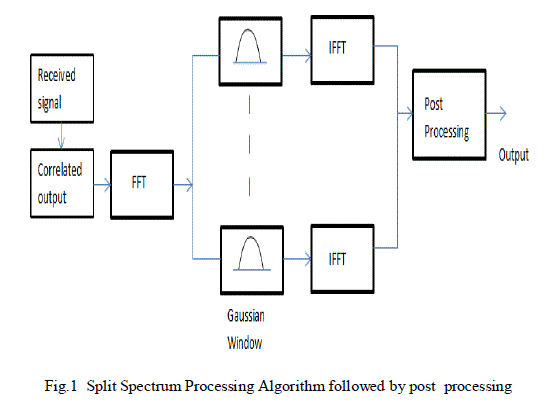 |
| SSP involves in decomposing the received wideband signal into a number of sub-bands. By splitting the spectrum, we
will be able to observe the variation of the reverberation in all sub-bands. But the target signal will not have any
variation. The target signal will have almost the same power. So some bands have large variation and some have almost
the same signal level. This property is used to enhance the target signal with respect to the reverberation.The sub-band
signals will be then processed by applying a non-linear selection technique like Order Statistic filters. This type of
filtering can retain signal information only when there is a strong correlation among most of the sub-bands at a given
time instant. The Fast Fourier Transform is used for frequency analysis of received signal. The performance of
SSPdepends upon the number of band pass filtering channels, the correlation between the different observations, and
statistical information in each channel. Increasing the number of channels increases the likelihood of separating flaw
and grain echo information. In order to enhance the visibility of flaw echo concealed by clutter, SSP method employs a
post-processor for combining all the incoming information from sub bands. This post-processor reconstructs the timedomain
signal with the objective of obtaining maximum flaw-to-clutter ratio (FCR). Several types of processors can be
used to extract the flaw echo information. Minimization technique, which comes under Order Statistics, can be
effective in suppressing the clutter echoes when flaw echo information exists in all the observation channels. |
| Steps employed for the proposed algorithm: |
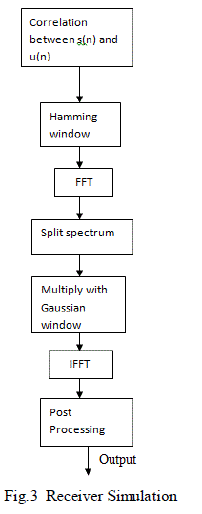
| 1. Correlation of the received signal s(n) and reference signal u(n) will be taken. |
| 2. Frequency spectrum of correlated output will be taken using FFT.FFT is proposed because it is simple and easy to
perform. |
| 3. Spectrum will be split into several narrow sub bands. Multiplying with Gaussian window can split the spectrum. |
| 5. Finally, these outputs will be fed to a post processor .This block will analyse the filter outputs for the presence of
flaw signal. Post processing can be done by calculating the threshold and comparing it with the filter outputs from each
channel. If any of the channel output exceeds the threshold value, presence of flaw can be confirmed. |
SIGNAL AND RECEIVER MODEL |
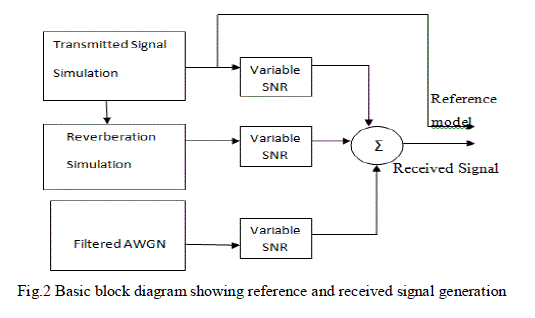
| In order to study the receiver structure and its performance, the transmitted and the received signals are modelled as
follows. Since we expect the reverberation to have complex interference structure, many frequencies need to be
contained in the transmitted signal. A wide band signal can meet this requirement. The reverberation is simulated as a
sum of reflections from individual microstructures with random phase shift and random amplitudes. The received
signal is assumed to be the sum of the delayed and attenuated transmitted signal and the reverberation isgenerated as
above. Band limited Additive White Gaussian Noise is also added.Refer Fig – 2. |
| The transmitted wide band signal is simulated as a sum of sinusoids by the time domain relation: |
 |
| The reverberation is simulated in a similar way butwith random phase shift (exponential term) and random amplitude
(for the cross section of the microstructure). The reverberation is simulated using the relation: |
 |
| The received signal s(n) is the sum of the weighted and delayed transmitted signal u(n), reverberation y(n), and
Additive White Gaussian Noise , w(n). |
| s(n)= α*u(n-ɤ) + a*y(n) +b*w(n) --- Equation 3 |
| where α, a, b are weighting functions, y(n) is the inverse Fourier transform of reverberation Y(f).Four range cells are
assumed and the target is fixed on the second range cell. |
 |
| For the simulation of receiver, refer Fig - 3, the correlation between the received signal and the target signal will be
takenin each range cell. Then the Fourier transform of the correlation output was taken. Then the spectrum was split
into consecutive bands and a Gaussian window is applied to each group of the split spectrum group and inverse Fourier
transform is taken to get the band pass filter outputs . |
| These outputs are fed to post processing. For all range cells, variance of each channel output is computed. These
outputs are squared and minimum of these values will be taken from each channel. The minimum of all the variance
values so obtained will be used to find the threshold. The threshold will be chosen such that it is twice the variance selected. This threshold so obtained will be compared with variance values obtained from each range cell to find the
presence of the flaw. For any range cell, if the variances obtained exceed the calculated threshold, presence of the
defect can be confirmed. |
 |
POST PROCESSING USING ORDER STATISTIC FILTERS |
| In signal processing, nonlinear filters like order statistic filters have enabled signal processors to enhance the corrupted
digital information. Minimization, median, and maximization processors all fall under the category of order statistic
(OS) filters that have been readily developed in the statistics field, and have found application in radar, sonar and image
processing. |
| In signal processing with respect to flaw detection, the order statistic filter is proposed which operates on a set of n
simultaneous sample values, (X1 , X2 , X3 ,…Xn ) corresponding to the n channels of the SSP (Split Spectrum
processing) output. These n values are ordered according to amplitude to produce the sequence as given below: |
 |
| A quantile is a value from a set of values that will divide the probability distribution function into equal probability
regions. OS is shown to be a biased estimator of the quantile as explained in [3]. The input signal of the OSfilter xi are
considered to be independent and identically distributed with distribution function Fx(x) , the probability density
function for the output, is given by a result in order statistics [3] as given below : |
 |
| Fx(x) is the input probability density function. ‘x’represents the real value of the observations of the input sequence and
Xr:n is the real value of ordered sequence, while X is the random variable for the input of the OSfilter and Xr:n is the
random variable for the ordered sequence of the OS filter.
Another function can be formulated as given in [6] as follows |
 |
| The distribution functions of the target and that of target plus clutter will be plotted. The order statistic filters will focus
on the quantile estimates, where a significant difference exists. For a given n samples of the signal, the OS filter has the
freedom to generate upton quantiles. Increasing the number of quantiles will help to focus on the particular regions of
the distributions more accurately. |
| Earlier, two of the popularly usedpost detection processors are the n-pulse integrator and binary integrator. n-pulse
integrator is the oldest technique in post processing. It averages the return signals of the multiple transmitted signals to
reduce the noise. Binary integrator, also called the double threshold detector, applies two thresholds, one at the input
and another at its output. It counts the number of times the return signal exceeds a threshold and the number of times
the first threshold was exceeded, is compared to another threshold for the decision. The OS filter is equivalent to the
binary integrator when a threshold is applied to the output of the OS filter. |
| The order statistics filter is shown to be a quantile estimator of the input density function that describes a specific point
on the probability distribution function. After choosing the quantile, threshold will be calculated by finding the variance
of each channel output. This threshold will be compared with outputs from all range cells and flaw can be detected if
any range cell value exceeds the threshold. |
SIMULATION STUDY |
| A wide band signal is simulated which is the transmitted ultrasound. The received echo signal is also simulated. The
receiver simulation was also done. Then correlation of transmitted and received signal was taken. Frequency spectrum
of correlated output was taken using FFT. |
| Since the target was fixed on a particular range cell, it was seen that the peak values occur at that particular range cell
in the spectrum of the correlated output signal. In the other range cells, reverberation and noise were more prominent.
Spectrum was split into 10 bands using 10 Gaussian filters. IFFT of the outputs from these sub bands was taken. It can
be seen that high SNR is obtained in the second range cell where the target is fixed, when compared to the other range
cells.The output of these 10 filters are analyzed and should be applied to the post processing block, which mainly
consists of Order Statistic Filters and thresholding, to obtain an optimized output. |
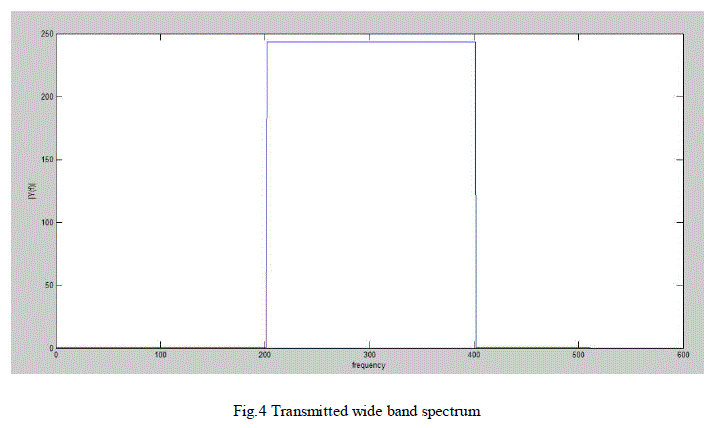 |
| The above figure shows the spectrum of the wide band signal used for transmitting. The frequencies selected are from
200 to 400 Hz. For ultrasonic testing,frequency of 500MHz will also be used. The frequencies are scaled to 1000 times
for computational simplicity. |
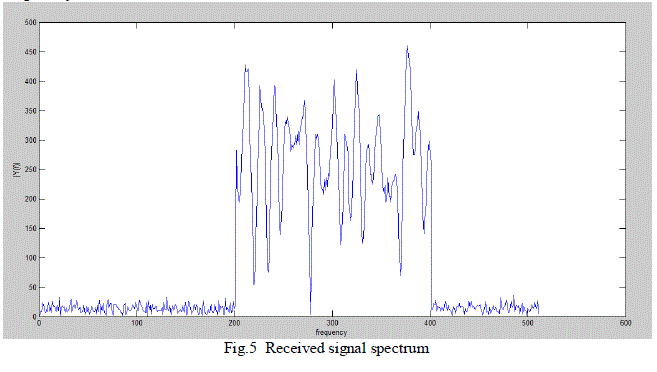 |
| The above figure shows the spectrum of the received signal. It is a combination of the transmitted signal, noise and
reverberation. Reverberation is due to the presence of the scatterers or microstructures within the material. It is
assumed that the signal from the target is the transmitted signal itself. So the received signal is the combination of the
transmitted signal, reverberation and white Gaussian noise. |
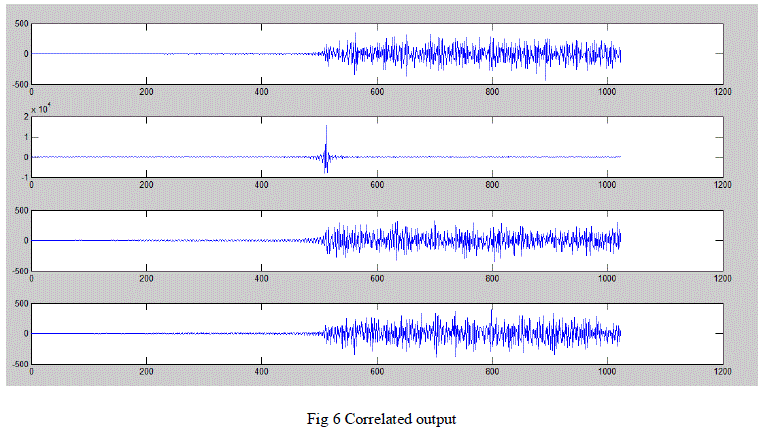 |
| The above figure shows the correlated output for the four range cells. Since the target is fixed on the second range cell,
peak value occurs in the second sub-plot. |
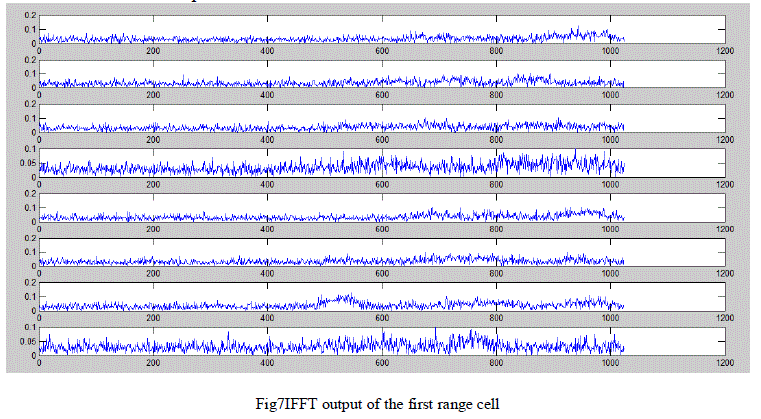 |
| The above figure shows the IFFT output of the first range cell in which there is notarget(flaw) and the input SNR
is15db .Similar graphs are obtained for the other range cells where there is no target. |
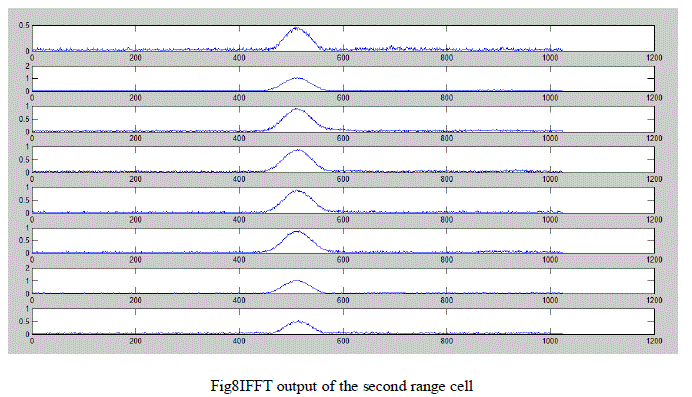 |
| The above figure shows the splitting of the second range cell in which there is target and with input SNR of 15db.
Since there is target, output SNR ishigher as compared to the range cell where there is no target. |
CONCLUSION |
| From the simulations done, it has been observed that SNR of the range cell where target is fixed, remain almost
constant while SNR values at the other range cells keep fluctuating, due to reverberation and noise. Also due to spectral
splitting improved output SNRs were obtained for different input SNRs as shown below. The approximate values are
shown in Table 1. |
 |
References |
- A.J. Al-Khalili et al., âÃâ¬ÃÅA microprocessor based flaw detection system for offshore steel structures,âÃâ¬Ã IEEE Trans. Ind. Electron., vol. IE-34, no. 2, pp. 138âÃâ¬Ãâ147, May 1987.
- Athanasios Papoulis and S UnnikrishnaPillai , "Probability, random variables and Stochastic Process"
- H. A. David, Order Statistics, New York: Wiley, 1981 , pages 1-13
- J. Saniie. et al., âÃâ¬ÃÅFPGA-Based Configurable Frequency-Diverse Ultrasonic Target-Detection System ".IEEETransactions On Industrial Electronics, Vol. 58, No. 3, March 2011.
- J. Saniie, et al., âÃâ¬ÃÅAnalysis of order statistic filters applied to ultrasonic flaw detection using split spectrum processing,âÃâ¬ÃÂIEEE Trans. Ultrason., Ferroelectr., Freq. Control, vol. 38, no. 2, pp. 133âÃâ¬Ãâ140, Mar. 1991.
- J. Saniie, et al., âÃâ¬ÃÅOrder statistic filters as postdetection processors,âÃâ¬Ã IEEE Trans. Acoust., Speech, Signal Process., vol. 38, no. 10, pp. 1722âÃâ¬Ãâ 1732, Oct.
- James C Kennedy , et al., âÃâ¬ÃÅElectronic signal processing techniques in Non-destructive TestingâÃâ¬Ã , Phase III Semi Annual Report , The Boeing Company, June 1971
- Merrill I Skolnik, Introduction to RADAR Systems. McGraw Hill, pages 30-74.
- Nihat M Bilgutay, et al., " Evaluation of Random Signal Correlation System for Ultrasonic Flaw Detection ", IEEE Trans. Sonics and Ultrasonics, vol. SU-23, no. 5, Sep. 1976
- N.M. Bilgutay et al., "Flaw Visibility Enhancement by Split Spectrum Processing Techniques" IEEE Ultrasonics Symposium, 1981
- M. Bilgutay and J. Saniie, âÃâ¬ÃÅThe effect of grain size on flaw visibility enhancement using split-spectrum processing,âÃâ¬Ã Materials Eval., vol. 42, pp. 808-814, May 1984.
- Scott E. Bailey ,Implementing Split Spectrum Processing with the TMS320C26 DSP, Digital Signal Processing Solutions, June 1997, Texas Instruments
- Ultrasonic Material Characterization: Proceedings of the First International Symposium on Ultrasonic Material Characterization held at the National Bureau of Standards at Gaithersburg Md., June 7-9, 1978.
- V. Newhouse, et al., âÃâ¬ÃÅFlaw-to-grain echo enhancement by split-spectrum processing,âÃâ¬ÃÂUltrasonics, vol. 20, no. 2, pp. 59âÃâ¬Ãâ68, Mar. 1982.
|