INTRODUCTION
|
| At certain times, it becomes a very high demand in the market because supply is limited. Business grape indeed belongs in the high-risk plants. Therefore, strategies and technical knowledge and the field became an important matter to be mastered. The systematic and structured should be developing so that it will use by operators to increase the overall production. Many farmers refused to cultivate grape in the rainy season due to the increase of grape disease to become high risk for the quality control and productivity. |
| In general, there are two types of factors which can bring death and destruction to grape plants; living (biotic) and nonliving (a biotic) agents. Living agent’s including insects, bacteria, fungi and viruses. Nonliving agents include extremes of temperature, excess moisture, poor light, insufficient nutrients, and poor soil pH and air pollutants. Diseased plants can exhibit a variety of symptoms and making diagnosis was extremely difficult. Common symptoms are includes abnormal leaf growth, colour distortion, stunted growth, shrivelled and damaged pods. Although pests & diseases can cause considerable yield losses or bring death to the plants and it’s also was directly affect to human health. However, crop losses can be minimized, and specific treatments can be tailored to combat specific pathogens if plant diseases are correctly diagnosed and identified early. These need-based treatments also translate to economic and environmental gains. |
II. LITERATURE REVIEW & RELATED WORK:
|
| Digital image processing and image analysis technology based on the advances in microelectronics and computers has many applications in biology and it circumvents the problems that are associated with traditional photography. This new tool helps to improve the images from microscopic to telescopic range and also offers a scope for their analysis. It, therefore, has many applications in biology. Zulkifli Bin Husin and Abdul Hallis Bin Abdul Aziz developed fast and accurate method in which the chilli leaf diseases are detected using colour clustering method. Here graphical user interface is used [1]. Yinmao Song, ZhihuaDiao, Yunpeng Wang, Huan Wang developed feature extraction methods of crop disease based on computer image processing technology. Based on color, texture and shape feature extraction method in three aspects features and their respective problems were introduced start from the perspective of lesion leaves [2]. Keru Wang and Shaokun Li [3] created a model of cotton leaf chlorophyll determination based on using the machine vision technology for the colour features of cotton leaf. The research showed that the BIR values of ROB colour system, the b and b\r values of chromaticity coordinate and the S values of HIS colour system were all significantly correlated with chlorophyll content of cotton leaf. These values could be used to determine the concentration of chlorophyll. |
| Libo Liu and Ouomin Zhou [4] studied the identification method of rice leaf disease according to the colour characteristics of leaf lesion area. Vane Zhang [5] used cucumber as object and studied the diagnostic method of nutritional status of greenhouse crop with the application of computer vision technology. The result showed that the green component and the colour component H of the leaves were linear correlation with the nitrogen which could be used rapid diagnosis of crop indicators under the same conditions. Chunhua Hu and Pingping Li [6] used the O/B and OIR statistics features of the ROB system to distinguish the deficiency cucumber blades, they used the features of the Ohta system to identity the colour of different cucumber leaves and extracted the H relative percentage histogram of HSV colour system to determine the pathological interval of deficiency leaves, the research achieved good results |
| P. Revathi, M. Hemalatha [7]used Image Edge detection Segmentation techniques for Cotton Leaf Spot Disease Detection. Image Edge detection Segmentation techniques in which, the captured images are processed for enrichment first. Then R, G, B colour Feature image segmentation is carried out to get target regions (disease spots). Later, image features such as boundary, shape, colour and texture are extracted for the disease spots to recognize diseases and control the pest recommendation. |
| Kim et.al, have classified the grape fruit peel diseases using colour texture features analysis. The texture features are calculated from the SGDM and the classification is done using squared distance technique. Grape fruit peel might be infected by several diseases like canker, copper burn, greasy spot, melanose and wind scar [8]. The classification accuracy achieved is 96.7Helly et.al developed a new method in which HSI transformation is applied to the input image, and then it is segmented using Fuzzy C-mean algorithm. Feature extraction stage deals with the colour, size and shape of the spot and finally classification is done using neural networks [9]. Real time specific weed discrimination technique using multilevel wavelet decomposition was proposed by Siddiqil et.al. In this histogram equalization is used for pre-processing, features are extracted from wavelet decomposition and finally classified by Euclidean distance method [10]. The classification accuracy obtained is 97% |
| Al-Bashish, Braik and Bani Ahmed developed a fast and accurate method in which the leaf diseases are detected and classified using k-means based segmentation and neural networks based classification [11]. Automatic classification of leaf diseases is done based on high resolution multispectral and stereo images [12]. Sugar beet leaves are used in this approach. Segmentation is the process that is carried out to extract the diseased region and the plant diseases are graded by calculating the quotient of disease spot and leaf areas. An optimal threshold value for segmentation can be obtained using weighted Parzen-window [13]. This reduces the computational burden and storage requirements without degrading the final segmentation results |
III. PROBLEM FORMULATION AND THE PROPOSED APPROACH
|
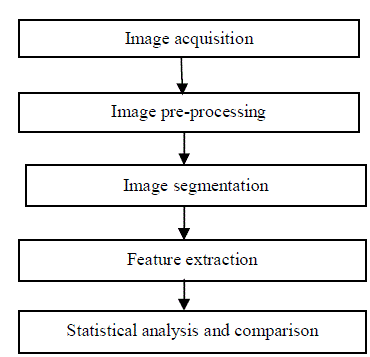
| We propose an image-processing-based solution for the automatic leaf diseases detection and classification. We test our solution on three diseases which effect on the plants; they are: Black rot, Downy mildew, powdery mildew. The overall concept for any vision related algorithm of image classification is almost the same. First, the digital images are acquired from the environment using a digital camera. Then image-processing techniques are applied to the acquired images to extract useful features that are necessary for further analysis. After that, several analytical discriminating techniques are used to classify the images according to the specific problem at hand. Figure 1 depicts the basic procedure of the proposed vision-based detection algorithm in this research. |
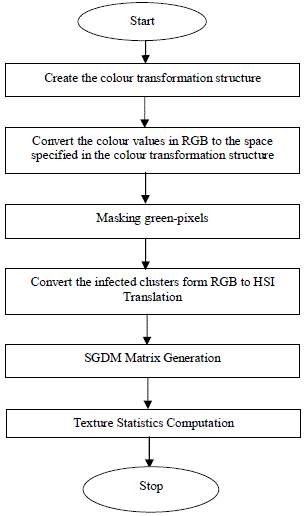
| The proposed approach step - by - step of the image segmentation and recognition processes is illustrated in Algorithm 1. In the initial step, the RGB images of all the leaf samples were picked up. Some real samples of those diseases along with normal leaf are shown in Figure 2. It is obvious from Figure 2 that leaves belonging to Black rot, downy mildew, and powdery mildew have significant differences form greasy spot leaves in terms of colourand texture. |
| However, the leaves related to these four classes (Black rot , downy mildew, powdery mildew and normal) had very small differences as discernible to the human eye, which may justify the misclassifications based on naked eye. |
A. Colour Transformation Structure:
|
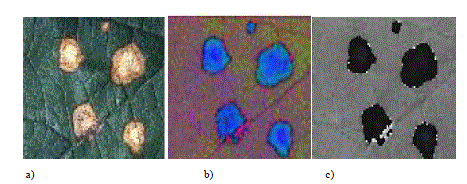
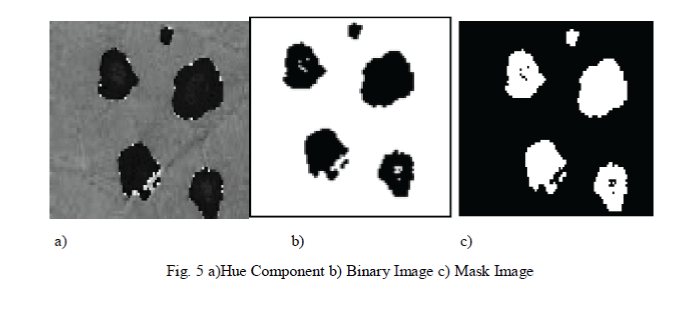
| First, the RGB images of leaves are converted into Hue Saturation Intensity (HSI) colour space representation. The purpose of the colour space is to facilitate the specification of colours in some standard, generally accepted way. HSI (hue, saturation, intensity) colour model is a popular colour model because it is based on human perception. Electromagnetic radiation in the range of wavelengths of about 400 to 700 nanometers is called visible light because the human visual system is sensitive to this range. Hue is generally related to the wavelength of a lightHue is a colour attribute that refers to the dominant colour as perceived by an observer. Saturation refers to the relative purity or the amount of white light added to hue and intensity refers to the amplitude of the light. Colour spaces can be converted from one space to another easily. After the transformation process, the H component is taken into account for further analysis. S and I are dropped since it does not give extra information. Figure 3 shows the H, S and I components. |
B. Masking green pixels:
|
| In this step, we identify the mostly green coloured pixels.After that, based on specified and varying threshold value that is computed for these pixels using Otsu'smethod , these mostly green pixels are masked as follows: if the green component of pixel intensities is less than the pre-computed threshold value, the red, green and blue components of the this pixel is assigned to a value of zero. This is done in sense that these pixels have no valuable weight to the disease identification and classification steps, and most probably those pixels represent healthy areas in the leave. Furthermore, the image processing time should become significantly reduced. In next step the pixels with zero red, green and blue values were completely removed. This phase is helpful as it gives more accurate disease classification and identification results with satisfied performance and the overall computation time should become significantly less. |
C. Segmentation:
|
| From the above steps, the infected portion of the leaf is extracted. The infected region is then segmented into a number of patches of equal size. The size of the patch is chosen in such a way that the significant information is not lost. In this approach patch size of 32 X 32 is taken. The next step is to extract the useful segments. Not all segments contain significant amount of information. So the patches which are having more than fifty percent of the information are taken into account for the further analysis. |
D. Colour co-occurrence Method:
|
| In the proposed approach, the method adopted for extracting the feature set is called the Colour Co-occurrence Method or CCM method in short. It is a method, in which both the colour and texture of an image are taken into account, to arrive at unique features, which represent that image. The image analysis technique selected for this study was the CCM method. The use of colour image features in the visible light spectrum provides additional image characteristic features over the traditional gray-scale representation The colour co-occurrence texture analysis method was developed through the use of Spatial Gray-level Dependence Matrices [SGDM] . The gray level co-occurrence methodology is a statistical way to describe shape by statistically sampling the way certain grey-levels occur in relation to other grey-levels. These matrices measure the probability that a pixel at one particular gray level will occur at a distinct distance and orientation from any pixel given that pixel has a second particular gray level. For a position operator p, we can define a matrix Pij that counts the number of times a pixel with grey level i occurs at position p from a pixel with grey-level j. The SGDMs are represented by the function P(i, j, d, ?) where i represents the gray level of the location (x, y) in the image I(x, y), and j represents the gray level of the pixel at a distance d from location (x, y) at an orientation angle of ?. Here we calculate feature set for H component only. However, we use GLCM function in Matlab to create gray-level co-occurrence matrix. |
E. Texture Features:
|
| Here we compute two texture features Cluster shade and Cluster prominence for the Hue content of the image as given in Eqns.1-2. |
 |
| From the texture features, the plant diseases are classified into various types. |
IV. EXPERIMENTAL RESULT
|
| About 100 plant leaves of different native plant species of Maharashtra have been collected for analysis. The acquired leaf images are converted into HSI format. From the hue content, the co-occurrence features like, Cluster shade and Cluster prominence are derived. The feature sets are used for analysis of disease type of particular species. Result of some plant leaves are shown below. |
| Based upon the Co-occurrence features obtained for different plant species, it is inferred that the leaves which are affected by diseases shows significant differences in their co-occurrence features we can easily categorized them. |
V. CONCLUSION
|
| Recognizing the disease is mainly the purpose of the proposed approach. Thus, the proposed Algorithm was tested on three diseases which influence on the Grape plants; they are: Black rot, Downy Mildew and Powdery mildew. The experimental results indicate that the proposed approach is a valuable approach, which can significantly support an accurate detection of leaf diseases in a little computational effort. An extension of this work will focus on developing hybrid algorithms such as genetic algorithms and NNs in order to increase the recognition rate of the final classification process underscoring the advantages of hybrid algorithms; also, we will dedicate our future works on automatically estimating the severity of the detected disease. |
Tables at a glance
|
|
|
| |
Figures at a glance
|
 |
 |
 |
 |
 |
| Figure 1 |
Figure 2 |
Figure 3 |
Figure 4 |
Figure 5 |
|
| |
References
|
- Zulkifli Bin Husin, Abdul Hallis Bin Abdul Aziz, Ali Yeon Bin MdShakaff, RohaniBinti S Mohamed Farook, ” Feasibility Study on PlantChili Disease Detection Using Image Processing Techniques” in Proceedings of IEEE International Conference on Intelligent SystemsModelling and Simulation, 2012
- Yinmao Song, ZhihuaDiao, Yunpeng Wang, Huan Wang, “Image Feature Extraction of Crop Disease”, in IEEE Symposium on Electrical& Electronics Engineering (EEESYM), 2012
- K.R Wang, S.K. Li, CT. Wang,"Acquired chlorophyll concentration of cotton leaves with technology of machine vision," ActaAgronvol.l,pp.34-40, Sin.2006
- L.P. Li, G.M. Zhou,"Research on image feature extraction of crop disease," Transactions of the CSAE, vol.2S, pp.213-217, 2009.
- Yeo Zhang, M.Z. Li,"Nutrition information extraction of the cucumber leaves in the greenhouse based on computer vision technology,"Transactions of the CSAE, vo1.21, pp.102-IOS, August 2005.
- CH. Hu, P.P. Li,"Application of computer image processing to extract color feature of nutrient deficiency leaves," ComputerMeasurement & Control, vol.9, pp.8S9-862, Dec.2004
- P. Revathi, M. Hemalatha , “Advance Computing Enrichment Evaluation of Cotton Leaf Spot Disease Detection Using Image Edgedetection” , IEEE-20180, ICCCNT'12 ,26t _28t July 2012, Coimbatore, India
- DaeGwan Kim, Thomas F. Burks, Jianwei Qin, Duke M. Bulanon, Classification of grapefruit peel diseases using color texture featureanalysis, International Journal on Agriculture and Biological Engineering, Vol:2, No:3,September 2009. Open access athttp://www.ijabe.org.
- Mohammed El.Helly, Ahmed Rafea and Salwa-El-Gammal, An Integrated image Processing System for Leaf Disease Detection andDiagnosis
- Muhammad Hameed Siddiqi1, SuziahSulaiman, Ibrahima Faye and Irshad Ahmad, A Real Time Specific Weed Discrimination SystemUsing Multi-Level Wavelet Decomposition, International Journal of Agriculture & Biology, ISSN Print: 1560–8530; ISSN Online: 1814-9596 ,0918/YHP/2009/11–5–559–565 , http://www.fspublishers.org.
- Al-Bashish, D., M. Braik and S. Bani-Ahmad, 2011. Detection and classification of leaf diseases using K-means-based segmentation andneural networks based classification. Inform. Technol. J., 10: 267-275. DOI:10.3923/itj.2011.267.275, January, 2011
- Sabine D. Bauer , FilipKorc, Wolfgang Forstner, The Potential of Automatic Methods of Classification to identify Leaf diseases fromMultispectral images, Published online: 26 January 2011,Springer Science+Business Media, LLC 2011., Precision Agric (2011) 12:361–377, DOI 10.1007/s11119-011-9217-6.
- Wang Jun, Wang Shitong, Image Thresholding Using Weighted Parzen Window Estimation. Journal of applied sciences 8(5):772-779,2008, ISSN 1812-5654, Asian Network for Scientific Information, 2008
|