Keywords
|
| Hadoop; HDFS; MapReduce; network capacity planning |
INTRODUCTION
|
| The Internet is comprehensive system which has a huge number of computer networks that are interconnected to each other. The internet makes use of the typical Internet protocol suite (TCP/IP) to connect millions of devices. Internet traffic consists of sequence of packets flowing from source computer to destination. In other words it is the flow of data across the internet. |
| Software defined network (SDN) is one of the method in computer networks which helps to govern the networks. This approach helps in managing the networks by decoupling the system that compels outcome about where the traffic is sent. |
| For the traffic analysis of the Big data first thing we need to do is collect and measure the traffic data from various sources. Big data is a tremendous collection of information which cannot be processed by traditional processing application. Big data refers to the volume variety and velocity of the data. It is not just dates, numbers, strings. It is also audio, video, 3D data, unstructured text, social media and also log files. So it is a challenging task to measure and analyse the Bigdata. Hadoop software library is a scaffold that uses simple programming techniques to process large data sets. Yu [1] tells about software named OpenSketch that is designed for measuring traffic, this software splits the data plane measurement from the control plane measurement. |
| The main idea of this paper is to design and implement a system for traffic analysis using Hadoop clusters. In this paper the system accepts the large input file, performs a detailed analysis on the input and finally it gives a statistical output on the basis of its characteristic information. |
RELATED WORK
|
| A lot of research is done to measure the performance of the internet traffic using Hadoop. Scscc J. Shafer, S. Rixner, and Alan L [2]. Cox discuss about performance of distributed Hadoop filesystem. Hadoop is most accepted framework for managing huge amount of data in distributed environment. Hadoop makes use of user-level filesystem in distributed manner. The HDFS (Hadoop Distributed File System) is a portable across both hardware and software platforms. In this paper a detailed performance analysis of HDFS was done and it displays a lot of performance issues. Initially the issue was on architectural bottleneck that exist in the Hadoop implementation which resulted in the inefficient usage of HDFS. The second limitation was based on portability limitations which limited the java implementation from using the features of naive platform. This paper tries to find solution for the bottleneck and portability problems in the HDFS. |
| T. Benson, A. Akella, and D. A. Maltz,[3] wrote a paper on “Network traffic characteristics of data centers in the wild” In this paper the researcher conduct an experiential report of the network in few data centers which belongs to different types of organizations, enterprise, and university. In spite of the great concern in developing network for data centers, only few information is known about the characteristic of network-level traffic. In this paper they gather information about the SNMP topology, its statistics and also packet level traces. They examine the packet-level and flow-level transmission properties. They observe the influence of the network traffic on the network utilization, congestion, link utilization and also packet drops. |
| A. W. Moore and K. Papagiannaki [4] give traffic classification on basis of full packet payload. In this paper a comparison was done between port-based classification and content- based classification. The data used for comparison was full payload packet traces which were collected from the internet site. The output of the comparison showed that the traffic classified based on the utilization of the well-known ports. The paper also proved that port based classification can identify 70% of the overall traffic. L. Bernaille, R. Teixeira[5] tells that port-based classification is not a reliable method to do analysis. This paper proposes a technique that depends on the observation of the first five packets of TCP connection to identify the application. |
PROPOSED SYSTEM
|
| A. Overview: |
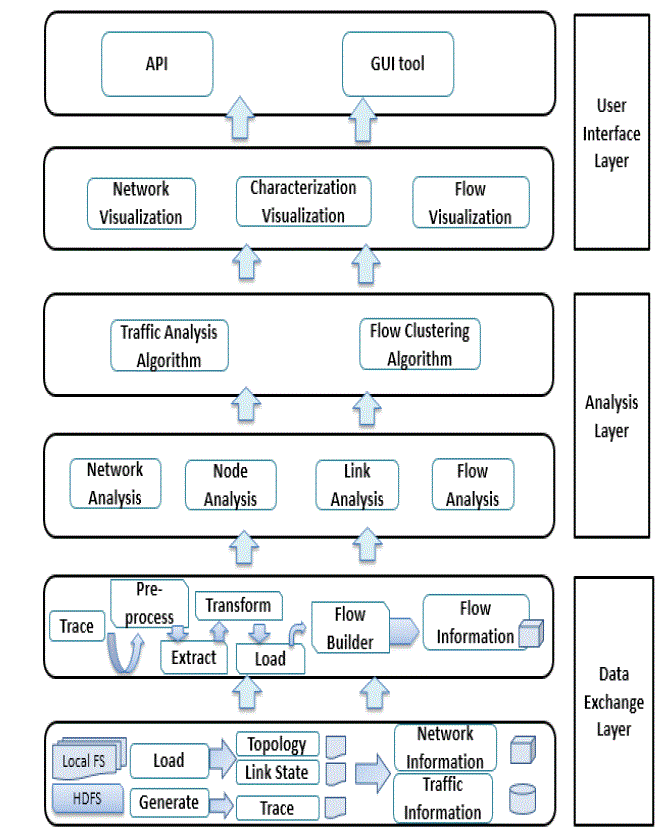
| The Key components for the Flow Analysis using Hadoop consist of three main layers which include Data Exchange layer, Analysis layer and User Interface layer [6]. Fig 1 shows the key components required for Flow Analysis. The functions of the above 3 layers are described below: |
| ? Data Exchange layer: This layer implements HDFS (Hadoop Distributed File System) to store the information related to the Internet traffic. This layer is mainly concerned about the storage and it provides support to the other layers. In this layer preprocessing of the local file system is done. Here the network information and the traffic information are extracted from the packets which are got from the network. |
| ? Analysis layer: This layer focuses of the internet traffic analysis and its management. In this layer multiple types of analysis are done. In this layer network analysis, node analysis, link analysis and flow analysis are done. Analysis layer also implements various algorithms needed for the flow analysis. |
| ? User Interface layer: In this the user can interact with the system. The system will display graphical images to the user so the user can better understand the flow analysis. This layer implements few API and GUI tools for the better communication purpose. |
B. Flow Analysis with Hadoop :
|
| Hadoop is a framework [7] of tools which is used to address the challenges faced by Big data. Hadoop consist of Distributed File system and MapReduce engine. The Distributed File system divides the large data blocks into many smaller units and MapReduce engine will process and implement each and every data blocks independently. |
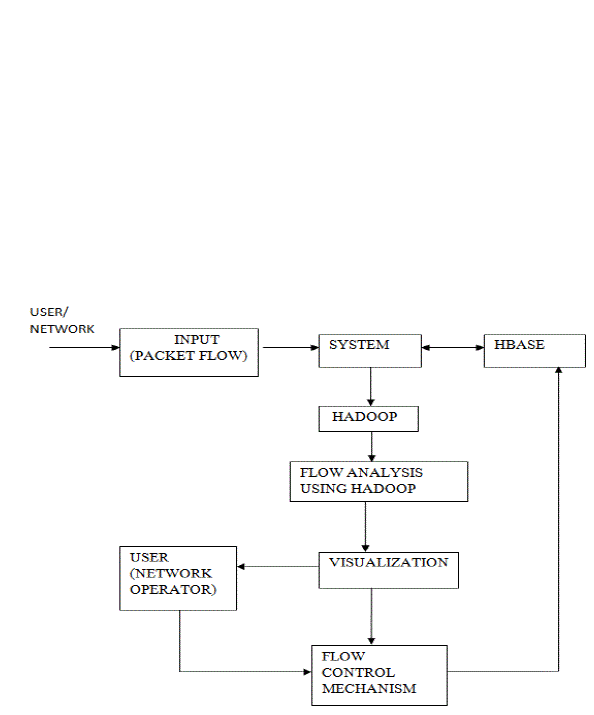
| In this system, the input is Bigdata which consist of huge amount of packets flowing from different network. The system will accept this large input of trace file from traffic measurement tool named Wireshark. This tool identifies the traffic flows running on the network. Once the input is stored in Hbase(Hadoop database) the next step is to analyse the input. Analysing the input is one of the difficult jobs. Analysis of the input is done based on the source IP address, source port address, destination IP address, destination port address, type of the packet and size of the packet. Fig 2 shows architecture of this system. |
| In the figure above we can see the flow of the packets into the system. Initially the user or the network will give the input to the system. The input is the very large amount of packets flowing from different networks. All the packet information will be stored in the Hbase. Then the system will perform HDFS and MapReduce functions on these huge amount of packets. Once the packets are sorted accordingly various flow control mechanism on the packets are done. The user can view the flow of packets statically about the flow of packets. |
| For portability across different platform like Windows, Linux, Mac OS/X, FreeBSD, components are written in Java and only require commodity hardware. Initially we begin parsing the input given from the network. The input need to be in specific format only then parsing can be done. If the input is not in format as required then sorting of the input file is necessary. Once the input file is sorted the next step is parsing each and every input line. Parsing is done on the basis of source IP address, destination IP address, source destination port address, type of the packet. The input from the same source and destination port address will be got together and input from same source IP address and destination IP will be clustered and stored in the database as unstructured data. |
| MapReduce is a function which allows the programmers to write programs to parse a huge amount of unstructured data in parallel over distributed clusters of stand-alone computers. MapReduce function will take the unstructured input from the database and parse them. This function will calculate the sum of the bytes of the data from specific port address to specific port address or from specific IP address to specific IP address. Once this is parsing is done, the next step is visualization. |
| For portability across different platform like Windows, Linux, Mac OS/X, FreeBSD, components are written in Java and only require commodity hardware. Initially we begin parsing the input given from the network. The input need to be in specific format only then parsing can be done. If the input is not in format as required then sorting of the input file is necessary. Once the input file is sorted the next step is parsing each and every input line. Parsing is done on the basis of source IP address, destination IP address, source destination port address, type of the packet. The input from the same source and destination port address will be got together and input from same source IP address and destination IP will be clustered and stored in the database as unstructured data. |
| C. Visualization: |
| The result of the parsing and MapReduce must be graphically represented for better understanding of the network. The report of the analysis of the huge data from the network is shown in multiple visualized forms. This visualized form helps the network operator to interact, analyse and manipulate data in a attentive way. The system shows the report in the form of bar graphs. The graphical representation of the traffic flow was classified into small, medium and large scale based on the size of the packets. Based on the source address, destination address, type of the packet graph is represented. |
CONCLUSION AND FUTURE WORK
|
| In this paper we have presented the work on flow analysis and flow identification on Hadoop platform. Here we provide a detailed analysis on how the packets are classified based on the address and type of the packet. This paper shows a methodology for tracing packet file and provides a detailed statistical analysis of the original trace packets and flows. In this paper we show the graphically representation of the packets entering the system. |
| The future work will show about the various problems causing the congestion in the network. It will also contain methodologies that must be implemented in order to avoid congestion in the network for the Bigdata using Hadoop technology. |
Figures at a glance
|
 |
 |
| Figure 1 |
Figure 2 |
|
References
|
- M. Yu, L. Jose, and R. Miao,” Software defined traffic measurement with opensketch,” in Proceedings 10th USENIX Symposium on Networked Systems Design and Implementation NSDI, vol, 13, 2013.
- Scscc J. Shafer, S. Rixner, and Alan L. Cox, “The Hadoop Distribution Filesystem: Balancing Portability and Performance”, in Proceedings of the 10th ACM SIGCOMM conference on Internet measurement ACM 2010.
- T. Benson, A. Akella, and D. A. Maltz, “Network traffic characteristics of data centers in the wild,” in Proceedings of the 10th ACM SIGCOMM conference on Internet measurement. ACM, 2010, pp. 267–280.
- A.W. Moore and K. Papagiannaki,” Toward the accurate identification of network applications,” in Passive and Active network Measurement. Springer, 2005, pp.41-54.
- L.Bernaille, R. Teixeira, I. Akodkenou, A. Soule, and K. Salamatian, “Traffic classification on the fly”, ACM SIGCOMM Computer Communication Review, vol 36, no.2, pp. 23-26,2006.
- YuanjunCai ,Min Luo, “Flow Identification and Characteristics Mining from Internet Traffic using Hadoop” in 978-1-4799-4383-8/14/ at IEEE 2014
- Apache Hadoop Website, http://hadoop.apache.org/
|