Research & Reviews: Journal of Engineering and Technology
ISSN: 2319-9873
ISSN: 2319-9873
Abebe Biress1,2*, Ashenafi Aregawi1
1Department of Civil Engineering, Mekelle University, Mekele, Ethiopia
2Department of Civil Engineering, Mizan Tepi University, Tepi, Ethiopia
Received: 11-May-2020, Manuscript No. JET-23-10585; Editor assigned: 14-May- 2020, Pre QC No. JET-23-10585 (PQ); Reviewed: 28-May-2020, QC No. JET-23- 10585; Revised: 22-May- 2023, Manuscript No. JET-23-10585 (R); Published: 19-June-2023, DOI: 10.4172/2319-9857.12.2.013
Citation: Biress A, et al. Identifying Hazardous Location, Predicting the Crash and Providing a Countermeasure on Rural Truck Road. 2023;12:013 .
Copyright: © 2023 Biress A, et al. This is an open-access article distributed under the terms of the Creative Commons Attribution License, which permits unrestricted use, distribution, and reproduction in any medium, provided the original author and source are credited.
Visit for more related articles at Research & Reviews: Journal of Engineering and Technology
The main aim of this thesis was evaluating the statuses of a midblock section of the rural truck road in Awi zone and recommended countermeasures at selected hazardous locations after identifying the causes of the crash. Currently, the issue of traffic safety has become the most considerable concern throughout the world. Especially, the issues that have done the dynamic growth of traffic crash day today, Geometric and traffic control features and traffic volume effect main input variables in the Empirical Bayes method used affect the developing countries including Ethiopia. According to the Awi zone police commission report, road traffic crashes in the study area (20016-2018), 212 crashes observed. The study uses empirical Bayes method to identify hazardous locations on the midblock section of the road. The method also includes safety performance function at base condition and site condition approved in HSM and these methods presented mid-block section of the road. In addition to that, the result shows among the segmented 123 parts of the road 32-road segments identified as hazardous locations. This identification of hazard locations indicates that these sections need urgent attention to diagnose, prioritize, evaluate and give effective solutions to reduce road traffic crash and increase the safety performance of the road. Possible solutions have used trafficcontrolling devices, modification of geometric design parameters.
Countermeasure; Empirical Bayes estimate; Excess; Hazardous road segments; Safety performance function
Road traffic crash death and injures observed in the world, it was estimated that over 1.3 million people died each year on the world road because of the road traffic crash. According to studies by WHO more than 3,200 people are killed and over 130,000 injured in traffic, crash every day around the world. The vulnerable road users’ means pedestrians, cyclists and motorcyclists mostly affected by this problem. The trends of road traffic crashes become increasing in the last decades that is why the researchers to think of this problem and find possible causes and precautionary measures to prevent road traffic crashes from happening. Roadway, traffic control devices and roadside features of the highway mainly affected by human, vehicular and environmental factors. The other factor that affects the safety of the highway was the geometric design features of the roads and associated features, which have a noticeable effect on the road traffic crash. These inquiries have led to study road traffic crash related to geometric design features and other criteria of the road which are mandatory to study the safety of the highway. This paper combines so many road traffic crash data, geometric design feature data, and volume data of traffic, traffic control device data and previous research by different researchers[1].
In developed and developing countries the losses of resources and economy affected by road traffic crash, due to that, they are considered as the main criterion for road safety. The three basic aspects of transport humans, roads and vehicles, were the primary factors in the crash. The human factor seems to be the dominant cause of crash compared to the others. However, the number of crashes can be seriously reduced if the road design factor has evaluated better and highway design has made correctly. When considering the population figures, developing countries in Sub-Saharan Africa have the highest frequency of various crashes worldwide.
Much of the research on highway safety has focused on different factors, which affect roadway safety. The factors have categorized as traffic characteristics, road geometrics, road surface condition, weather, and human factors. Previous research has shown that geometric design inconsistencies, operations (traffic mix, volume, and speed), environment and driver behavior were the common causes of the crash. Most of the studies have shown the influence of various geometric design variables, traffic volume, and traffic control devices selectively on the occurrence of crashes and have concluded that not all variables have the same level of influence in all places[2].
In Africa over 80% of goods and people were transported by roads, while in Ethiopia road transport accounts for over 90% of all the inter-urban freight and passenger movements in the country. Road traffic crashes pose a significant weight in Ethiopia, as was the case for other developing countries because Ethiopia was one of the developing countries in the world and road has the major transport system. Recently, Ethiopia has become one of the fastest growing non-oil producing economies in the world.
Thus, studying and analyzing crashes data on selected roads was the starting point to determine hazardous location, predict the road traffic crash, to identify the causes of crashes on the identified hazard location and to provide the countermeasures. Empirical Bayes method was the method used in this paper to identify the relation between the contributing factor and the road traffic crash, the contributing factors specifically related to the main inputs of the Empirical Bayes model.
According to a report by Awi zone traffic police in the year 2016-2018 G.C, 313 total number of a road traffic crash, there were 201 traffic crash fatalities, 50 serious injuries 30 slight injuries and 69 property damage with the estimated property damage about 10955256 birrs. With the expected considerable under-reporting, the road traffic crash hazard was believed to be much higher than indicated by such statistics. The report of road traffic crash shows the occurrence of crash frequency in the study area was high from the other district. The study covers the main road Addis to Bahirdar pass the four districts (Tilili, Kosober, and Dangla) and in the other direction, it passes through Chagni[3]. The total length of the road is about 120 km.
Though the above researches focused on the analyze of traffic crash, related to geometric design, this study will focus on identification of hazardous locations, predicting the current states of crash by the selected characters only, major cause for crash and depending on-site observation, model output, HSM select countermeasures; it could help to reduce road traffic crash in number and severity level.
Thus, RTC is a problem in Ethiopia and specifically in Tilili, kosober, dangla and Chagni road which has long been affected the people and damage huge amounts of property threatening the socio-economic impact on the surrounding area and country Ethiopia. With this research, we set out to assess the RTC spatially and temporally considering its relevance to planners, policymakers, stakeholders and the community at large. This research will thus be the first of its kind for asphalt road from Tilili, Kosober, Dangla, and Chagni.
Therefore; the research would be using different engineering techniques, models and design criteria’s to ensure the geometric design and construction, traffic control devices and reliable for the future generation.
A model incorporated in the study includes safety performance function, the modified and calibrated form of safety performance function and lastly, the empirical Bayes adjusted model was used. During the applicability of thus models, roads classified into intersections and non-intersections, because of the applicability of the model, and was different for each of the road systems in the analysis and implementation of the countermeasure.
The major aim of this thesis was predicting and estimating the crash by using the empirical Bayes method that will be used to identify the hazardous location using the geometric features, traffic control features and volume of traffic in rural main roads of the Awi zone. In addition, it aims to identify the contributing factors and develop the most appropriate countermeasures of the hazardous locations, that occur due to the inappropriateness of geometric and traffic control features of the road[4].
Hence, the study was primarily, executed for the identification of hazardous locations due to the cumulative effect of geometric features of the rural main road, which have a 102 km length in rural, area of the site.
The entire methodology that was adapted for accomplishing the objective of the research was based on data collection, analysis of collected data, identification of the hazardous location, site investigate the identification of the most affecting geometric features of the road segment. Elimination of non-significant factors, then by using empirical Bays model evaluating each of the road parts and providing the countermeasures (Figure 1).

Figure 1: The methodology of the research.
Study area
The research area Awi zone is one of the Amhara region zones existing near to the region as shown in the map below. This zone is having eleven woredas and the research site includes five woredas only due to the specification of the objective, which means the objective includes the rural truck road of the area and the rural truck roads that exist in this location (Figure 2)[5].

Figure 2: Research area.
Road segment selection criteria: It is a rational means to divide the road into intersections and road segments based on traffic safety management because the problems and the treatments are different for intersections and road segments. The main reasons for the selection of segment were:
• The availability of better crash database at the respective police stations compared to intersection part of the road.
• The potential openness of the segment road networks to the occurrences of the frequent number of a crash.
• Due to its large coverage of the road segment in the research area.
Road segment description: Generally, the selected road segment is located in the Awi zone rural truck roads only under the administration of five woredas by considering the town of the zone as a center of road direction/distribution and three destinations of the road (Table 1).
| Street name | Street classification as per ERA | Total length (Km) |
|---|---|---|
| Kosober to Burie | Truck | 20.529 |
| Kosober to Dangla | Truck | 39.777 |
| Kosobe to Chagni | Truck | 42.114 |
| Total | Truck | 102.42 |
Table 1. The study of the road network.
The analysis of intersection should include all crashes that occur within the specified radius of 250 ft from the center of the intersection. Driveway crash occurring within 250 ft or 76 meter from the center of the intersection should be included in the count of intersection crashes. Figure 3 illustrates the influence zone of an intersection.

Figure 3: Influence zone of an intersection.
Different road features were there in the selected road segment. Where road layout comprises straight road section, horizontal and vertical curves while geometric features encompass various types and sizes of median width, shoulder, Uturn, lane width, lane number.
Road segment classification
Generally, the division of the road segment in different ways that was depending on the specified length and the shorter the road segments the more applicable for the application of analysis means for the reliability of the prediction model (Table 2).
| Network ID | Road section | Total length (km) | Study length (km) | The segment length (m) |
No of a divided segment | No. of excluded intersection |
No grouped segments |
|---|---|---|---|---|---|---|---|
| KT | Kosober to Tilili | 20.53 | 20 | 0.1-1.5 | 76 | 5 | 27 |
| KD | Kosober to Dangla | 39.78 | 40 | 0.1-1.5 | 132 | 4 | 49 |
| KC | Kosober to Chagni | 42.11 | 42 | 0.1-1.5 | 140 | 1 | 47 |
| Total | 102.4 | 102 | 348 | 10 | 123 |
Table 2. The overall description of the road segment.
The classified road segments of each road existed in the appendix part according to this table and description.
Data collection
Previous research studies were reviewed to attend the stated objectives of the research. The provided literature gives institutions to the ways of data collection, problems encountered and means of solving it and the background knowledge about road safety becomes sufficient, gives solutions after identifying the problems. The knowledge and experiences gained in the literature review helped the writer of this paper, identifying the efficient, effective and most appropriate method of study approach on stated goals. During the fieldwork of data collection, different types of data gathered thus were road traffic crash data, traffic volume data, road geometric data, traffic controlling data, road side data[6].
Crash data’s
The data of road traffic crash were collected from different responsible bodies like woredas and zonal police commissions in this case five woredas, and one zone was the source of data. According to the analysis of crash statistics guide by permit writers workshop (2002), crash data for the most recent one up to two year was normally used and generally sufficient for the interpretation of the sites. The study by other researchers also frequently used. The three year statistical data and from one year to five year was used to identify the hazard location of the road segment[7].
Traffic volume
Traffic volume data are the most important factors in the analysis of the road, which means, it is the base to calculate the different design criteria like AADT. The number of studies indicates that the influence of traffic volume. In this research, the AADT was used in predicting and estimating a crash, identification of hazardous locations and the data were taken from Ethiopian roads authority and the data collected by the manual method of collection in seven consecutive days of the week including the night. The collected data were as shown in the Table 3.
| Date | Car | L/Rover | S/Bus | L/Bus | S/Truck | M/Truck | H/Truck | T/Truck | Total | NEF |
|---|---|---|---|---|---|---|---|---|---|---|
| 01/11/2016 | 24 | 182 | 415 | 112 | 194 | 147 | 165 | 93 | 1332 | |
| 02/11/2016 | 26 | 246 | 459 | 100 | 231 | 188 | 219 | 114 | 1583 | |
| 03/11/2016 | 31 | 285 | 463 | 113 | 279 | 183 | 201 | 100 | 1655 | |
| 04/11/2016 | 6 | 141 | 441 | 41 | 154 | 45 | 175 | 175 | 1071 | |
| 05/11/2016 | 23 | 234 | 446 | 124 | 245 | 207 | 219 | 219 | 1590 | |
| 06/11/2016 | 20 | 173 | 413 | 130 | 206 | 150 | 176 | 176 | 1379 | |
| 07/11/2016 | 22 | 153 | 511 | 150 | 317 | 208 | 183 | 183 | 1653 | |
| 152 | 1414 | 3148 | 770 | 1626 | 1128 | 1338 | 687 | 1026 | ||
| 01/11/2016 | 0 | 28 | 99 | 8 | 7 | 28 | 26 | 26 | 214 | 1.160660661 |
| 3/11/2016 | 1 | 35 | 67 | 19 | 16 | 44 | 46 | 31 | 259 | 1.156495468 |
| Total | 153 | 1477 | 3314 | 797 | 1649 | 1200 | 1410 | 736 | 10736 | |
| cars/trucks | 5484 | 4779 | ||||||||
| NEF Average | 1.158578064 | |||||||||
| ADT | 1698.640954 | |||||||||
| MEF | 1.185 | |||||||||
| AADT | 2012.88953 | |||||||||
Table 3. Roadvehicle countsummary sheet (01-07/11/2016).
The data collected in the place of recommended, that means, The road sections have expected to be similar geometric characteristics and not near to junction. The Location should be horizontal and geometrically straight. Section of the road to have uninterrupted traffic flow. According to ERA during traffic count, the vehicle classifications have standards to count in the road count as shown in Table 4[8].
| Vehicle code | Types of vehicles | Descriptions |
|---|---|---|
| 1 | Small cars | Passenger Cars, Minibuses (up to 24-passenger seats), Taxis, Pick-ups, and Land Cruisers, Land Rovers, etc. |
| 2 | Buses | Medium and large size buses above 24 passenger seats |
| 3 | Medium trucks | Small and Medium-sized Trucks including tankers up to 7 tons load |
| 4 | Heavy trucks | Above 7 tons load 5 articulated trucks with trailer or semi-trailer and Tanker trailers |
Table 4. ERA standard vehicle classification.
Geometric feature data’s
Geometric feature data were frequently, caused by a traffic crash as stated in the literature part. In addition to that, these data were used in the crash prediction model analysis. Many studies as stated by different scholars and books. Thus on the account of literature reviews, subjective engineering judgment, geometric features of the selected road network were presumed to be the prevalent traffic crash causative factors. By using the checklist prepared, the characteristics of each parameter listed were collected individually in the segment by excluding the intersections and its effect as stated in the above part of the discussion. Thus, indicating the most affecting variables in road traffic crash according to the above- stated reasons and HSM approves this way of analysis[9].
Crash Modification Factor (CMF)
The CMFs for geometric design and traffic control features of rural two-lane two- way roadway segments were presented below. These factors used to account for the variation between the base condition and the local site conditions. In case there are 11, CMF applied in these modification processes.
Lane width (CMF1r): The CMF for lane width on two-lane highway segments is presented in tables and illustrated by the graph. The base value for the lane width CMF is 12-ft. In other words, the roadway segment SPF will predict the safety performance of a roadway segment with 12-ft lanes.. This accomplished using the following equation.

Where,
CMF1r=Crash Modification Factor. CMFra=crash Modification Factor for the effect of lane width on related crash (i.e., single-vehicle run-off-the-road and multiple-vehicle head-on, opposite-direction sideswipe, and same-direction sideswipe crashes).The Crash Modification Factor for lane width shown in Exhibit 10-14 HSM; pra=proportion of total crash constituted by a related crash. The proportion of related crash is estimated as 0.574 (i.e., 57.4%) based on the default distribution of crash types presented in Exhibit 10-7 HSM (Table 5).
| AADT (veh/day) | |||
|---|---|---|---|
| Lane width | <400 | 400 to 2000 | >2000 |
| 9-ft or less | 1.05 | 1.05+2.81 × 10¹⁴ (AADT-400) | 1.5 |
| 10-ft | 1.02 | 1.02+1.75 × 10⁻⁴ (AADT-400) | 1.3 |
| 11-ft | 1.01 | 1.01+2.5 × 10⁵ (AADT-400) | 1.05 |
Table 5. Lane width CMF on the roadway segment (CMF1r).
The measured lengths of lane width on the field also recommended by the HSM to round the values and the measurement was applied in each of the road segments as shown in the Table 6.
| Measured lane width | Rounded lane width |
|---|---|
| 9.2 ft or less | 9 ft or less |
| 9.3 ft to 9.7 ft | 9.5 ft |
| 9.8 ft to 10.2 ft | 10 ft |
| 10.3 ft to 10.7 ft | 10.5 ft |
| 10.8 ft to 11.2 ft | 11 ft |
| 11.3 ft to 11.7 ft | 11.5 ft |
| 11.8 ft or more | 12 ft or more |
Table 6. Recommended rounded lane width.
Shoulder width and type (CMF2r): The CMF for shoulders has CMF for shoulder width (CMFwra) and a CMF for shoulder type (CMFtra). The base value of shoulder width and type is a 6-foot paved shoulder, which is assigned a CMF value of 1.00. CMFra for shoulder width on two-lane highway segments is determined from Exhibit 10-16 HSM based on the applicable shoulder width and traffic volume range. Shoulders over 8 ft wide are assigned CMFra equal to that for 8 ft. shoulders[10].
| AADT (vehicles per day) | |||
|---|---|---|---|
| Shoulder width | <400 | 400 to 2000 | >2000 |
| 0 ft | 1.1 | 1.10+2.5 × 10⁻⁴ (AADT-400) | 1.5 |
| 2 ft | 1.07 | 1.07+4.3 × 10⁻⁴ (ADDT-400 | 1.3 |
| 4 ft | 1.02 | 1.02+8.125 × 10⁻⁵ (ADDT-400) | 1.15 |
| 6 ft | 1 | 1 | 1 |
| 8 ft or more | 0.98 | 0.98+6.875 x 10⁻⁵ (ADDT - 400) | 0.87 |
Table 7. CMF shoulder width on the roadway segment.
The CMFs values to shoulder also applied to the common types of crashes in two-way two-lane rural roads.

Where, CMF2r=Crash Modification Factor
| Shoulder type | Shoulder width | ||||||
|---|---|---|---|---|---|---|---|
| 0 | 1 | 2 | 3 | 4 | 6 | 8 | |
| Paved | 1 | 1 | 1 | 1 | 1 | 1 | 1 |
| Gravel | 1 | 1 | 1.01 | 1.01 | 1.01 | 1.02 | 1.02 |
| Composite | 1 | 1.01 | 1.02 | 1.02 | 1.03 | 1.04 | 1.06 |
| Turf | 1 | 1.01 | 1.03 | 1.04 | 1.05 | 1.08 | 1.11 |
Table 8. CMF for shoulder type along the road segment.
During the measurement of shoulder width, the researcher tries to follow the following recommended rounding systems as indicated by HSM before determining the homogenous road segment as indicated.
| Measured shoulder width | Rounded width |
|---|---|
| 0.5 ft or less | 0 ft |
| 0.6 ft to 1.5 ft | 1 ft |
| 1.6 ft to 2.5 ft | 2 ft |
| 2.6 ft to 3.5 ft | 3 ft |
| 3.6 ft to 4.5 ft | 4 ft |
| 4.6 ft to 5.5 ft | 5 ft |
| 5.6 ft to 6.5 ft | 6 ft |
| 6.6 ft to 7.5 ft | 7 ft |
| 7.6 ft or more | 8 ft or more |
Table 9. Shoulder width-rounding intervals.
CMF3r horizontal curves: Length and radius: The base condition for horizontal alignment is a tangent roadway segment. A CMF has been developed to represent the manner in which crash experience on curved alignments differs from that of tangents. This CMF applies to the total roadway segment crash. The CMF for horizontal curvature has in the form of an equation and yields a factor similar to the other CMFs in this chapter. The CMF for length, radius, and presence or absence of spiral transitions on horizontal curves is determined using the following equation.
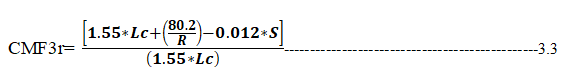
Where, CMF3r=Crash Modification Factor for the effect of horizontal alignment on the total crash
Lc=length of a horizontal curve (miles)
R=Radius of curvature (feet)
In this case, Lc represents the length of the entire horizontal curve, including portions of the horizontal curve that may lie outside the roadway segment of interest[11].
CMF4r–grades: The base condition for a grade is a generally level roadway. Exhibit 10-19 HSM presents the CMF for grades based on an analysis of rural two-lane two-way highway grades. The sign of the grade is irrelevant because each grade on a rural two-lane two-way highway is an upgrade for one direction of travel and a downgrade for the other and the grades generally classified into three main trains as shown in the table below. The CMFs in exhibit apply to total roadway segment crashes as shown in the following table.
| Approximate grade(%) | ||
|---|---|---|
| Level Grade (≤ 3%) | Moderate terrain (3%<grade ≤ 6%) | Steep terrain (>6%) |
| 1 | 1.1 | 1.16 |
Table 10. CMF for grade along the roadway segment.
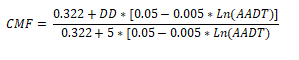
CMF5r-Driveway Density (DD): The base condition for driveway density is five driveways per mile. As with the other CMFs, the model for the base condition was established for roadways with this driveway density. The CMF for driveway density is determined by the following mathematical formula.
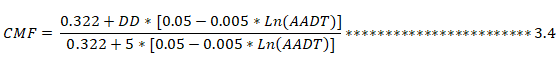
Where, CMF6r=Crash Modification Factor for the effect of driveway density on total crash
AADT=Average Annual Daily Traffic volume of the roadway being evaluated (vehicles per day)
DD=Driveway Density considering driveways on both sides of the highway (driveways/mile)
CMF6r-centerline rumble strips: Centerline rumble strips are installed on undivided highways along the centerline of the roadway, which divides opposing directions of traffic flow. Centerline rumble strips are incorporated in the roadway surface to alert drivers who unintentionally cross, or begin to cross, the roadway centerline. The base condition for centerline rumble strips is the absence of rumble strips.
CMF7r-passing lanes: The base condition for passing lanes is the absence of a lane (i.e., the normal two-lane crosssection). The CMF for a conventional passing or climbing lane added in one direction of travel on a rural two-lane two-way highway is 0.75 for a total crash in both directions of travel over the length of the passing lane from the upstream end of the lane addition taper to the downstream end of the lane drop tape[12].
CMF8r-Two-Way Left-Turn Lanes (TWLTL): The installation of a center Two-Way Left-Turn Lane (TWLTL) on a rural truck two-lane two-way highway to create a three-lane cross-section can reduce crashes related to turning maneuvers at driveways. The CMF for installation of a TWLTL is:
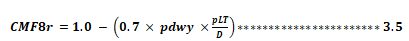
Where, CMF8r=Crash Modification Factor for the effect of two-way left-turn lanes on total crash
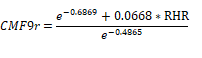
CMF9r-roadside design: For purposes of the HSM predictive method, the level of roadside design is represented by the roadside hazard rating (1-7 scale). The CMF for the roadside design was developed as stated in the HSM. The base value of roadside hazard rating for roadway segments is three. The CMF is=1.
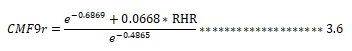
Where, CMF8r=Crash Modification Factor for the effect of roadside design
RHR=roadside hazard rating
CMF10r lighting: The base condition for lighting is the absence of roadway segment lighting. The CMF for lighted roadway segments is determined, based on the following equation.

Where, CMF10r=crash Modification Factor for the effect of lighting on total crashes pinr=proportion of total nighttime crash for unlighted roadway segments that involve a fatality or injury
Ppnr=proportion of total nighttime crash for unlighted roadway segments that involve property damage only
Pnr=proportion of total crashes for unlighted roadway segments that occur at night. This CMF applies to total roadway segment crashes
CMF11r-automated speed enforcement: Automated speed enforcement systems use video or photographic identification in conjunction with radar or lasers to detect speeding drivers. These systems automatically record vehicle identification information without the need for police officers at the scene.
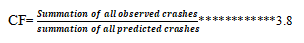
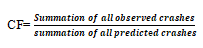
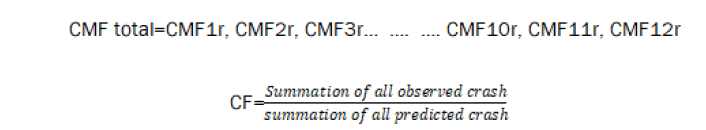
Crash Calibrating Factors (CF)
Calibrating factors of crash provide a method to account for differences between jurisdictions in factors. Thus includes Climate, driver population, animal population, crash recording variations, and crash reporting system procedures. Mathematically it is calculated as follows.
In this case, there are three different types of calibration factors as shown below.
1. Calibration factors along the road segment Kosober to Tilili.
2. Calibration factors along Kosober to Chagni.
3. Calibration factors along Kosober to Dangla.
Methods of analysis
In this part, we see different analysis methods and different models are used to predict the road traffic crash, identify the hazardous locations, prioritization of the selected hazard locations. The methods include the two-safety performance method that is the base model and the modified model. Empirical Bayes methods use as shown below in consecutive part in detail.
Base model calibration (modification): The base model calibration or modification means the changing of the models from the developed site geometry and local condition to our site geometry and local condition. The CMF total was used in the modification process.
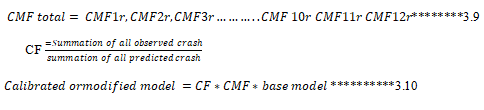
Where CF=Calibration Factor, CMF=Crash Modification Factor
Estimating the crash: Based on the four steps EB-safety estimation procedure was performed in the identification of a hazardous location of the road part and in this case the non-intersection part of the road[13]. The four steps include:
• Predicting the crash in the site condition that was a base condition with CMF and CF
• Annual correction factors in each of the study year (used to know the yearly variation of traffic, climate and vehicle mix).
• Relative weight this was also used Overdispersion and predicted crashes as stated in the methodology part and analysis of the model.
• Lastly, BE-adjusted expected average crash frequencies outputs were determined.
A Predicted number of crashes determined by modified or calibrated models to the local conditions as indicated in the following formula.

CF=Calibration Factor to the local condition
SPF=Safety Performance Function
AADT=Annual Average Daily Traffic
L=length of the road segment CMF=Crash Modification Factor
Dangerous road segments identification and ranking: Dangerous road segments selected according to their inconformability service to the user that means based on the selected performance measure, which is used to identify the hazardous locations. The excess values negative or positive, the positive value means the road segment is hazardous and the excess value negative indicates the road segment not hazardous.

Prioritizing the hazardous locations based on the excess value: In this research the ordered or ranked road segments have been further grouped for different purposes like that of remedial measures, to know the percentage of each group result on the road traffic crash, to know individual segments effect on the crash, etc. In this case, especially, the countermeasure was the main target for the allocation of the limited budget for the most hazardous segments. To facilitate this grouping process two average excess values have been estimated and this average excess values split the ranked 32 hazard segments into three parts of the segment as shown below.
Firstly, the average values of all the hazardous segments of the road that is =Σnk=1 excess/n value of 32 road sites was estimated and those road sites exhibit greater than or equals to this average value calculated in the above formula grouped together in our case the numbers equivalent to eleven. Second by excluding, the selected first groups calculate in a similar way to the first one and the segments greater than or equal to the average values of excess also grouped as group two of the hazard location or segment. The remaining road sits were grouped in the third category. As clearly, indicated in the result analysis topic of the study.
The identification of contributing factors and selection of countermeasure: The countermeasure selection has been made by evaluating the Potential for Safety Improvement (PSI) if appropriate countermeasures are applied. Countermeasures have been targeted a particular crash type or contributing factors. The contributing road and traffic control factors were identified through exhaustive fieldwork, in-depth analysis of historical crashes, from the model indication that is any variation from the base model. Therefore, the countermeasures selection and implementation depend on the recommendation of the HSM, site observation and the detailed analysis of each road segment in the result analysis part. According to HSM, the recommended contributing factors and countermeasures in rural two-way twolane roads existed in the appendix. Accordingly, crashes on the roadway segment commonly observed were listed in the HSM. Thus, is vehicle rollover, opposite direction sideswipe head-on sideswipe, single-vehicle run off the road.
Depending on this and other similar conditions HSM generalizes the following contributing factors on the rural truck twoway two-lane roads, thus, are the inadequacy of the base model developing geometric features and traffic control features, inadequate pavement marking, excessive speed, poor delineation, poor visibility, etc. Moreover, the recommended treatments or countermeasures suggested by HSM and other manuals of the roadways, recovering the fault parameters of the road geometric features, traffic control features and other contributing factors to the normal condition.
Primarily this section presents with a detailed analysis of data sources. The primary data analysis dealt with computation and organization of data acquired from the site investigation survey such as geometric features, traffic control features. Whereas the secondary analysis dealt with detail analysis of crash patterns along with the study, area means in the identification of hazardous locations like that of crash data, traffic volume data. Accordingly, identification of contributing factors and the countermeasures of the hazard location also discussed and provide.
Analysis of collected data
As it was explained in chapter three, data were collected from primary and secondary data sources. Besides, the entire analysis of the thesis was performed by analyzing the gathered data step by step and the requirement of the models.
Crash Modification Factors (CMF)
The CMFs for geometric design and traffic control features of rural two-lane two- way roadway segments are presented in consecutive parts below as it elaborated in 3.8 part of this thesis. These factors used to account for the variation between the base condition and the local site conditions. In case there are 11, CMF applied in these modification processes.
Lane width (CMF1r): Lane width of the road segment in the research site is no more difference rather in the urbane and sub urbane part of the road. The base value for the lane width CMF is 12 ft. Thus, the base condition CMF is equivalent to 1.00 calculated as:
CMF1r=(CMFra-1.0) × pra+1.0
Where,
CMF1r=Crash Modification Factor
CMFra=crash Modification for lane width
The lane width effect in this road segment is almost similar according to the actual measurement and the approximation of the HSM .by taking one of the segment CMFra=one, pra=57.4% based on the default distribution of crash types.
So CMF1r=(1-1)0.574+1=1
Shoulder width and type (CMF2r): The base value of shoulder width and type is a 6-foot paved shoulder, which is assigned a CMF value of 1.00. Shoulders over 8 ft wide are assigned CMFra equal to that for 8 ft. shoulders.
The CMFs values also applied to single-vehicle run-off the- road and multiple-vehicle head-on, sideswipes multiple vehicles opposite direction sideswipe crashes. The shoulder types in both directions are the same during site measurement, the measured values rounded according to the recommendation in the manual as clearly stated in the methodology part of the document and its effect is indicated by the following way.

CMFtra=Crash Modification Factor for shoulder type
CMFwra=Crash Modification Factor for related crashes based on shoulder type (from exhibit 10-18 HSM); the road segment overall determination was done by using excel software and indicated an appendix.
CMF2r=(1 × 1-1) × 0.574+1=1
CMF3r horizontal curves: Length and radius
The tangent roadway segment is the base for analysis. A CMF has been developed to represent how to crash experience on curved alignments that differs from that of tangents. This CMF applies to total roadway segment crashes. The CMF for horizontal curvature is in the form of an equation and yields a factor similar to the other CMFs in this chapter. The CMF for length, radius, and presence or absence of spiral transitions on horizontal curves is determined using the following Equation.
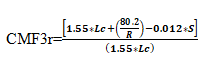
Where, CMF3r=Crash Modification Factor for the effect of horizontal alignment on a total crash
Lc=length of a horizontal curve (miles) which includes spiral transitions, if present
R=radius of curvature (feet)
S=one if spiral transition curve is present
0 if spiral transition curve is not present; 0.5 if a spiral transition curve is present at one but not both ends of the horizontal curve.
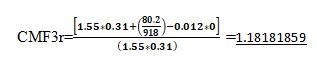
If the radius of curvature (R) and length of a curve (Lc) is less than 100-ft R (Lc) is set to equal to 100-ft. If the value of CMF3r is less than 1.00, the value of CMF3r is set equal to 1.00.
Then by taking one of the curved segment k-ch 20 that is Lc=0.31 mi, R=918 ft and the absence of a spiral curve.
CMF4r–Grades: The base condition for a grade is a generally level roadway. Exhibit 10-19 HSM presents the CMF for grades based on an analysis of rural two-lane two-way highway grades. The sign of the grade is irrelevant because each grade on a rural two-lane two-way highway is an upgrade for one direction of travel and a downgrade for the other and the grades generally classified into three main trains and also the research site grade identification follows this way of manipulation.
CMF5r-Driveway Density (DD): The base condition for driveway density is five driveways per mile. The CMF for driveway density is determined by the following mathematical formula.
Where, CMF6r=crash Modification Factor
AADT=Average Annual Daily Traffic volume
DD=Driveway Density considering driveways on both sides of the highway (driveways/mile).
CMF9r-roadside design: Roadside design in the research area accommodates a maximum of four levels of hazardousness by considering or comparing and contrasting to the photographic pictures to the given photographic pictures of the manual with the site. The base value of roadside hazard rating for roadway segments is three. The CMF is:
Crash Calibrating Factors (CF)
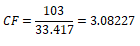
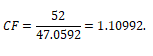
Calibrating factors of the crash in the site of research calculated depending on the manuals and CF provides a method to account for differences between jurisdictions in factors, such as; climate, driver population, animal population, crash recording variations and crash reporting system procedures. Mathematically it calculated as follows:
In this case, there are three different types of calibration factors as shown below.
Calibration factors along the road segment Kosober to Tilili.
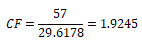
Calibration factor along the road segment Kossober to Dangla
Calibration factor along the road segment Kosober to Chagni
Base model calibration (modification)
The base model calibration or modification means the changing of the models from the developed site geometry and local condition to our site geometry and local condition. The CMF total was used in the modification process.
Calibrated/modified model=CF × CMF × base model
where CF=Calibration Factor
CMF=Crash Modification Factor
In this case, the CF and CMF used were varying from site to site as shown in the appendix.
Firstly, it is necessary to calculate the base condition or predicted average crash frequency (SPF) without the CF and CMF as shown below[14].
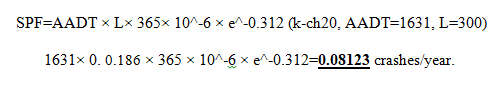
Then the calibrated/modified model’s output was calculated as shown below.
=CF × CMF total × base model (Kosober to Chagni)
=1.105 × 1.3 × 0.08123=0.11669 crashes per year for year 2008 and for three year also calculated as follows=1.105 ×
1.3 × (0.335543+0.406841+0.08123)=0.646109 crashes per year.
Estimating the crash
Based on the four steps EB-safety estimation procedure was performed in the identification of the hazardous location of the road part and this case the non-intersection part of the road. The four steps include:
1. Predicting the crash in the site condition that was the base condition with CMF and CF
2. Annual correction factors in each of the study years (used to know the yearly variation of traffic, climate and vehicle mix).
3. Relative weight this was also used for Overdispersion and predicted crashes as stated in the methodology part and analysis of the model.
4. Lastly, BE-adjusted expected average crash frequencies outputs were determined.
The predicted number of crashes determined by modified or calibrated models to the local conditions as indicated in the following formula.

Hazardous road segments
According to the selected performance measure and detail procedure described in the methodology part, hazardous road segments and the corresponding performance measure value were estimated. The identification of dangerous road segments was based on the value of the excess. EB-adjusted crash greater than the crash with CMF and CF as stated in the methodology part having the value negative road segment means the road segment is not hazardous and if the value is positive indicates the rod segment is said to be not normal or hazardous. Therefore, when the excess expected crash frequency value became greater than zero, a site experiences more crashes than expected otherwise a site experiences fewer crashes than expected. For example, segment K-CH 134 has experienced 1.58 crashes per year more than the expected threshold value, which can be expected from such types of roads. Hence, there will be the potential to reduce an equal number of crashes per year with minor improvements along this segment. Accordingly, based on excess values it is possible to identify the hazardous road segments ranking road sites based on excess value.
The identified dangerous road segments in the above section were ranked according to their excess values. The one that has ranked at the left has a high potential to reduce the number of crashes compared to the other road sites in the ranked list after treatments will be applied. This implied that the higher the value of excess in the ranked list of dangerous segments the more K-CH134 dangerous compared to the other sites in the list. As shown below, which was ranked in the first position, in the rural two-lane two-way main road reference population, has a potential for reducing the average crash frequency by 1.5807 crashes per year (i.e. around 10.14% of total the excess number of crashes in the study area). Therefore, Segment K-CH134 would be ranked in the first position as compared to other segments according to the highest excess expected crash frequency.
Similarly, segment K-CH122, which took the second place, has the potential for reducing the average crash frequency by 1.21 crashes per year (which contributed around 7.8 of a total excess the number of crashes in the study area). On the other hand, if segment K-CH52, which was ranked in the last position (i.e. ranked in 32 positions), is treated it has a potential for reducing the average crash frequency by 0.00454 crashes per year. This is the reason why the prioritization of individual sites was made within a reference population. On the other hand, due to the random nature of the crash, not anyone should expect that treatment could bring a road site into zero crash level. For that reason, the occurrence of a crash can be influenced by pure random variation and by systematic random variation. This study focuses only on the systematic variation part, which is attributable by various road and traffic factors (Figure 4).

Figure 4: Ranking dangerous road segments.
That can be controlled by applying treatments because the pure random variation part cannot be controlled, as long as there are exposures (vehicle-km driven) crash shall encounter. As indicated , this study identified that in total around 16 excess crashes can be expected from the identified 32 dangerous sites per year. The next step is to mitigate these systematically occurred excess numbers of a crash by applying remedial treatment to bring the number of the crash back to the normal condition, which is representative for all similar road segments in the reference population. The frequencies of predicted and expected to crash along the ranked dangerous road segments were (Figure 5).

Figure 5: Predicted and estimated crash depending on the excess value for hazard location.
The order of the segments in the figure was irrespective of any of the stated crash but it was based on the decreasing order of excess values similar If we use either of the specified crash frequencies to evaluate the performance of the road sites, we may wrongly give a high priority for safe or less dangerous segments than unsafe or more dangerous segments. For instance, as indicated, the distribution of predicted and expected several of a crash along segment 134, which was ranked in the first position, were less than the respective values along segment 122, ranked in the second position. Accordingly, to improve the performance of an existing road with only minor improvements this study found that the larger the number of crashes along a given segment does not necessarily mean that the more dangerous when it is compared to the other road segments in the reference population. This indicates that to normalize a total number of crashes and fatalities along the existing roads in the country level it is very important to identify the promising road sites using the best and advanced techniques. Then, prioritization of the identified promising sites is a critical issue in order to allocate a limited budget for the most promising section of roads. For that matter, the findings of this study will be useful for further implementation of the road safety measures along with existing dangerous road segments and a baseline for similar studies in the count.
Prioritizing the hazardous locations based on the excess value
In this case, especially, the countermeasure was the main target for the allocation of the limited budget for the most hazardous segments. Firstly the average values of all the hazardous segments of the road that is PS=Σnk=1 excess/n value of 32 road sites was estimated and those road sites exhibit greater than or equals to this average value calculated in the above formula grouped together in our case the numbers equivalent to eleven. Second, by excluding the selected first groups calculate in a similar way to the first one and the segments greater than or equal to the average values of excess also grouped as group two of the hazard location or segment. The remaining road sits were grouped in the third category as clearly indicated in the table below.
Group I: Hazardous sites with a relatively high excess expected number of a crash than the average of all hazardous road segments (i.e., 0.466103) excess numbers of crashes) were singled out as the most hazardous road segments. This implies that if only the top 11 hazardous sites will be treated, around 68% of the excess amount of expected crash frequencies can be reduced. Hence, this group was placed at the top of group rank and must be analyzed and subjected to special purpose inspections in order to identify the influencing factors and to select appropriate types of measures. Therefore, such sites would be considered having certainly a higher potential for safety improvement after applying the required measures.
Group II: Hazardous sites with relatively moderate excess values or those sites having potential to reduce from 0.201115 up to 0.466103 crashes per year were grouped into the second category. Accordingly, out of 32 hazardous segments 10 of them were included in this group. Even though these road sites cover the longer length of a total length of the hazardous road section, they have a potential to reduce only 4.22 numbers of excess crash per year, which accounted for around 27.1% of the total number of an excess crash. Hence, they were ranked in the second position of group rank and it would not necessarily be recommended to consider these sites as having a high potential for safety improvement.
Group III: Hazardous sites with a relatively least excess value or those having the potential to reduce less than 0.201115 crash per year were grouped into the third category. Accordingly, out of 32 hazardous segments 11segments were included and, accounted for around 4.26% of the total number of excess crashes.
Hence, they were ranked in the third position of group rank and it would be recommended not to consider these sites as having a high potential for safety improvement. Therefore, those sites higher on the list, when they ordered in decreasing order from top to bottom, are considered most likely to benefit from countermeasures intended to reduce crash frequency. Hence, the identified most hazardous sites that were ranked in the first group should be analyzed in more detail in order to identify the possible risk-indicating road and traffic factors and then to identify what kinds of improvements are likely to be most effective.
The Identification of causes and selections of countermeasures
Countermeasures have been targeted a particular crash type or contributing factors. The table below shows the selected countermeasures and the identified risk indicating factors for the most dangerous 11 road sites. The contributing road and traffic factors were identified through exhaustive fieldwork, in-depth analysis of historical crashes, from the formula of each base model of the SPF in the road segment and reviewing as-built drawing of the identified most dangerous road segments. Accordingly, for example, the result of the detail investigation along segment K-CH 134 (which is ranked in the first rank) shows that several risk-indicating road and traffic factors have been identified and the significant factors along this segment noted as: The high number of non-motorized traffic and pedestrians share traffic lane due to village settlement around this segment[15].
Sharp and unexpected horizontal curve after long tangent: Narrow shoulder width coupled with high fill and steep side slop along the outer edge of the horizontal curve and Frontage access especially two-access point located inside and outside of the curve and separated by less than 50 m distance. Resulting, drivers (especially unfamiliar ones) may be surprised and may not be able to negotiate their speed in the tangent section and at the specified curved section of the road. This is also an indication of the chain effect of several road section characteristics and traffic-related factors make road safety analysis a complex matter. As this study found, from this segment around 16 excess numbers of crashes expected to be encountered per year. On the other hand, equal amounts of the crash can be saved or benefited through the implementation of appropriate countermeasures. Therefore, in order to mitigate such excess number of crashes per year this study recommends simple and cost-effective engineering measures such as provision of warning sign with recommended speed, road surface marking, construction of painted guardrail outside the curve, installation of rumble strips to reduce speed and others as shown in Table below for this segment. In a similar fashion, the major risk indicating factors for the occurrence of a crash and the proposed countermeasures for the top four most dangerous road sites were provided in Table 5. Furthermore, this study recommends implementing some common countermeasures placed at logical locations consistently for all dangerous road segments such as roadside signs with recommended speeds, pavement markings, text on road surface and pedestrian crossing because they can provide important information to improve road safety. This study proposes that they need to be applied in a consistent way and to be placed at logical locations so as to be easy to understand and visible. From field survey and in-depth investigation of the traffic police report, most of the pedestrian collisions (more than 90 percent) occurred around village settlement, public area (such as School, Church, Mosque), at a place where access roads cross or join the road under investigation and also at the narrow bridge location. Therefore, the provision of the zebra crossing, posting reduced speed limit and installation of rumble strips can help to reduce the speed at the specified places in order to reduce pedestrian collision. Furthermore, from field survey and indepth investigation of traffic police report non-motorized traffic, which is called animal-drawn carts, usually, share fastmoving motor vehicle lanes. Accordingly, the involvement of animal-drawn carts, usually Donkey-drawn carts, was significant and accounted for more than expected out of the total involved vehicles, which is greater than the involvement of automobiles. Most of these accidents occurred at night time due to the reason that animal-drawn carts had not used any reflective materials. For that reason, motor vehicle drivers usually faced a problem to observe the carts within reasonable distance to stop their vehicles without colliding with them. Consequently, either motor vehicles usually collide with carts or they can be involved with other types of accidents in order to save animal-drawn carts. For instance, as traffic police reported, in order to avoid collision with animal-drawn carts some drivers took a decision like a drive off the road, enter into the opposing lane, or try to stop the vehicle instantaneously. Due to this maneuver, the vehicles had involved other types of accidents like roll over, collision with fixed objects, head-on collision; rear-end collision and turnover along the study area. In order to improve such accidents, segregating fast-moving and slow-moving traffics by constructing separate lanes for non-motorized traffic is very important. Equally, attention should be paid to enforce animal-drawn carts to be equipped with reflective materials at the front and rear of the cart to improve visibility, especially during night time.
Depending on the methods used, that is empirical Bayes method, out of 123 road segments, this study identifies 32 of them are singled out as hazardous road segments and ranked based on their excess number of expected crashes. The study also found that in total around 16 excess crashes can be expected from the identified 32 dangerous sites other crashes were occurred due to other cases and predicted crashes. Out of 32 ranked dangerous segments, eleven of them are found to be the worst sites because they contributed around 69% of the total excess expected crash frequencies. In the identification of hazardous locations, the base model the site condition models are incorporated step by step to achieve the designed objectives. The identifying hazardous locations can also divide into different groups for the implementation and allocation of resources priority of implementation for the countermeasures. This study also found the major contributing road and traffic factors along with the most dangerous segments, include: Sharp horizontal curves after a long tangent, a high number of non-motorized traffic and pedestrians directly access the road at a place where the road passes through village settlement, poor coordination of horizontal and vertical alignments, terrain type, lane and/or shoulder width, the presence of curves n both side of the tangent.
Accordingly, simple and cost-effective countermeasures such as the provision of the warning sign with recommended speed, road surface marking, construction of painted guardrail outside the curve, provision of rumble strips, and others are proposed in order to reduce the excess number of the crash. Therefore, implementation of the identified countermeasures for the worst road segment especially, those included in the first category of group rank will be vital to reducing the excess number of the crash.
The Awi zone road authority and the national ministry of transport should give intense Consideration towards allocating enough funds and improving the hazard locations as per the proposed countermeasure. Because it used as helpful, a tool to reduce road traffic crash in number and frequency occurred due to geometric and traffic control features. In addition, responsible government organizations should develop and apply suitable maintenance strategies to maintain road crash problems. The appropriate regional level or country level development of calibration factors also highly suggested to government organizations, and Countermeasures highly advisable to reduce the crash that occurred due to geometric and traffic control features so the responsible government organizations and persons participating in the identification of hazard location, and implementation of countermeasures.
Furthermore, a Computerized database system is also recommended to crash data recording organizations in order to make the accessible trouble-free.to indicate time, specific place because the methodology needs segment-based data of the crash. Accordingly, the data should be common formant through the area in order to make accessibility easy for different organization and analysis of the hazard location. Behind these researchers should not waste their time and resource in search of input data's for the analysis, instead this data exists in governmental organizations, such as the ministry of transport, ERA, regional road’s authority should perform a continuous assessment on the existing road networks. The existing data’s in the listed organizations are geometric feature data, traffic control.
First, I would like to thank my Almighty Lord, God and His Holy Mother, St. Mary, in a matchless and eternal way. Secondly, I am very pleased to express my deepest gratitude and appreciation to my advisor Ashenafi Aregawi (Ph.D.) for his prodigious help and positive suggestions throughout the study execution. I am also thankful to the staff of Civil engineering, Road and transportation; my grateful thanks are also extended to the staff of Ethiopian Roads Authority Debre Markos Aouragodana branch and Awi zone police departments of the five woredas. Moreover, I would like to present my special and sincere gratitude to my whole family members, my father Biress Taye, my mother Genet Amare, my brothers, and my sisters. Finally, my honorable appreciation and thanks go to my colleagues and best friends for their valuable contribution, advise, support and motivation staring from the commencement to the completion of the research.
[Crossref] [Google Scholar] [PubMed]