International Journal of Innovative Research in Computer and Communication Engineering
ISSN ONLINE(2320-9801) PRINT (2320-9798)
ISSN ONLINE(2320-9801) PRINT (2320-9798)
Himadri Nath Moulick1, Moumita Ghosh2
|
| Related article at Pubmed, Scholar Google |
Visit for more related articles at International Journal of Innovative Research in Computer and Communication Engineering
In computer vision, image compression mainly refers to the problem of reducing the memory size of a digital image. Mainly problems regarding data transferring over internet might require an image data to be of comparatively lesser memory size. Moreover high bandwidth is also required for transmission of high quality image data. Image compression provides solution to this problem. Now in order to retrieve the image of lesser size there is a considerable amount of loss of image data. For this problem optimized method is chosen to provide a final image which is comparatively of smaller memory size than the original image, yet it is quite visually similar to the original image. In this paper, we are trying to segment the original image using K-Means clustering method. Let us consider a grey level image of M XN size, now we know there are in total 0-255 grey level intensity values i.e 8 bits for each pixel therefore the total size of the image will be M XN X8 bits. Now in our approach we have segmented the image into K clusters. Let the set of cluster centres be (c1, c2,..........., ck) i.e. we have seen that on segmentation of the image into 8 (k=8) segments better results are obtained, hence the total image can be replaced accordingly with 8 grey level intensity values, so the 8 values can be represented by 3 bits (000, 001, ……..,111). Now if we represent the image with 8 grey level values there is a high loss of data. In our approach we have tried to minimize the loss of data using correlative coefficient function. In every iteration of K-Means clustering algorithm we have compared the segmented image with the original image until the loss of data is minimized (the value of correlative co-efficient function should be maximum) and then the iteration is stopped. In this approach the compressed image is of M XN X3bits memory size, hence there is 62.5% decrease of the memory size of the compressed image, but still there is above 90% visual similarity of the compressed image with the original image. So in our approach the main bottleneck of image compression is satisfied considerably. Advanced techniques of image processing and analysis find widespread use in medicine. In medical applications, image data are used to gather details regarding the process of patient imaging whether it is a disease process or a physiological process. Information provided by medical images has become a vital part of today‟s patient care. The images generated in medical applications are complex and vary notably from application to application. Nuclear medicine images show characteristic information about the physiological properties of the structures-organs. In order to have high quality medical images for reliable diagnosis, the processing of image is necessary.
Keywords |
| : Image Compression, Image Segmentation, K-Means Clustering Algorithm, Correlation Co-efficient Function. |
INTRODUCTION |
| The objective of image compression is to reduce irrelevance and redundancy of the image data in order to be able to store or transmit data in an efficient format yet keep considerable similarity with the input image data over a lower transmission bandwidth. Digital images comprises of huge amount of data. Reduction in size of image data is gaining importance because they find more applications in the field data internet, teleconferencing, multimedia, and high definition television technologies. Image compression is basically a mapping of image data from a higher dimensional space to a lower dimensional space. The main aim of image compression is to represent an image with minimum number of bits but in acceptable manner. Basically there are two types of image compression, lossy compression and lossless compression. The lossless compression is particularly useful in image archiving and permits the image to be compressed and decompressed without loss of any data. And the lossy compression, affords higher levels of compression ratio but result in a less than perfect replica of the original image. Lossy compression is beneficial in applications such transmission, videoconferencing, and facsimile transmission etc., in these ircumstances certain amount of error is tolerable. In lossless image compression algorithms, the reconstructed image is identical to the original image. Lossy compression algorithms attain high compression ratios by exploiting human visual properties. Wavelet transformation (WT) [1], [3]-[8], vector quantization (VQ) [2], [3] are general approaches used in addition to various other methods [9]-[15] in image compression. The problem in lossless compression method is that, the compression ratio is very less; where as in the lossy compression the compression ratio is very high but may loose vital information of the image. K-Means clustering technique is implemented again. In our approach we have used multiple thresholding technique to segment the input image. Let the set of cluster centres be (c1, c2,..........., ck) . Now the cluster centers are obtained as follows using the following function: g(x, y) ïÃâ¬Ã½ci , where f (x, y)ïÃâ¬Ã½ci ïÃâ¬Ã½Ã¯Ãâ¬Ã½f (x, y)ïÃâ¬Ã½cj ; i, j ïÃâ¬Ã½1,2,3...........k; i ïÃâ¬Ã½Ã¯Ãâ¬Ã½j . Here f (x, y) is the M ïÃâ¬Ã½N original image, (c1, c2,..........., ck) is the set of cluster centers and g(x, y) is the segmented image. The scope of image processing and analysis applied to medical applications is to improve the quality of the acquired image and extract quantitative information from medical image data in an efficient and accurate way. MatLab (Matrix Laboratory) is a high performance interactive software package for scientific and engineering computation developed by MathWorks (Mathworks Inc., 2009). MatLab allows matrix computation, implementation of algorithms, simulation, plotting of functions and data, signal and image processing by the Image Processing Toolbox. It enables quantitative analysis and visualisation of nuclear medical images of several modalities, such as Single Photon Emission Computed Tomography (SPECT), Positron Emission Tomography (PET) or a hybrid system (SPECT/CT) where a Computed Tomography system (CT) is incorporated to the SPECT system. The Image Processing Toolbox (Mathworks Inc., 2009) is a comprehensive set of reference-standard algorithms and graphical tools for image processing, analysis, visualisation and algorithm development. It offers the possibility to restore noisy or degraded images, enhance images for improved intelligibility, extract features, analyse shapes and textures, and register two images. Thus, it includes all the functions that MatLab utilises in order to perform any sophisticated analysis needed after the acquisition of an image. Most toolbox functions are written in open MatLab language offering the opportunity to the user to inspect the algorithms, to modify the source code and create custom functions (Wilson et al., 2003, Perutka, 2010). |
II.IMAGE SEGMENTATION |
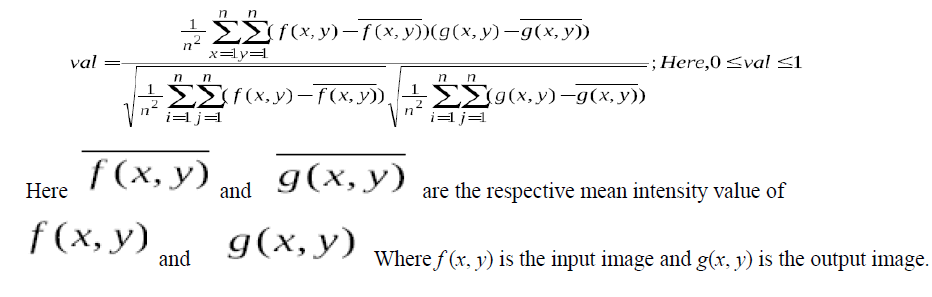
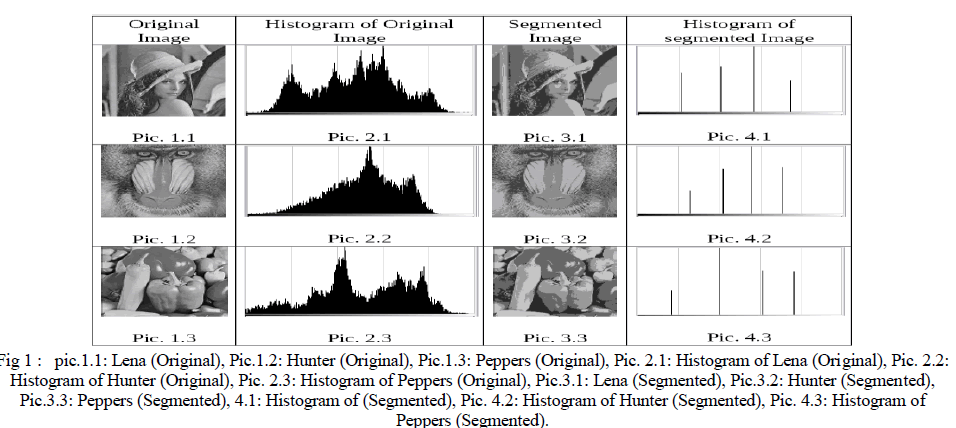
| Segmentation subdivides an image into some regions or objects. Segmentation of an image is one of the most difficult tasks in image processing. To compress the image data at first we have segmented the image into multilevel thresholding technique. In multilevel thresholding technique the prime problem is to get the optimum threshold points. To get the optimum threshold points we used K-Means clustering algorithm. Our main objective is to keep the segmented image visually quiet similar to the original image. To compare the segmented image with the input image we used correlation coefficient function. The correlation co-efficient function is as follows: |
 |
A. K-Means Clustering Algorithm |
In data mining, k-means clustering is a method of cluster analysis which aims to partition n observations into k clusters in which each observation belongs to the cluster with the nearest mean. This results in a partitioning of the data space into Voronoi cells. The most common algorithm uses an iterative refinement technique. Due to its ubiquity it is often called the k-means algorithm; it is also referred to as Lloyd's algorithm, particularly in the computer science community.Given an initial set of k means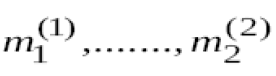 .Assign each observation to the cluster whose mean is closest to it. .Assign each observation to the cluster whose mean is closest to it. |
| observation to the cluster whose mean is closest to it. |
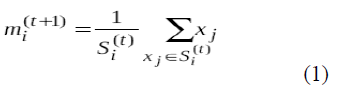
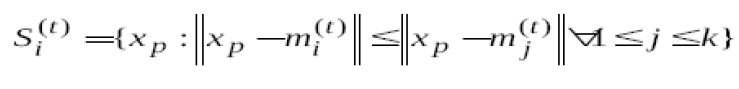 Where each x p is assigned to exactly one s(t ) , even if it could be is assigned to two or more of them. Calculate the new means to be the centroids of the observations in the new clusters. Where each x p is assigned to exactly one s(t ) , even if it could be is assigned to two or more of them. Calculate the new means to be the centroids of the observations in the new clusters. |
 |
| The algorithm has converged when the assignments no longer change. |
B. Test and Results |
| Comparison between original image and segmented image. |
 |
III.NUECLEAR MEDICINE IMAGING |
| Nuclear Medicine is the section of science that utilises the properties of radiopharmaceuticals in order to derive clinical information of the human physiology and biochemistry. According to the examination needed for each patient, a radionuclide is attached to a pharmaceutical (tracer) and the whole complex is then delivered to the patient intravenously or by swallowing or even by inhalation. The radio -pharmaceutical follows its physiological pathway and it is concentrated on specific organs and tissues for short periods of time. Then, the patient is positioned under a nuclear medicine equipment which can detect the radiation emitted by the human body resulting in images of the biodistribution of the radio- pharmaceutical. In Nuclear Medicine, there are two main methods of patient imaging, the imaging with Planar Imaging, Dynamic Imaging or SPECT and the PET. During the last decade, hybrid systems have been developed integrating the CT technique with either SPECT or PET resulting in SPECT/CT and PET/CT respectively. This chapter will concentrate on the implementation of MatLab code in gamma camera planar imaging, SPECT and SPECT/CT methods. The gamma camera is composed of a collimator, a scintillator crystal usually made of NaI (or CsI), the photomultiplier tubes, the electronic circuits and a computer equipped with the suitable software to depict the nuclear medicine examinations. In planar imaging, the patient, having being delivered with the suitable radiopharmaceutical, is sited under the gamma camera head. The gamma camera head remains stable at a fixed position over the patient for a certain period of time, acquiring counts (disintegrations). These will constitute the radiopharmaceutical distribution image. The counts measured in a specific planar projection originate from the whole thickness of patient (Wernick & Aarsvold, 2004). In SPECT, the gamma camera head rotates around the patient remaining at well defined angles and acquiring counts for specific periods of time per angle. What makes SPECT a valuable tool in nuclear medicine is the fact that information in the three dimensions of the patient can be collected in a number of slices with a finite known volume (in voxels). Thus, SPECT technique is used to display the radiopharmaceutical distribution in a single slice removing the contribution from the overlying and underlying tissues. In order to obtain the most accurate quantitative data from SPECT images, two issues that have to be resolved are the attenuation correction and the Compton scattering that the photons are undergone until reach and interact with the slice of interest tissues. As an examining organ has certain dimensions, each slice along the axis of the gamma camera has different distance from the detector. Thus, each photon experiences different attenuation. These two phenomena usually lead to distortion of the measured activity concentration (Wernick & Aarsvold, 2004). The acquired data are processed in order to correct and compensate the undesired effect of these physical phenomena. The projection data of each slice constitute the sinogram. As a result, a series of sinograms is the files acquired. However, this kind of files needs reconstruction in order to get an image with diagnostic value. The most known reconstruction methods are the Filtered Back-Projection (FBP) and the Iterative methods. |
A. Image Quality in Nuclear Medicine |
| Image quality plays an important role in nuclear medicine imaging as the goal is a reliable image of the projected organ to be provided, for accurate diagnosis or therapy. The physical characteristics that are used to describe image quality are (1) contrast, (2) spatial resolution and (3) noise. Image contrast is the difference in intensity corresponding to different concentration of activity in the patient. For high diagnostic accuracy, nuclear medicine images must be of high contrast. The image contrast is principally affected by the radiopharmaceutical that is used for imaging and the scattered radiation. In general, it is desirable to use a radiopharmaceutical which has a high uptake within the target organ. Spatial resolution is defined as the ability of the imaging modality to reproduce the details of a non uniform radioactive distribution. The spatial resolution is separated into intrinsic resolution (scintillator, photomultiplier tubes and electronic circuit) and system resolution (collimator, scintillator, photomultiplier tubes and electronic circuit). The intrinsic resolution depends on the thickness of scintillation crystal while the system resolution depends mainly on the distance from the emitting source to collimator. The resolution of a gamma camera is limited by several factors. Some of these are the patient motion, the statistical fluctuation in the distribution of visible photons detected and the collimators geometry (Wernick & Aarsvold, 2004). Noise refers to any unwanted information that prevents the accurate imaging of an object. Noise is the major factor in the degradation of image quality. Image noise may be divided into random and structured noise. Random noise (also referred as statistical noise) is the result of statistical variations in the counts being detected. The image noise is proportional to N1/2 where N is the number of detected photons per pixel. Therefore, as the number of counts increases the noise level reduces. Image noise is usually analyzed in terms of signal-to-noise-ratio (SNR). SNR is equal to N/ N1/2. If the SNR is high, the diagnostic information of an image is appreciated regardless of the noise level. Structured noise is derived from non-uniformities in the scintillation camera and overlying structures in patient body. |
B. Image Analysis and Processing in Nuclear Medicine |
| In the last several decades, medical imaging systems have advanced in a dynamic progress. There have been substantial improvements in characteristics such as sensitivity, resolution, and acquisition speed. New techniques have been introduced and, more specifically, analogue images have been substituted by digital ones. As a result, issues related to the digital imagesâÃâ¬ÃŸ quality have emerged. The quality of acquired images is degraded by both physical factors, such as Compton scattering and photon attenuation, and system parameters, such as intrinsic and extrinsic spatial resolution of the gamma camera system. These factors result in blurred and noisy images. Most times, the blurred images present artefacts that may lead to a fault diagnosis. In order the images to gain a diagnostic value for the physician, it is compulsory to follow a specific series of processing. Image processing is a set of techniques in which the data from an image are analyzed and processed using algorithms and tools to enhance certain image information that is more useful to human interpretation (Nailon, 2010). The processing of an image permits the extraction of useful parameters and increases the possibility of detection of small lesions more accurately. |
IV .DIGITAL IMAGES |
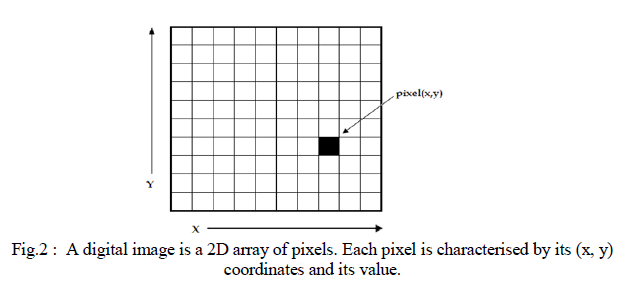
| In all modern nuclear medicine imaging systems, the images are displayed as an array of discrete picture elements (pixels) in two dimensions (2D) and are referred as digital images. Each pixel in a digital image has an intensity value and a location address (Fig. 2). In a nuclear medicine image the pixel value shows the number of counts recorded in it. The benefit of a digital image compared to the analogue one is that data from a digital image are available for further computer processing. |
 |
| Digital images are characterised by matrix size, pixel depth and resolution. The matrix size is determined from the number of the columns (m) and the number of rows (n) of the image matrix (m×n). The size of a matrix is selected by the operator. Generally, as the matrix dimension increases the resolution is getting better (Gonzalez et al., 2009). Nuclear medicine images matrices are, nowadays, ranged from 64×64 to 1024×1024 pixels. Pixel or bit depth refers to the number of bits per pixel that represent the colour levels of each pixel in an image. Each pixel can take 2k different values, where k is the bit depth of the image. This means that for an 8-bit image, each pixel can have from 1 to 28 (=256) different colour levels (grey-scale levels). Nuclear medicine images are frequently represented as 8- or 16- bit images. The term resolution of the image refers to the number of pixels per unit length of the image. In digital images the spatial resolution depends on pixel size. The pixel size is calculated by the Field of View (FoV) divided by the number of pixels across the matrix. For a standard FoV, an increase of the matrix size decreases the pixel size and the ability to see details is improved. |
A. Image Interpolation |
| Interpolation is a topic that has been widely used in image processing. It constitutes of the most common procedure in order to resample an image, to generate a new image based on the pattern of an existing one. Moreover, re-sampling is usually required in medical image processing in order to enhance the image quality or to retrieve lost information after compression of an image (Lehmann et al., 1999). Interpreting the interpolation process, the user is provided with several options. These options include the resizing of an image according to a defined scaling factor, the choice of the interpolation type and the choice of low-pass filter.The general command that performs image resizing is imresize. However, the way that the whole function has to be written depends heavily on the characteristics of the new image. The size of the image can be defined as a scaling factor of the existing image or by exact number of pixels in rows and columns. Concerning the interpolation types usually used in nuclear medicine, these are the following: a) nearestneighbour interpolation („nearestâÃâ¬ÃŸ), where the output pixel obtains the value of the pixel that the point falls within, without considering other pixels, b) bilinear interpolation („bilinearâÃâ¬ÃŸ), where the output pixel obtains a weighted average value of the nearest 2x2 pixels, c) cubic interpolation („bicubicâÃâ¬ÃŸ), where the output pixel obtains a weighted average value of the nearest 4x4 pixels (Lehmann et al., 1999). When an image has to resize in a new one, with specified scaling factor and method, then the function Implementing that, is the following: NewImage = imresize(Image, scale, method); For example, for a given image I, the new image J shrunk twice of the initial one, using the bilinear interpolation method, the function will be: J = imresize(I, 0.5, „bilinearâÃâ¬ÃŸ); This way of image resizing contributes to the conversion of image information during any such process, a fact that is valuable in the precision of a measurement. Bilinear interpolation is often used to zoom into a 2D image or for rendering, for display purposes. Apart from the previous methods, the cubic convolution method can be applied to 3D images. |
B. Image Filtering |
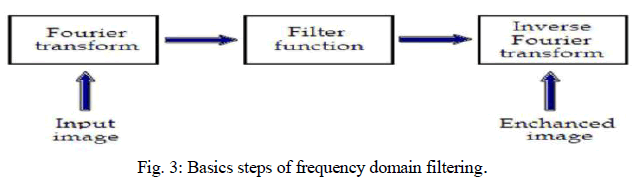
| The factors that degrade the quality of nuclear medicine images result in blurred and noisy images with poor resolution. One of the most important factors that greatly affect the quality of clinical nuclear medicine images is image filtering. Image filtering is a mathematical processing for noise removal and resolution recovery. The goal of the filtering is to compensate for loss of detail in an image while reducing noise. Filters suppressed noise as well as deblurred and sharpened the image. In this way, filters can greatly improve the image resolution and limit the degradation of the image. An image can be filtered either in the frequency or in the spatial domain. In the first case the initial data is Fourier transformed, multiplied with the appropriate filter and then taking the inverse Fourier transform, re-transformed into the spatial domain. The basics steps of filtering in the frequency domain are illustrated in Fig. 3. |
 |
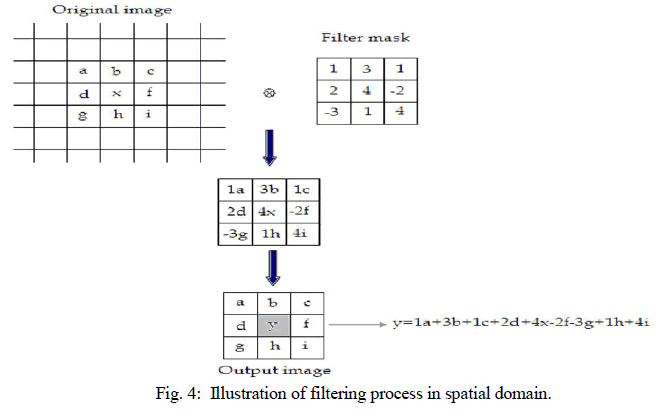
| The filtering in the spatial domain demands a filter mask (it is also referred as kernel or convolution filter). The filter mask is a matrix of odd usually size which is applied directly on the original data of the image. The mask is centred on each pixel of the initial image. For each position of the mask the pixel values of the image is multiplied by the corresponding values of the mask. The products of these multiplications are then added and the value of the central pixel of the original image is replaced by the sum. This must be repeated for every pixel in the image. The procedure is described schematically in Fig. 4. If the filter, by which the new pixel value was calculated, is a linear function of the entire pixel values in the filter mask (e.g. the sum of products), then the filter is called linear. If the output pixel is not a linear weighted combination of the input pixel of the image then the filtered is called non-linear. According to the range of frequencies they allow to pass through filters can be classified as low pass or high pass. Low pass filters allow the low frequencies to be retained unaltered and block the high frequencies. Low pass filtering removes noise and smooth the image but at the same time blur the image as it does not preserve the edges. High pass filters sharpness the edges of the image (areas in an image where the signal changes rapidly) and enhance object edge information. A severe disadvantage of high pass filtering is the amplification of statistical noise present in the measured counts. The next section is referred to three of the most common filters used by MatLab: the mean, median and Gaussian filter. |
 |
1) Mean Filter: |
| Mean filter is the simplest low pass linear filter. It is implemented by replacing each pixel value with the average value of its neighbourhood. Mean filter can be considered as a convolution filter. The smoothing effect depends on the kernel size. As the kernel size increases, the smoothing effect increases too. Usually a 3×3 (or larger) kernel filter is used. An example of a single 3×3 kernel is shown in the Fig. 5. |
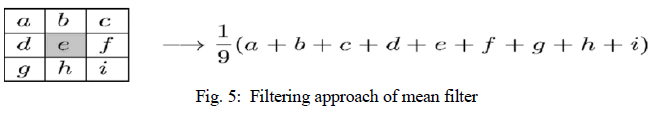 |
| The Fig.5 depicts that by using the mean filter, the central pixel value would be changed from “e” to „âÃâ¬ÃŸ a+b+c+d+e+f+g+h+i) 1/9âÃâ¬ÃŸÃ¢Ãâ¬ÃŸ. |
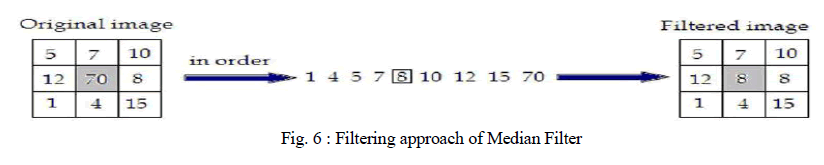
2) Median Filter: |
| Median filter is a non linear filter. Median filtering is done by replacing the central pixel with the median of all the pixels value in the current neighbourhood. A median filter is a useful tool for impulse noise reduction (Toprak & Göller, 2006). The impulse noise (it is also known as salt and paper noise) appears as black or (/and) white pixels randomly distributed all over the image. In other words, impulse noise corresponds to pixels with extremely high or low values. Median filters have the advantage to preserve edges without blurring the image in contrast to smoothing filters. |
 |
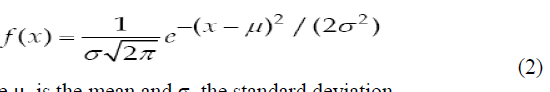
3) Gaussian Filter: |
| Gaussian filter is a linear low pass filter. A Gaussian filter mask has the form of a bellshaped curve with a high point in the centre and symmetrically tapering sections to either side (Fig.7). Application of the Gaussian filter produces, for each pixel in the image, a weighted average such that central pixe contributes more significantly to the result than pixels at the mask edges (OâÃâ¬ÃŸGorman et al., 2008). The weights are computed according to the Gaussian function (Eq.2): |
 |
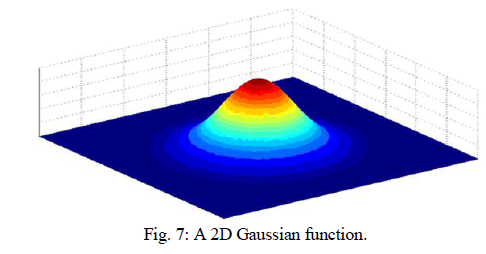 |
| The degree of smoothing depends on the standard deviation. The larger the standard deviation, the smoother the image is depicted. The Gaussian filter is very effective in the reduction of impulse and Gaussian noise. Gaussian noise is caused by random variations in the intensity and has a distribution that follows the Gaussian curve. |
C. Image segmentation |
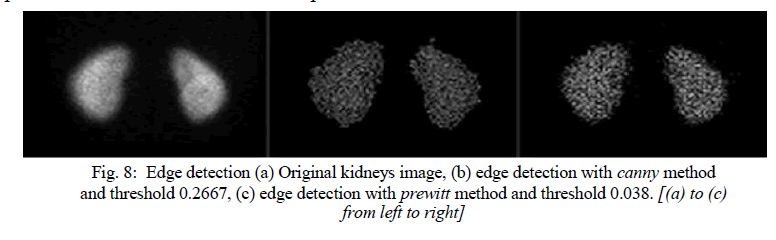
| The image segmentation describes the process through which an image is divided into constituent parts, regions or objects in order to isolate and study separately areas of special interest. This process assists in detecting critical parts of a nuclear medicine image that are not easily displayed in the original image. The process of segmentation has been developed based on lots of intentions such as delineating an object in a gradient image, defining the region of interest or separating convex components in distance-transformed images. Attention should be spent in order to avoid „oversegmentationâÃâ¬ÃŸ or „under-segmentationâÃâ¬ÃŸ. In nuclear medicine, segmentation techniques are used to detect the extent of a tissue, an organ, a tumour inside an image, the boundaries of structures in cases that these are ambiguous and the areas that radiopharmaceutical concentrate in a greater extent. Thus, the segmentation process serves in assisting the implementation of other procedures; in other words, it constitutes the fundamental step of some basic medical image processing (Behnaz et al., 2010). There are two ways of image segmentation: a) based on the discontinuities and, b) based on the similarities of structures inside an image. In nuclear medicine images, the discontinuity segmentation type finds more applications. This type depends on the detection of discontinuities or else, edges, inside the image using a threshold. The implementation of threshold helps in two main issues: i) the removal of unnecessary information from the image (background activity) and, ii) the appearance of details not easily detected. The edge detection uses the command edge. In addition, a threshold is applied in order to detect edges above defined grey-scale intensity. Also, different methods of edge detection can be applied according to the filter each of them utilises. The most useful methods in nuclear medicine are the „SobelâÃâ¬ÃŸ, „PrewittâÃâ¬ÃŸ, „RobertsâÃâ¬ÃŸ, „CannyâÃâ¬ÃŸ as well as „Laplacian of Gaussian'. It is noted that the image is immediately transformed into a binary image and edges are detected. The general function used for the edge detection is the following: [BW] = edge (image, „methodâÃâ¬ÃŸ, threshold) Where [BW] is the new binary image produced, image is the initial one; „methodâÃâ¬ÃŸ refers to the method of edge detection and „thresholdâÃâ¬ÃŸ to the threshold applied. In nuclear medicine, the methods that find wide application are the sobel, prewitt and canny. In the following example, the canny method is applied in order to detect edges in an image. |
| Example 1 |
| I = imread(„kidneys.jpgâÃâ¬ÃŸ); |
| figure, imshow(I) |
| J = edge(I,'canny', 0.048); |
| figure, imshow(J) |
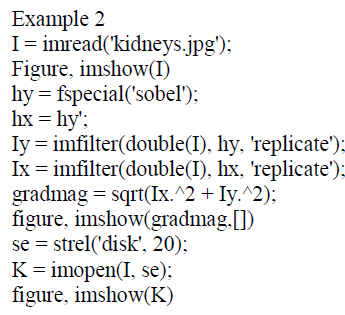
| Another application of segmentation in nuclear medicine is the use of gradient magnitude. The original image is loaded. Then, the edge detection method of sobel is applied in accordance with a gradient magnitude which gives higher regions with higher grey-scale intensity. Finally, the foreground details are highlighted and segmented image of the kidneys is produced. The whole code for that procedure is described below. |
 |
 |
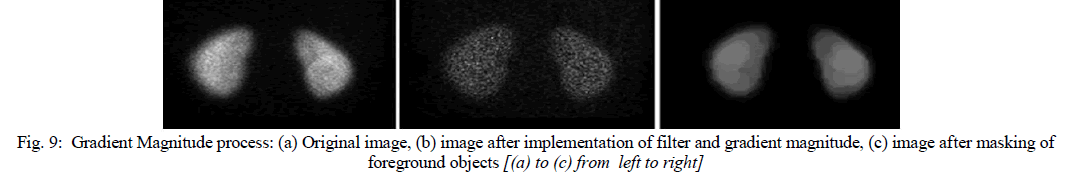 |
| In the final image, the outline of the organs is depicted. The area inside the kidney has been separated into larger parts with grey-scale intensity weighted and decided from the closest 20 pixels in a circular region. In the areas of kidney that have higher activity concentrated, more than one layer of circular regions have been added presenting a final lighter region. |
V.CONCLUSION |
| In this paper, a new segmentation based lossy image compression method, using K-Means clustering algorithm, has been proposed. This approach has enabled us to compress an image to 75%, when the compressed image is visually 95% similar to the original image. We have tested several images to prove the robustness of our approach. Also we can get more fruitful result using run length or others algorithm with our approach in case of lossy image segmentation. In our approach the loss of data is very high but tried to keep the compressed mage visually quiet similar to the original image.Image processing and analysis applied to nuclear medicine images for diagnosis, improve the acquired image qualitatively as well as offer quantitative information data useful in patientâÃâ¬ÃŸs therapy and care. Advanced techniques of image processing and analysis find widespread use in nuclear medicine. MatLab and Image Processing Toolbox enable both quantitative analysis and visualization of Nuclear Medicine images acquired as planar or angle projected images to reconstruct tomographic (SPECT, PET) slices and 3D volume surface rendering images. |
References |
|