Keywords
|
| Stainless steel rod, frequency measurement using CRO, 555 timer IC, 89c2051 microcontroller, RS-232 communication |
INTRODUCTION
|
| Instruments for diesel level measurement have been around for many years. But here my motive to implement the sensor for continuous level measurement and real time data display on computer by serial Communication, observe data at computer continuously Measuring Diesel level is an essential task for industrial perspective. In this way, it would be possible to track the actual implementation of such initiatives with integration of various controlling activities. Therefore, diesel flow controlling system implementation [2] .The existing automated method of level detection is described [3]. Usually, this kind of systems provides visual multi level as well as continuous level indication. Proper monitoring is needed to ensure diesel sustainability is actually being reached, with disbursement linked to sensing and automation. Such programmatic [1] approach entails microcontroller based automated diesel level sensing.89c2051 microcontroller used as a single board computer. The aim of this work is to present an ideal design technique of the Diesel level sensor system based on the use of the commercially available microcontroller |
BASIC CONCEPTS
|
| The technique of diesel level monitoring and controlling system concentrated with some basic parts which are softly aggregated together in our proposed method. Basic descriptions of some parts are described below which are very useful for design perspective. |
| A.RS-232 Communication |
| For communication, 9600 baud rate asynchronous serial transmission rate with UART mode. Communication generally baud rates set at 300, 600, 1200, 4800 and 9600. Serial communication is often used either to control or to receive data from an embedded microprocessor. Serial communication is a form of I/O in which the bits of a byte begin transferred appear one after the other in a timed sequence on a single wire. Serial communication has become the standard for inter computer communication. In this lab, we'll try to build a serial link between 8051 and PC using RS232. |
| B. Bar Graph display |
| For level indication unit we can use some LED light which will work for Diesel level indication. By touching different diesel levels through diesel level sensor, LED should be indicated as on/off (i.e. on: yes sensor senses diesel).here diesel is taken as fluid. This type display indicator mainly used for industrial application [6]. |
| • Industrial Controls |
| • Instrumentation |
| • Office Equipment |
| • Computer Peripherals |
| • Consumer Products |
| C. Fluid Level Sensor |
| To make special fluid level sensor we would like to introduce some convenient materials such as stainless steel rod, 90m sensor cable, resistance etc [4].After that we calibrated the various frequency reading at various levels. Here we observed the reading each 1cm.Then we plot the (X-Y) axis graph. Sensor-array probe uses the liquid level as part of the circuit path. The height location of the sensor points correspond to the desired levels to detect, and the contacts are made or coated with a material that won’t corrode, oxidize or react with the diesel in the tank. The sensor points can be inserted directly into the tank. Terminal posts on the other side can wire directly to the interface board, but most designers prefer a sensor board that can be inserted and removed in a single location. The fewer holes drilled into a tank, the fewer possible sources of leak and failure but we didn’t hole in the tank .we inserted the sensor stainless rod from top to bottom gradually for high resolution and noted the observation. Replicating the same stage will provide as much resolution as needed. The LEDs can be replaced.. |
| The voltages used should not cause electrolysis in the tank. It’s important not to build up explosive gases. One technique is to sense every so often rather than in real time. This ensures that power is off to the entire array for most of the time, only powered up when needed for a quick measurement. Also, shunting each side of the sensor to ground when not in use will not let a charge build up. Sensor will exhibit a lower frequency when liquid levels are higher. A parallel capacitor can set the open-circuit oscillator base frequency. As soon as diesel touches the bottom part of the probe, the capacitance will change abruptly to a lower frequency, which begins the measurement range. As the level rises, more capacitance lowers the frequency linearly. At the highest fill level, the lowest frequency will be measured. |
555 IC VOLTAGE CONTROLLED OSCILLATOR
|
| In most cases, the frequency of an oscillator is determined by the time constant RC. However, in cases or applications such as FM, tone generators, and frequency-shift keying (FSK), the frequency is to be controlled by means of an input voltage, called the control voltage. This can be achieved in a voltage-controlled oscillator (VCO). A VCO is a circuit that provides an oscillating output signal (typically of square-wave or triangular waveform) whose frequency can be adjusted over a range by a dc voltage.. A Schmitt trigger circuit is employed to switch the current sources between charging and discharging the capacitor, and the triangular voltage produced across the capacitor and square-wave from the Schmitt trigger are provided as outputs through buffer amplifiers. Both the output waveforms are buffered so that the output impedance of each is 50 f2. |
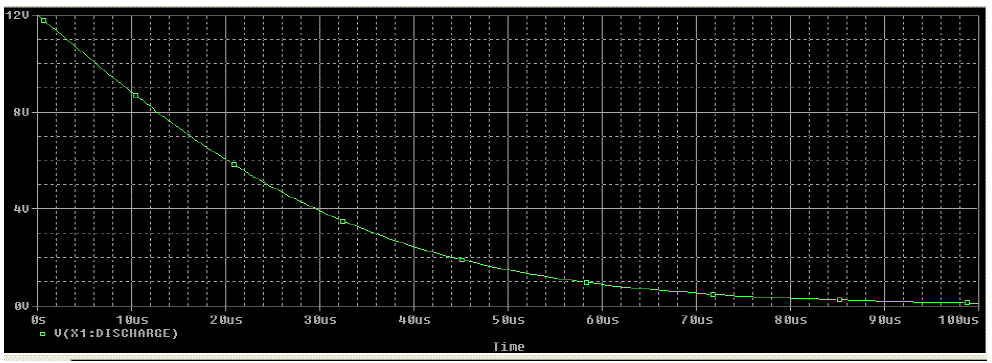
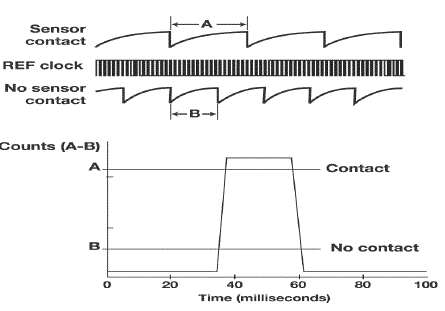
| A simple oscillator circuit such as a 555 can create a frequency range that a micro can measure. The 555 can also be used to control the pulse width. A typical oscillator can be made using a 555 timer. The frequency of the oscillator indicates the liquid level. A constant current source continuously charges the capacitive sensor to the reference threshold level on the comparator. The comparator will pulse high each time the capacitive sensor reaches the reference threshold level .this closes the switch, discharge the capacitor and resets the counter. Here we used the IC555 as a voltage controlled oscillator. |
EXPERIMENTAL RESULT & DISCUSSIONS
|
| When we used Diesel as a fluid .frequency is decresing very gradually but in case of water frequency was decreasing very rapidly.this is due to different dielectrics of fluid and realative permittivity. We obseved the different frequency at diffent level and also observed the different range of frequency for different types of fluid. Every fluid have its own dielectric so the relative permittivity becomes changes on changes the fluid.here we observed the data to consider two fluid (water,diesel).we oserved the diffent range of frequency in each case.i performes this result ti take a stainless steel rod of length(150cm).i select the single rod in cylindrical shape diameter(1.2 cm).The insulated electrode is built with a PTFE (commonly known as (Teflon) insulated wire whose nominal internal and external diameters are 1 mm and 1.5 mm[5]. I plot the graph between the increasing level of water and its corresponding frequency. The observed of frequency continuous decreasing on increasing level of water due the variation in capacitance increases on increasing level of fluid. So we observed data continuously on each 1(cm) scale. We observed very precisely. |
| A. Diesel level column vs. frequency reading |
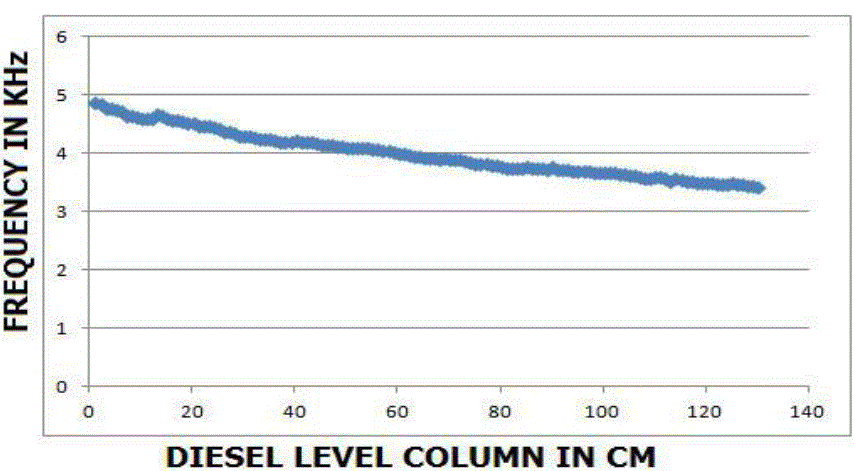
| Observations are listed below where we show the height of water column and corresponding frequency. Here we took observation these are the basically frequency reading with respect to the level of fluid in the tank. We observed here that on increasing level of fluid, the frequency is decreasing recorded these reading by oscilloscope. These are reading for water. We perform the experiment four times when we start the experiment first time we observed very good frequency response. After that some changes occur even response is too good. Here we showed 105 cm fluid level and continuous monitoring the frequency on each cm. After observing this record, I made the display (bar graph display [6][7] to show the level of fluid(diesel) in the tank. We have various frequency on various level .some point are in the recorded data that we observe the large change. It can be due to some external physical condition (temperature, pressure etc). It is very sensitive so at the time of measurement we should take proper precautions. |
| Here we calibrated the result up to 30 cm these are the reading for diesel. In case of diesel the frequency is decreasing gradually. But in case of water the frequency was decreasing very rapidly. We observed the more drift between actual level and matured level. Plot graph between diesel level and frequency |
| These are the observations .frequency is decreasing gradually on increasing the level of diesel. But in case of water frequency was decreasing rapidly. In all the three observation not obtain the more drift. Frequency is decreasing gradually. Data recorded by digital storage oscilloscope. |
| B. Comparison analysis between actual level and measured level |
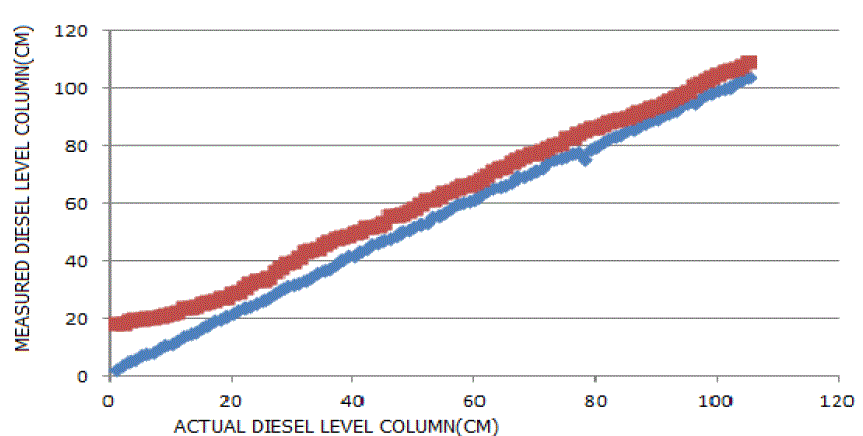
| Here we compared the actual level and measured level. Red line in graph showed the measured level of fluid and blue graph showed the actual level’s observed there is no more difference in the actual level and measured level. at starting point of graphs makes some difference because the line of graph not fully overlapped to each other. But when the level of fluid starts increasing the measured level is overlapped not fully but very close. This small difference due to variation of physical condition .it is too precise and accurate. We indicate the level in centimetre scale. Axis of graph showed the actual level and y axis showed the measured level .we measured it up to 115cm (approximate).we observed these reading after using capacitive sensing module made by 150 cm stainless steel rod and insulated Teflon cable .i selected the stainless steel rod as hollow cylindrical shape. After drilling bottom of this rod made a hole of 5mm diameter .in case of diesel we plot the graph for diesel level. |
CONCLUSION
|
| The objective of the work presented in this paper is to design and implement capacitive sensor interface with emphasis on maximizing the performance in relation to the costs. Here we made continuous level measurement To begin with; some typical applications and sensor elements are considered for this design. Next, the electrical properties of the capacitive sensors are characterized as accurately as possible. Then, the most important interface requirements for different applications are considered and the performance.Therefore, the number of modes should be kept to a minimum, with a minimum sacrifice of performance and application range. By analyzing the charge-transfer time constant, we found that the integrator current needs to be programmable. The oscillator frequency, which is inversely proportional to this current, can be set by the user to optimize the interface performance for user-specific applications. In addition to this, a programmable digital divider is available to match the data acquisition rate with the bandwidth of the physical sensor signal. Finally, with an off-chip capacitor, the user can set a desired capacitor range. Often, capacitive sensor elements are connected to the electronic interface circuitry with long wires consisting of cables. To reduce the effects of interference, these connecting wires or cables are shielded. Provisions have to be taken to prevent the parasitic capacitances of these cables from forming direct shunting components for the sensing elements, because without such provisions any changes in these parasitic capacitances would seriously degrade the sensor-system performance. When the capacitive sensor elements are floating, i.e. when none of the terminals have been connected to ground, then they can be read by interface circuits that are intrinsically immune to stray capacitances.However, safety reasons and/or operating limitations might require one of the electrodes of the sensing elements to be grounded. Here we observed that capacitive sensing module is good but it becomes much effect due to physical environmental condition. We tried to overcome all these problems so we observed very precise and accurate result. We have successfully experiment the system in lab. Resolution is defined as the smallest reliable measurement that a system can make. The resolution of a capacitive sensing system is better and the final accuracy the measurement requires. |
Tables at a glance
|
|
|
Figures at a glance
|
 |
 |
 |
 |
| Figure 1 |
Figure 2 |
Figure 3 |
Figure 4 |
 |
 |
 |
| Figure 5 |
Figure 6 |
Figure 7 |
|
References
|
- Microcontroller chip Technology, 89c2051 Datasheet
- P. Dietz, W. Yerazunis, D. Leigh, Very Low-Cost Sensing and Communication Using BidirectionalLEDs UbiComp 2003: Proceedings, vol. 2864, pp. 175-191, 2003
- M. Javanmard, K.A. Abbas and F. Arvin, “A Microcontroller-Based Monitoring System for Batch Tea 2009 Dryer”, CCSE Journal of Agricultural Science, Vol. 1, No. 2, December
- Baxter L. K., Capacitive sensors. Design and applications, IEEE Press, New York, 1997.
- Ross P. J., A water-level sensor using a capacitance to frequency converter, J. Phys. E: Sci. Instrum., 1983, Vol. 16, pp 827-828.
- Deng, H., Chang, X.: General 8 Chapter LED Number Display Device
- Deng, H., Li, Z.: A Design of Large Eight Burst LED Display of Compatibly Common Applications, p. 191. China Machine Press, Beijing 2009
- Guo T, Zhao Q D, Dou Q Y, et al,” Temperature-insensitive fiber Bragg grating liquid level sensor based on bending cantilevel beam,”IEEE Photon Technol Lett,2400–240,2005.
- Jose E A L, Daniel A M A, Patrick L K W,” Fibre-optic liquid-level sensor,” IEEE Photon TechnolLett, 2011.
- Baxter L. K., “Capacitive sensors. Design and applications, “IEEE Press, New York, 2010.
- Ross P. J., “A water-level sensor using a capacitance to frequency converter, “J. Phys. E: Sci. Instrum, Vol. 16, pp 827-828 ,2012.
- Meijer G. C. M., van der Goes F. M. L., De Jong P. C., Li X., Toth F. N.,”Integratedinterfaces for low-cost multiple-sensor systems, Journal of Intelligent Material Systems Structures, Vol. 10, pp 105-115,2008.
- Reverter F., Li X., Meijer G. C. M., “Stability and accuracy of an active shielding for grounded capacitive sensors, “Meas. Sci. Technol.in press).
- Wilner L. B., “Variable capacitance liquid level sensor, Review of Sci. Instrum.,” Vol. 31 (5), pp 501- 50507,2006.
|