Keywords
|
| spatial trend analysis, spatial association access methods, Multi media images, Forest fire |
INTRODUCTION
|
| Mining important patterns and association rules from data set with images and meteorological based data will give major significance in forestry. Forest fires create constant threats to ecological systems, social system and wild lives [1][3]. Hotspots (active fires) indicate spatial distribution of fires. A study on determining influence factors for fire occurrence is essential so that fire events can be predicted based on characteristics of a definite forest area[1]. Nearly 19.27% or 63.3 million hectare of the Indian land has been classified into forest area as per the report of the Forest Survey of India [3]. Thus forests look enormous difficulty in soil erosion and loss of wild life. |
| Indian forests are also in risk due to the forest fires primary to their degradation [3]. Fires caused huge damage in the year 2007 affecting huge territories besides notable number of human sufferers [3]. Forest fires create constant threats to ecological systems, social system and wild lives [3]. In this paper we are using meteorological dataset with images properties indicating dry forest area with temperature |
II .LITERATURE SURVEY
|
| The application of remote sensing is at present a significant method for forest fires monitoring, particularly in vast and remote areas [2]. Predicting natural hazards using satellites has begun in 2000, and it has changed the way natural disasters are being assessed. Satellite images provides almost real-time data for forecaster to predict natural hazards, atmospheric interfering such as clouds, smoke and smog grounds distortions in the images retrieved [3]. |
| K.Angayarkkani, Dr.N.Radhakrishnan have proposed an intelligent system for predicting presence of forest fire by Artificial Neural Networks. Researchers involved a system to detect the presence of forest fires in the forest spatial data using Artificial Neural Networks. The digital images in the forest spatial data are transformed from RGB to XYZ colour space and then segmented by employing anisotropic diffusion to identify the fire regions. Subsequently, Radial Basis Function Neural Network is employed in the design of the intelligent system, which is trained with the colour space values of the segmented fire regions [3]. But in this paper we are proposing a system which can predict the occurrence of fire using spatial databases and association rule mining. |
| A spatial association rule is of the form A?B (s%, c%), where A and B are sets of spatial or non-spatial predicates, s% is the support of the rule, and c% is the confidence of the rule [1]. |
| Meteorological information is used for the prediction of fire assessment, monitoring and management of the forest resource. Forest Risk factor can be predicted by temperature, humidity, dryness of wood & other factors [7].Image mining will help in generating predictive models for detection of spatial process in cost effective manner [8]. |
ASSOCIATION RULE, SPATIAL CLASSIFICATION AND SPATIAL TREND ANALYSIS
|
| The association rules are used to analyse fire. An association rule is inference expression of the form A?B, Where A and B are the disjoint item sets of meteorological data. The strength of an association rule is measured with support, confidence values. Correlation analysis (cosine value) is obtained in order to analyse the relationship between variables viz., dry vegetation of forest, temperature and wind pressure. |
| ? Support can be given as |
| Support (A?B)=P(AUB).------------(1) |
| ? Confidence can be given as |
| Confidence (A?B)=P(B|A)---------(2) |
| Support is the percentage of transactions of meteorological data in dataset D, that contains both A and B item sets. Where confidence is the percentage of transactions in D containing A that also contain B [1].Correlation between A and B is defined for a rule A ?B as |
| Cosine (A,B)= P(AUB)/ sqrt((P(A)*P(B)) |
| Spatial classification analyzes spatial objects to derive classification schemes which are relevant to spatial properties like water area near or far to dry wood vegetation .Spatial trend analysis deals with detection of changes and trends along a spatial dimension. Trend analysis detects changes with time. Temperature is always related to time and space. |
| Association rule is of the form X?Y[s% ,c%],where X and Y are the sets of spatial predicates .s% gives support for rule and c% gives confidence[6]. Spatial association rules differ with non-spatial association rules because it may contain spatial predicates such as distance information (for instance, close_to, and faraway), topological relations (for example, touch, overlap, and intersect), and spatial orientation (such as right of, and east of)[1]. |
| An example of spatial association rule is as follows: x is a school ?x close to a sports center ? x close to a national park (0.5%, 75%)[6].The rule says that 75% of school that are close to sports center are also close to national park, and 0.5% of the data belong to such a rule[1]. |
IV.IMPLEMENTATION AND RESULTS
|
| The following values are considered for the association rule mining, by considering the temperature and wind pressure in summer season. The same values are used for spatial trend analysis. |
| In the table 1, Temperature (T) is considered with different categories. They are Moderate, high, very high and is measure in Celsius. Temperature T between 20 to 30 is considered as moderate temperature, T between 31 to 40 Celsius is high and T more than 40 Celsius is considered as very high temperature. |
| In table 2, wind speed give the description of the wind speed considered. Wind speed till 29 km/hr is considered as fresh wind. Wind speed between 28 to 75km/hr is strong wind, and between 75 to 115 km/hr is storm and more than 115km/hr is hurricane. |
| The association rule extracted from continues variables, temperature (table 1) and wind speed (table 2) with dry forest are |
| 1. Dry forest=yes}?{T<30andWS<75} |
| Support, Confidence, correlation ={20%,40%,0.6} |
| 2. {dry forest=yes}?{T<40andWS<115} |
| Support, Confidence, correlation ={40%,60%,1.02} |
| 3. {dry forest=yes}?{T>40and WS>115} |
| Support, Confidence, correlation ={50%,80%,1.2} |
| In the rule 1 the correlation value obtained is 0.6, for support of 20% and confidence of 40%, which is a positively correlated. Temperature value T is less than 30 Celsius. And wind pressure is less than 75 km/hr. |
| In the rule 2 the correlation value obtained is 1.02, for support of 40% and confidence of 60%, which is a positively correlated. Temperature value T is less than 40 Celsius. And wind pressure is less than 115 km/hr. |
| In the rule 3 the correlation value obtained is 1.2, for support of 50% and confidence of 80%, which is a positively correlated. Temperature value T is greater than 40 Celsius. And wind pressure is greater than 115 km/hr. |
| Both the rules have given the positive correlation. From rule3 the support and confidence values are more than rule 2.This suggests that, If temperature is very high, fire will occur in the dry vegetation forest. |
| Further rule 1,2 and 3 can be used to obtain the better result with spatial trend analysis for fire occurring temperature analysis and loss of vegetation. |
| The Spatial Association for meteorological data present in table 1 and 2 is given as follows |
| 1. Is_a(A,”dryvegetation”)and(”A,”Moderate_Temparature<=30centigrade)and(WS<75=>presenceof(A,”fire”) [0.2%,40%] |
| 2. Is_a(A,”dryvegetation”)and(”A,”High_Temparature<=40 centigrade and (W>75&<115))=>presence of(A, ”fire”) [0.3%,75%] |
| 3. Is_a(A,”dryvegetation”)and(”A,”VeryHigh_Temparature>40 centigrade)and (WS>115))=>presence of(A,”fire”) [0.5%,90%] |
| In the above spatial rule1, support and confidence values are 0.2%, 40% respectively. Hence we can predict that less chances of fire occurrence in that region. Fire danger rate is also less. Loss of vegetation is also comparably very less. |
| Rule2 gives support of 0.3% and confidence 75% in dry forest. We can predict that more chances of fire occurrence in that region. Fire danger rate is also more. Loss of vegetation is also comparably more i.,e nearly 100ha of wild land |
| Rule3 gives maximum support 0.5% and confidence 90%, in dry forest. The temperature value is more than 40 centigrade and wind speed more than 115km/hr. |
| From this rule 3 the at very high temperature fire occurs in dry forest with 90% of confidence. |
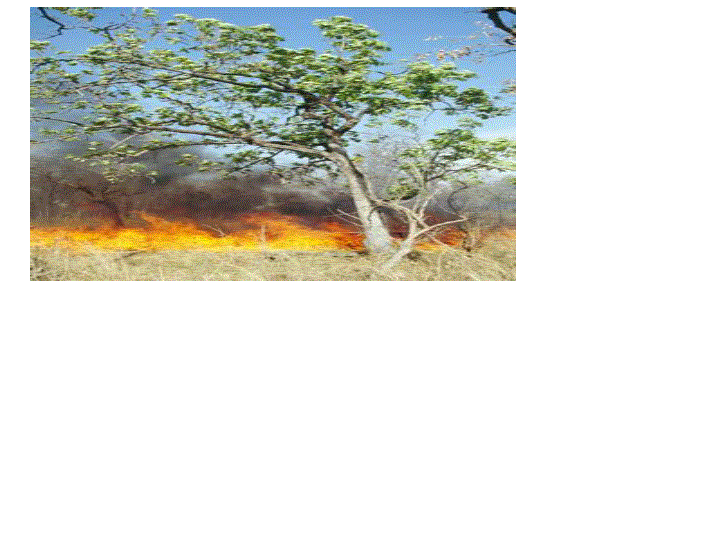
| Analysis of the spatial rules is done by considering properties of images with dry forest fire (figure1) at the temperature 40 centigrade. |
| The table 4 gives image properties; Image considered is dry wood forest area of India with vertical and horizontal resolution of 300. Temperature is categorized into low, medium and high. Fire rate is predicted from Spatial association rule by considering the image properties as the input, conjunctive rule is applied for spatial association verification. |
| Each algorithm gives a set of positive and negative events that it detects, which is validated using fire perimeter polygons to obtain the number of true positives (TP), false positives (FP), false negatives (FN) and true negatives (TN) for each algorithm. |
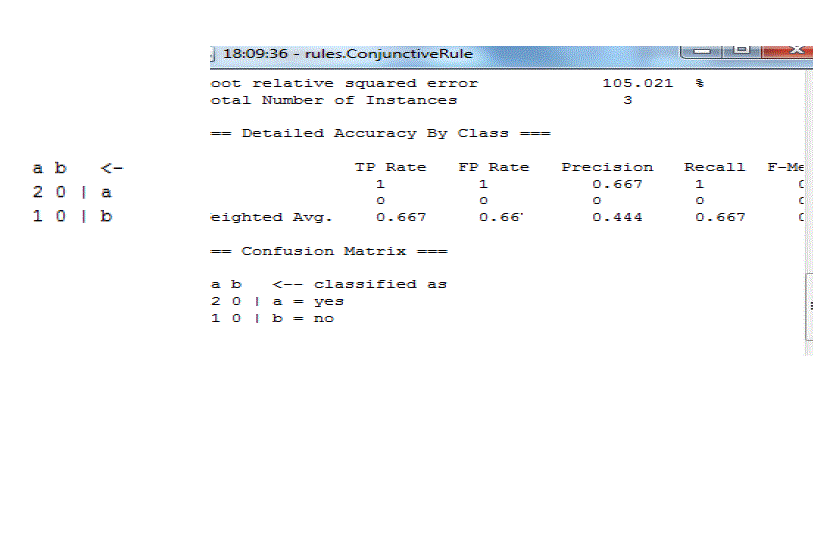
| From the results, true positive rate is 0.667 and false positive rate is 0.66.The precision and recall values for each algorithm are given by: |
| Precision, p = TP/TP + FP=0.44 |
| Recall, r = TP/TP + FN=0.667 |
| The result also can be depicted by a confusion matrix. A confusion matrix gives accuracy solution to a classification. A confusion matrix has the information about actual and predicted classifications. Performance of the systems is commonly evaluated using the data in the confusion matrix. Fire occurrence is classified as a and b where a stands for ‘yes fire occurs’ and b stands for ‘fire will not occur |
| In the firure2 Category of fire is shown, ‘a’ gives fire will occur with ‘yes’ and ‘ b’ gives fire will not occur ‘no’. The expected fire occurrence is given by product of fire occurrence and no fire. |
| count (a )* count (b)/N= 2*1/3=0.66 |
| The table 5 shows the comparison of both the methods. The results depicts that the predicted fire rate is almost near to the actual value. From the comparison of results we can predict that in moderate temperature, there will be less fire danger rate. |
| Whereas temperature greater than or equal to 40 Celsius (high and very high temperature) can cause fire with large amount of vegetation loss |
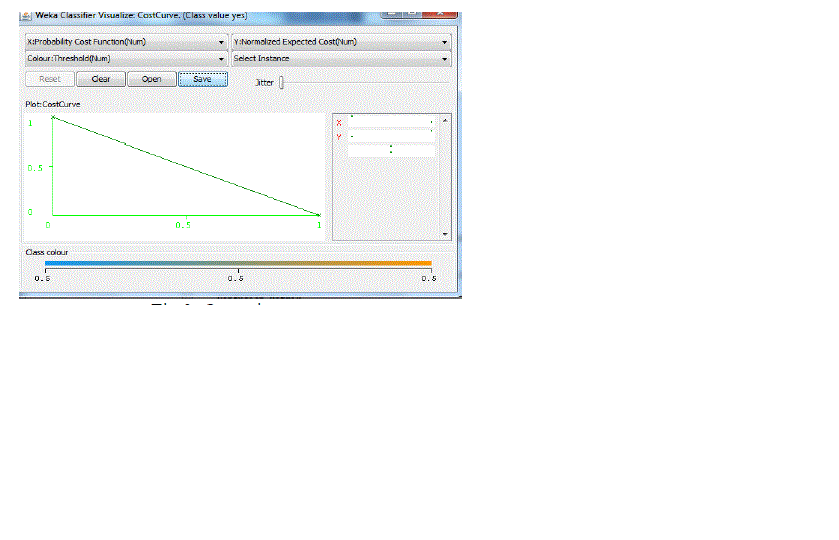
| Figure 3 shows the operation curve, which gives the relation between true and false positive rate. The horizontal axis have false positive and vertical axis has true positive. This shows the increase in fire danger rate as temperature increases. It is clear that if fire occurs for 40C, then progressive refinement can be achieved with spatial classification analysis for next fire occurring area. |
V.CONCLUSION
|
| Here two types of spatial relationships are used namely meteorological data and image property sets. These meteorological data and image property sets applied to relate spatial features with association rules. Pre-processing steps were conducted on the meteorological data sets by considering temperature, wind speed. The analysis with the minimum support of 0.5% and the minimum confidence of 90% shows strong relations among fire occurrence. Forest fire danger rate with dryness of wood is predicted as 40C. |
Tables at a glance
|
 |
 |
 |
 |
 |
| Table 1 |
Table 2 |
Table 3 |
Table 4 |
Table 5 |
|
| |
Figures at a glance
|
 |
 |
 |
| Figure 1 |
Figure 2 |
Figure 3 |
|
| |
References
|
- ImasSukaesihSitanggang” Spatial Multidimensional Association Rules Mining inForest Fire Data” Journal of Data Analysis and InformationProcessing, 2013, 1, 90-96 Published Online November 2013 .(http://www.scirp.org/journal/jdaip)
- Ku Ruhana Ku-Mahamud,KhorJia Yun ,Pattern Extraction and Rule Generation of Forest Fire Using Sliding Window Techique,internationaljournal of Computer and Information Science,Vol.2,No.3,Aug-2009.
- K.Angayarkkani, Dr.N.Radhakrishnan An Intelligent System For Effective Forest Fire Detection Using Spatial Data ,(IJCSIS) InternationalJournal of Computer Science and Information Security,Vol. 7, No. 1, 2010.
- Data Mining Introductory and Advanced Topics by Margaret H.Dunham, Association Rules pg no178-205, and Spatial mining pg no 235-255,low price edition, Pearson Education
- Aggraval, R. et al.: Fast Discovery of Association Rules. In Fayyad, U.M. et al.: Advances in Knowledge Discovery and Data Mining, pp. 307-328, AAAI Press / MIT Press, 1996.
- Data Mining Concepts and techniques by Jiawei Han and MichelineKamber,Second Edition Elsevier,Chapter 10,pg600-613.
- S.Nandagopal, S.Karthik, V.P.Arunachalam,”Mining of Meteorological Data Using Modified Apriori Algorithm”, European Journal of ScientificResearch, ISSN 1450-216X Vol.47 No.2 (2010), pp.295-308.
- Dr.CJothiVenkateswaran. S.Murugan, Dr. N. Radhakrishana, An Useful Information Extraction using Image Mining Technqiues from RemotelySensed Image,International Journal on Computer Science and Engineering, Vol. 2, No. 8, 2010, 2577-2580.
|