Research & Reviews: Journal of Pharmaceutical Analysis
e-ISSN: 2320-0812
e-ISSN: 2320-0812
Bhavna Chandnani*
Department of Pharmaceutical Analysis, Institute of Chemical Technology, Mumbai, India
Received: 28-Aug-2023, Manuscript No. JPA-23- 88388; Editor assigned: 31-Aug-2023, PreQC No. JPA-23- 88388 (PQ); Reviewed: 14-Sep-2023, QC No. JPA-23- 88388; Revised: 21-Sep-2023, Manuscript No. JPA-23- 88388 (R); Published: 28-Sep-2023, DOI: 10.4172/2320-0812.12.3.006
Citation: Chandnani B. Implementation of Quality by Design Approach to Analytical Method Development and Validation for Estimation of Morniflumate Pharmaceutical Dosage Form. RRJ Pharm Anal. 2023;12:006
Copyright: © 2023 Chandnani B. This is an open-access article distributed under the terms of the Creative Commons Attribution License, which permits unrestricted use, distribution, and reproduction in any medium, provided the original author and source are credited.
Visit for more related articles at Research & Reviews: Journal of Pharmaceutical Analysis
The effectiveness of Nonsteroidal Anti-Inflammatory Drugs (NSAIDs) for the management of pain in osteoarthritis and other Musculoskeletal diseases in well documented. The role of NSAIDs is less clear in the treatment of condition involving soft tissues inflammation, including the airways, Ear-Nose-Throat (ENT) system and urogenital tract. Morniflumate has a 30 year history of clinical use, particularly for the treatment of pain associated with pediatric ENT infection.
A simple, rapid, accurate and precise RP-UPLC analytical method with UV detection has been developed for determination of morniflumate in API and tablet dosage form. A QBD (Quality by Design) approach was successfully applied. The method was validated accordance to ICH guidelines. The objective of this present study was to develop and demonstrate an integrated QBD (Quality by Design) approach to develop and validate the method for morniflumate estimation in dosage form. The drug was subjected to alkali, acidic, oxidative degradation stress. All the peaks of degraded products were resolve from standard drug peak condition.
Morniflumate; Accuracy; Precision; Liquid chromatography
“Quality by Design(QBD)” although a new concept to the pharmaceutical industry is a tried and tested concept that has been existence for quite a few years has been extensively applied in the automotive the semiconductor, and the petrochemical industry [1]. QBD is defined as “a systemic approach to development that begins with predefined objectives and emphasis product and process understanding based on sound science and quality risk management” (ICH Q8R2). The fundamental prerequisite of a QBD approach to product, process, design, or indeed an analytical method is to pre defining the objectives. It impacts conventional method performance characteristics such as accuracy, precision, linearity, etc. The Analytical Target Profile (ATP) is essentially used to describe method requirements needed to adequately measure the defined critical quality attributes of the API or Drug products. The concept of building quality into products has been extensively documented by Deming and juran [2]. ICH guidelines Q8 (on pharmaceutical development), Q9 (on quality risk management) and Q10 (on pharmaceutical quality system) provide some assistance for manufactures to implement quality by design into their own operations. The ICH steering committee meets twice a year to discuss the progress of its efforts. This practical input should help ensure that quality risk management and knowledge management are used to make lifecycle adaptions that maintain process control and product quality.
High/ultra-performance liquid chromatography is a special branch of column chromatography. It evolved over nearly a century from the early work of Tswett in the late 1900s to the highly sophisticated reliable and fast Liquid Chromatography (LC) techniques in common use today. This problem was largely overcome by the advent of HPLC. HPLC is characterized by the high pressure to push a mobile phase solution through a column of stationary phase allowing separation of complex mixtures with high resolution. In the system pressure is applied to the column, forcing the mobile phase through at much higher rate [3]. UPLC as compared to HPLC brings improvement in sensitivity, resolution and speed of analysis. It has instrumentation that operates at high pressure than that used for HPLC. Additionally this system uses fine particles (less than 2.5 µm) and mobile phase at high linear velocities decrease the length of column, reduces solvent consumption and save time.
Validation parameter
Selectivity and specificity: If an analytical procedure is able to separate and resolve the various components of a mixture and detect the analyte qualitatively the method is called selective. On the other hand, if the method determines or measures quantitatively the component of interest in the sample matrix without separation, it is said to be specific. Hence one basic difference in the selectivity and specificity is that, while the former is restricted to qualitative detection of the components of a sample, the latter means quantitative measurement of one or more analytes [4].
Linearity and range: The linearity of an analytical method is its ability to elicit test results that are directly proportional to the analyte concentration in samples within a given range. Linearity usually expressed in terms of the variance around the slope of regression line.
The range of an analytical method is the interval between the upper and lower levels of the analyte that have been demonstrated to be determined with precision, accuracy and linearity using the method as written [5-8].
Accuracy: The accuracy of an analytical method may be defined as the closeness of the test results obtained by the method to the true value. Accuracy may be determined by applying the method to samples or mixtures of excipients to which known amount of analyte have been added, both above and below the normal levels expected in the sample. Accuracy is then calculated from the test results as the analyte recovered by the assay.
Precision: The precision of an analytical method is the degree of agreement among individual test results when the method is applied repeatedly to multiple sampling of homogeneous samples. This is usually expressed as the standard deviation or the relative standard deviation (coefficient of variation). Precision is a measure of the degree of reproducibility or of the repeatability of the analytical method under normal operating circumstances (Tables 1-4).
| Parameter | Description |
|---|---|
| Drug substance | Morniflumate |
| Chemical name | 2-morpholin-4-ylethyl 2 {[3-(trifloromethyl) anilino] pyridine-3-carboxylate |
| Structure | 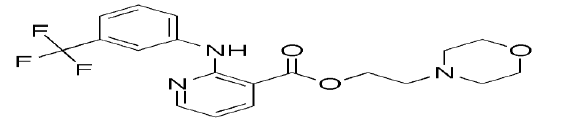 |
| Molecular formula | C19H20F3N3O3 |
| Molecular weight | 395.38 gm/mole |
Table 1. Physical properties of morniflumate.
| Parameter | Description |
|---|---|
| Solubility | Pale yellow to whitish crystalline powder.Soluble in dichloromethane and in chloroform. Partly soluble in methanol and insoluble in water. |
| Log p | 3.7 |
| Melting point | 76ºC-78ºC |
| Identification | IR |
| Storage | Store in a cool and dry place. |
Table 2. Physico-chemical properties of morniflumate.
| Category | Non-steroidal Anti-Inflammatory Drug (NSAID) |
|---|---|
| Mechanism of action | Inhibits COX1 and COX2 |
| Use | Anti-inflammatory, Gastro protective, In Rheumatoid Arthritis |
Table 3. Pharmacology of morniflumate.
| Brand of company | Dosage form | Brand name | Strength |
|---|---|---|---|
| Cheisi farmaceutici, Italy | Tablet | Flomax | 350 mg |
| Savio I.B.N., Italy | Tablet | Flumarin | 700 mg |
| Bristol Myers squibb, spain. | Capsules | Niflactol | 250 mg |
| Bristol Myers squibb, Italy | Capsules | Niflam | 250 mg,500 mg |
Table 4. Introduction of dosage form.
Types of analysis
Qualitative analysis: The Qualitative analysis identifies the nature of substance, and if it is mixture, the nature of the components present [9,10].
Quantitative analysis: The Quantitative analysis determines the elemental composition of the substance and the quantitative distribution of each component. The pharmaceutical analysis plays a major role in assuring the identity, safety, efficacy and quality of the drug product (Figure 1).

Figure 1: Various method of pharmaceutical analysis.
Normal phase chromatography
Mechanism: Retention by interaction of the polar surface of stationary phase with polar parts of the sample molecules.
Stationary phase: It is a bonded siloxane with polar functional groups like SiO2, Al2O3, -NH2, -CN, -NO2, -diol.
Mobile phase: Nonpolar solvents like heptanes, hexane, cyclohexane, chloroform, ethyl ether, and dioxane.
Application: Separation of nonionic, nonpolar to medium and polar substances.
Sample elution order: Least polar components are eluted first.
Reverse phase chromatography
Mechanism: Retention by interaction of the nonpolar hydrocarbon chain of stationary phase with nonpolar parts of sample molecules.
Stationary phase: It is bonded siloxane with nonpolar functional groups like n-Octadecyl (C18) or n-octyl (C8), ethyl, phenyl, - (CH2) n-diol, - (CH2) n-CN.
Mobile phase: Polar solvents like methanol, acetonitrile, water or buffer (Sometimes With additive of THF or dioxane)
Application: Separation of nonionic and ion forming nonpolar to medium polar substances.
Sample elution order: Most polar components are eluted first (Figure 2).

Figure 2: Basic parts of HPLC/UPLC instrument.
A HPLC/UPLC system is basically composed of
• Injector
• Column
• Column oven
• Detector
• Pump
As the number of theoretical plates is related to the surface area of the stationery phase it follows that the smaller the particle size of the stationary phase, the better the resolution [11-14].
UPLC system
• Model- Acquity H-class
• Make-Waters.
• Column-Acquity uplc BEH C8 column
• Pump-Isocratic
• Detector-(TUV) Tunable UV detector
Infra-red spectrophotometer
• Model- Cary 630 FTIR
• Make- Agilent Technologies
• Scan Range- 400 cm-1-4000 cm-1
Analytical balance
• Model- AUX 220
• Make- Shimadzu.Japan
• Maximum capacity- 220 g
• Minimum capacity- 10 mg
PH meter
Model- pH METER CL 54+
Make- Toshcon Industries Pvt.Ltd, Haridwar
Sonicator: Ultrasonic Cleaner, Make- M.Shah Trading, glass stoppered tubes, pipettes- 1ml, 2 ml, 3 ml, 10 ml, volumetric flasks- 10 ml, 25 ml, 50 ml, 100 ml (Borosil).
UPLC method development
Design execution and optimization: Box-Behnken statistical screening was used to optimize the compositional parameters and to evaluate interaction effects and quadratic effects of the chromatographic conditions on the Retention Time (RT) and tailing factor [15-18].
The Box-Behnken design was specifically selected since it requires fewer runs than a CCD in cases of three or four variables. A design matrix comprising of 17 experimental runs was constructed (Figure 3).

Figure 3: Box behnken design.
Screening phase: During the screening phase of method optimization few of factors remain to constant and mobile phase composition which is variable to identify which mobile phase is suitable for optimization (Table 5).
| Factors independent | Lower level (-1) | Intermediate level (0) | Higher Level(+1) |
|---|---|---|---|
| X1 Temperature | 30 | 35 | 40 |
| X2 Flow rate | 0.38 | 0.4 | 0.42 |
| X3 pH | 4.8 | 5 | 5.2 |
| Factor dependent | Y1=1.1<Y1>1.5 Y2=<1.5 |
||
Table 5. Dependent and independent factors of DOE.
Flow rate: 0.40 ml/min. Injection volume: 2 µL, Column temperature: 350 C, Column dimension: C8 BEH (100 mm × 2.1 mm. 1.7 µ), Detection wavelength: 287 nm.
Validation
Linearity and range:
• The linearity of analytical method is its ability to elicit test results that are directly proportional to the concentration of analyte in sample within a given range.
• The range of analytical method is the interval between the upper and lower levels of analyte that have been demonstrated to be determined within a suitable level of precision, accuracy and linearity.
• Linearity study was carried out for morniflumate at five different concentration levels. Appropriate volume of aliquots form standard morniflumate stock solutions was transferred to same volumetric flasks to 10 ml capacity.
• The volume was adjusted to the mark with Acetonitrile give a solution containing 60 ml, 80 ml, 100 ml, 120 ml, and 140 µg/ml morniflumate. The graph was plotted for peak area vs. concentration for morniflumate.
Accuracy:
•Accuracy was best determined by the standard addition method.
•For constant test solution: 2.5 ml of standard stock solution was added in three 25 ml volumetric flask.
•Spiking is done based on 80%, 100%, 120%
•8 ml of standard solution is diluted to 10 ml in volumetric flask to prepare 80 ppm solution.
•10 ml of standard solution is diluted to 10 ml in volumetric flask to prepare 100 ppm solution
•12 ml of standard solution is diluted to 10 ml in volumetric flask to prepare 120 ppm solution
•Area was found and recovery was calculated.
Precision:
•100 ppm solution of morniflumate was injected six times and area was measured and mean area was calculated.
•Interday results were also obtained for 100 ppm next day.
•RSD was calculated for this.
LOD and LOQ:
•Prepare the concentrations of 1 ppm, 5 ppm, 10 ppm of morniflumate in Acetonitrile. And the peak was observed.
•The results are enclosed.
Factors affecting the rate of degradation
Temperature: Rate constant or velocity of degradation to be of use in the formulation of pharmaceutical product. It is necessary to evaluate temperature dependency of the reaction. According to rule of thumb, the rate of reaction is generally said to be doubled for each 100ºC rise in temperature. Increase in temperature cause very pronounced effect in Hydrolysis rate of drug in solution some deterioration reactions are not measurably influenced over 100ºC temperature range. While other undergoes rapid degradative changes. The recommended procedure is to set up. A planned schedule of accelerated tests for each formulation in order to ascertain the temperature dependency of chemical change in the product undergoing evaluation. The room-temperature stability or any lower temperature stability could be extrapolated from accelerated data by using Arrhenius relation. The Arrhenius equation is expressed mathematically as.
K=Ae-Ea/RT
Ink=InA-Ea/RT
Where, k is the reaction rate constant of any order,
R denotes the gas constant (1.987 calories degree-1 mole-1), A is the frequency factor, Ea is the activation energy, and T is the absolute temperature.
PH: The pH of the solution may have drastic effect on its stability. Depending on the reaction mechanism a change of more than tenfold in rate constant may result from a shift of just I pH unit. When drugs are formulated in solution. It essential to construct a pH versus rate profiles so that optimum pH for stability can be located. Knowledge of this pH is extremely useful in the development of formulation Studies of this type can be performed at elevated temperature so that data can be obtained in short time as possible The shift of the maximum stable pH point caused by the temperature elevation is usually not of sufficient magnitude to affect the conclusion drawn from such data.
Presence of oxygen and surfactant: Presence of oxygen and surfactants also to some extent affect the rate of degradation in solution. The presence of surfactant in micellar form has a modifying effect on the rate of hydrolysis of the drug.
The purpose of our stress stability studies is to promote degradation of the API under different forced conditions, to determine degradation products and mechanisms. The intrinsic stability of the molecule and validate the stability indicating power of the analytical procedures used. Towards photo stability and moisture sensitivity, examine packaging material compatibility, and demonstrate the suitability of the chosen analytical method to assess purity of the product. Long term and accelerated stability studies are conducted to determine whether the drug substance with time under the influence of environmental conditions such as temperature and relative humidity. Data obtained will help to determine shelf-life and storage conditions of the pharmaceutical products and will form an important of regulatory authority submissions [19-22].
Drug analysis
Identification: Identification of drugs was carried out by taking appropriate melting point and IR spectra of gratis drugs samples and was compared with standard.
Melting point: It was determined by capillary method. The compound was placed in one end sealed capillary. Then was placed attached to temperature regulating system. Temperature was set by the regulator and temperature at which the last solid particle of compact column of substance in capillary passes into liquid phase was displayed and reported in result section.
IR spectra: An IR spectrum was determined by triturating 1 mg-2 mg of the compound with 300 mg-400 mg KBr. Disc having dimension of 10 mm-11 mm was formed and spread uniformly and subjected to 800mpa pressure. Record the spectra between 4000 cm-1-650 cm-1.
Selection of detection wavelength: Detection wavelength was selected by taking an overlain spectrum of 100 µg/ml of morniflumate in acetonitrile in UV spectrophotometer [23-27].
Results shows, a simple, rapid, accurate, and precise RP-UPLC analytical method with UV detection has been developed for the determination of Morniflumate in active pharmaceutical ingredient and in tablet dosage forms. The method was validated in accordance with ICH guidelines. A Quality by Design approach has been successfully applied for development of RP-UPLC method for estimation of Morniflumate. First, the method goals are clarified based on process understanding. The experimental design describes the Box Behnken design for 17 runs, for 3 parameters including Temperature, pH of buffer and flow rate. Their interrelationships are studied and optimized conditions are obtained from each combination of conditions. Here a better understanding of the factors influencing chromatographic separation and greater confidence in the ability of the method to meet their intended purpose is done. It gives symmetric peak shape, good resolution and reasonable retention for it.