The proactive of a routing protocol to solve the problem of delay in DSDV which is a table-driven routing protocol, applied in wireless Ad Hoc networks. Due to high mobility in wireless networks frequent link failure, delay is a problem in table-driven routing protocols which is cause of increasing delay time and packet loss in such wireless networks. The Proposed DSDV protocol of wireless ad-hoc networks depend on the efficiency of routing protocols, especially the routing metric operating within it. In this paper performance of the recently proposed routing metric traffic bandwidth adjusted expected transmission count (Traffic-BETX) metric is compared with two prominent existing metrics, the expected transmission count (ETX) and the minimum delay routing (MDR) over the destination sequenced distance Vector (DSDV) routing protocol. The performance differentials are analyzed using varying packet rates under heavy traffic. From the simulations results, Traffic-BETX metric outperforms the ETX and MDR metric because it implements the bandwidth sharing mechanism and makes use of the information available at the MAC layer.
Keywords |
| MANET; DSDV Protocol; minimum delay; Quality Link Metrics; Traffic-BETX |
INTRODUCTION |
| One of the important research areas in MANET is establishing and maintaining the ad hoc network through the use of
routing protocols. Though there are so many routing protocols like Ad hoc On Demand Distance Vector (AODV)
routing algorithm is a routing protocol designed for ad hoc mobile networks. AODV is capable of both unicast and
multicast routing. It is an on demand algorithm, meaning that it builds routes between nodes only as desired by source
nodes. It maintains these routes as long as they are needed by the sources. Additionally, AODV forms trees which
connect multicast group members. The trees are composed of the group members and the nodes needed to connect the
members. AODV uses sequence numbers to ensure the freshness of routes. It is loop-free, self-starting, and scales to
large numbers of mobile nodes. The Destination-Sequenced Distance-Vector (DSDV) Routing Algorithm is based on
the idea of the classical Bellman-Ford Routing Algorithm with certain improvements. Dynamic Source Routing (DSR)
is a routing protocol for wireless mesh networks. It is similar to AODV in that it forms a route on-demand when a
transmitting computer requests one. However, it uses source routing instead of relying on the routing table at each
intermediate device. |
II. RELATED WORK |
| The previous approaches include an improved version of AODV routing protocol [9] based on the link cost for multi
rate MANETs. Where each node transmits a repeat request. RREQ (Route Request) with a predefined time to live.
Every RREQ (Route Request) is identified by its sequence number. The first received RREQ (Route Request) is
processed and the duplicates are discarded. This process is repeated for reverse path update. But such regular path
updating causes network flooding, so many generated RREQs (Route Request) may loss and route discovery procedure
may not perform well. Since RREQs (Route Request) are avalanche patters. Another approach [11] is presented as
QAODV (Quality of Service Ad hoc On Demand Distance Vector) to improve the delay in using AODV (Ad hoc On
Demand Distance Vector) when distances between nodes are closer. The approach is based on only bandwidth as a parameter for routing. However bandwidth may not be sufficient to address QOS (Quality of service) for real-time
applications where delay jitters. |
| A number of extensive simulation studies on various MANET(Mobile Ad hoc network) routing protocols have been
performed in terms of control overhead, memory overhead, time complexity, communication complexity, route
discovery and route maintenance [4]. However, there is a severe lacking in implementation and operational experiences
with existing MANET routing protocols. The various types of mobility models were identified and evaluated because
the mobility of a node will also affect the overall performance of the routing protocols. The Existing framework for the
ad hoc routing protocols was proposed by Tao using TAODV (Trusted aware Ad hoc On Demand Distance Vector) [2]
protocol. This protocol distance based node set. Another OLSR(optimized link state routing) is a proactive link-state
routing protocol, which uses hello and topology control (TC) messages to discover and then disseminate link state
information throughout the mobile ad hoc network. Topology broadcast based on reverse-path forwarding (TBRPF) is a
link-state routing protocol for wireless mesh networks. The obvious design for a wireless link-state protocol (such as
the optimized link-state routing protocol) transmits large amounts of routing data, and this limits the utility of a linkstate
protocol when the network is made of moving nodes. The number and size of the routing transmissions make the
network unusable for any but the smallest networks. |
III. PROPOSED ALGORITHM |
| New paths must rapidly be found in situations where paths with minimum quality could not be found in due time as a
result of high mobility. Moreover, in some wireless ad-hoc networks (static networks or mesh networks) where
mobility is not an issue it may choose paths with low throughput and poor medium utilization. To overcome the
limitations of the minimum hop count various link quality metrics have been proposed in literature. The existing
protocol use Expected Transmission Count (ETX) metric that predicts the average number of data frame and ACK
frame transmissions necessary to successfully deliver a packet over a wireless link. ETX selects routes with better
delivery ratios as compared to the hop count, thus increasing the throughput. According to the original ETX, it is
inversely proportional to the expected probability that a transmission is successfully received and acknowledged.
Therefore, the Traffic Bandwidth Adjusted Expected transmission count metric is defined as the probability of
successful packet transmission. Both only capture link loss ratio ignoring the interference experienced by the links
which has a significant impact on the link quality and the data rate at which packets are transmitted over each link.
They do not consider differences in transmission rate. As the transmission rate of probe packets is typically low, they
do not accurately reflect the loss rate of actual traffic. An important factor often neglected in most of existing metrics is
that routing in multi-hop wireless networks can significantly be improved by cross-layering with lower layers. The
motivation behind this work is that a better understanding of the relative merits of the Traffic Bandwidth adjusted ETX
(Traffic-BETX) metric will serve as a cornerstone for development of more effective one. |
| A. Quality Link Metrics |
| The Quality link launching the idea of quality routing by proposing ETX. In this section, we discuss five QLMs, among
all are based on ETX except MD. A detailed study on ETX-based metrics can be found. |
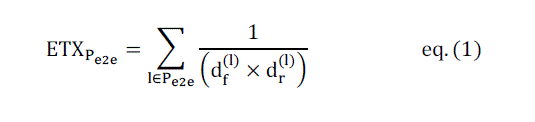
| Expected Transmission Count |
| ETX Forward and reverse loss rates and link asymmetries of the links are measured by calculating the loss probabilities
of links by broadcasting probe packets. In this approach, each node is supposed to periodically send out broadcast
probe packets only to the neighbors without any retransmission. Nodes track the number of successfully received
probes from each neighbor during a sliding window time; 10 seconds, and include this information in their own probes.
Nodes can calculate reverse loss probability dr, directly from the number of probes they receive from a neighbor in the
time window, and they can use the information about themselves received in the last probe from a neighbor to calculate
forward loss probability; df. |
 |
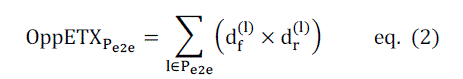
| Opposite Expected Transmission Count |
| OppETX remarkably avoids the computational overhead and thus achieves least delay. ETX calculates the inverse of
probability of success (product of forward and reverse probabilities) but as the names implies, OppETX directly
computes probabilities |
 |
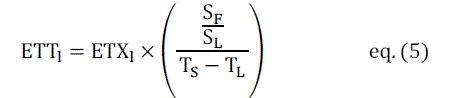
| Expected Transmission Time |
| ETT: of a link as a “bandwidth-adjusted ETX” is defined In below. Authors consider the link bandwidth to obtain the
time spent in transmitting a packet. They start with ETX and divide by with link bandwidth. Let S denote the size of the
packet and B the bandwidth (raw data rate) of the link l. Then: |
 |
 |
 |
 |
| Forward and reverse loss rates of links are measured in ETX portion of ETT. These lost rates are calculated through
broadcast prob packet. The problem of determining the bandwidth of each link is more complex. For the measurement
of bandwidth, ETT uses the technique of packet pairs, i.e, after every minute, each node is supposed to send two backto-
back probe packets to each of its neighbors. First probe of size of 137 bytes, while the second probe packet is
comparatively heavier and is of 1137 bytes. Upon receiving these two probes, neighbor measures the time difference
between the reception of the first and the second probe and acknowledges the sender with the difference. To estimate
the bandwidth, sender takes the minimum of 10 consecutive samples and then divides the size of the second probe
packet by the minimum size sample. |
| B. Traffic Bandwidth Adjusted Expected transmission count |
| The path selection based on the ETX metric often may lead to poor performance due to the fact that it does not consider
differences in the transmission rates of the links. As it does not consider the load of the link, it will route through
heavily loaded nodes leading to unbalanced resource usage. Better paths can be obtained by characterizing the actual
quality of wireless link, the authors propose the Traffic-BETX metric. It is a threefold metric. It firstly calculates the
Expected Link Delivery (ELD), exp d that avoids the overhead as generated by the ETX and bypasses congested
regions in the network; this part of the Traffic-BETX metric finds paths or routes with a lower number of
retransmissions that may be used for onward delivery of data packets. In wireless networks, slow links receive more
time to transmit compared to the fast ones, therefore it provides the nodes with the information of nominal bit rates and
makes them to compute the Expected Link Bandwidth (ELB), exp b of all the wireless links in the same contention
domain using a cross-layer approach. Finally, Traffic-BETX overcomes long path penalization of ETX by calculating
the interference referred to as Expected Link Interference (ELI), exp I .The IBETX metric is defined as follows: |
 |
| For a bidirectional wireless link (m,n) the expected link delivery exp d is obtained by |
 |
| Where f d is the forward delivery ratio which is the measured probability that a data packet successfully arrives at the
receiver and r d is the reverse delivery ratio which is the probability that the acknowledgment packet is successfully
transmitted. The delivery ratios are measured using link layer broadcast probes, which are not acknowledged at the
802.11 Medium Access Control (MAC) layer. Each node broadcasts a probe packet of 134 bytes every second and also
remembers the number of probe packets received from each neighbouring node over the last 10 seconds. Once this information is obtained, the expected link delivery for all the wireless links from that node to its neighbours is
calculated. The expected link Bandwidth exp b captures the bandwidth sharing mechanism of 802.11 Distributed
Coordination Function (DCF); it also considers the accurate throughput reduction of the faster links as a result of
slower ones. Moreover, exp b also takes into account the longer paths that are ignored by the ETX and ETX-based
metrics. For a link (m,n) , the expected link bandwidth is given by: |
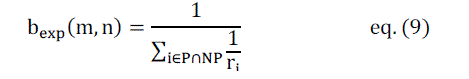 |
| In the above expression, P is the source destination path or route and NP is the non-source destination path, i r is the
nominal bit rate of the ith link in the domain P NP which is the set of links in path P that contend with the link (m,n) .
Since the probes used to calculate the delivery ratio are very small in size, they are successfully received even in a
congested network, thus depicting the wrong image of link qualities. It is an expected value calculated by all the nodes
on the same source-destination path. The 802.11 MAC is the Distributed Coordination Function (DCF) which besides
enabling the nodes to sense the link before sending data, also avoids collisions by employing virtual carrier sensing.
DCF uses Request-To-Send (RTS) and Clear-To-Send (CTS) control packets for unicast data transmission to a
neighbouring node and consequently sets the Network Allocation Vector (NAV), i.e., |
 |
| If you enable RTS/CTS on a particular station, it will refrain from sending a data frame until the station completes a
RTS/CTS handshake with another station, such as an access point. A station initiates the process by sending a RTS
frame. The access point receives the RTS and responds with a CTS frame. The station must receive a CTS frame before
sending the data frame. The CTS also contains a time value that alerts other stations to hold off from accessing the
medium while the station initiating the RTS transmits its data. Stores the channel reservation information to avoid the
hidden terminal problem. Using the cross-layer approach, DCF periodically probes the MAC to find the time period for
which the link is busy, τbusy. The interference that a node m has to suffer is expressed as |
|
| If you enable RTS/CTS on a particular station, it will refrain from sending a data frame until the station completes a
RTS/CTS handshake with another station, such as an access point. A station initiates the process by sending a RTS
frame. The access point receives the RTS and responds with a CTS frame. The station must receive a CTS frame before
sending the data frame. The CTS also contains a time value that alerts other stations to hold off from accessing the
medium while the station initiating the RTS transmits its data. Stores the channel reservation information to avoid the
hidden terminal problem. Using the cross-layer approach, DCF periodically probes the MAC to find the time period for
which the link is busy, τbusy. The interference that a node m has to suffer is expressed as |
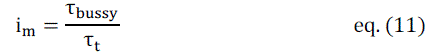 |
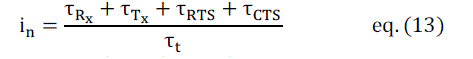
| Where, τbusy the duration for which the medium remains busy; in the case of receiving packets it is x R state (or
communication is going-on with other nodes) and the NAV pending. In the interference expression for node m, t is the
total window time. If node n is at the transmitting end, the , τbusy value is given by + τRx + τTx + τRTS +τCTS. Thus, the
interferences for the sending node n and the receiving node m are given as |
 |
 |
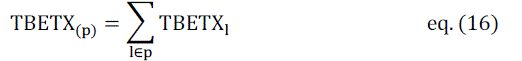
| The link (m,n) formed by nodes m and n will suffer from interference, mni that is the maximum of the interferences
calculated in equations (12) and (13) |
 |
| The receiving node m saves the information of interference computed by equation (12) and sending node, by equation
(13). The expected interference of the link (m,n) is then evaluated as: |
 |
| Since wireless medium are shared, they have the problem of interference due to contention. This causes packets to be
lost due to collisions, and consequently reduces the bandwidth of links. Therefore, exp I is added to handle the interflow
interference among contending nodes. The weight of a path is defined as p becomes |
 |
| Then the routing metric for the best route or path Pbest from source to destination is the minimum value of P’s all
available. As given below: |
 |
| Four important metrics are considered. These include: |
| (i) Throughput: which is defined as the total amount of data a receiver receives from the sender divided by the time it
takes for receiver to get the last packet. It is actually the measure of how fast we can send packets through the network.
(ii) Normalized Routing Load (NRL): which is the number of routing packets transmitted by a routing protocol (DSDV
routing protocol in this study) for a single packet to be delivered successfully at the destination. It describes how many
routing packets for route discovery and route maintenance need to be sent in order to propagate the data packets.
(iii) Average end-to-end delay: indicates how long it takes for a packet to travel from the source to the application layer
of the destination. It includes all possible delays caused by buffering during route discovery, retransmission delays at
the MAC, queuing delay at the interface, propagation and transfer times. |
| (iv) Packet delivery ratio (PDR): is the fraction of data packets delivered to the destinations to those generated by the
Constant Bit Rate (CBR) sources. |
| C. Implementation of DSDV |
| DSDV is a distance-vector protocol, which uses sequence numbers to ensure freshness, and a settling time mechanism
to avoid unnecessarily propagating routes with inferior metrics. We made four changes to the original DSDV design in
order to ensure that it uses the path with the best known metric. Before describing those changes, we present an
overview of how the published version of the protocol selects routes. Every node has a routing table entry for each
destination it knows about. This entry contains four fields: the destination’s identifier (IP address), the next hop on the
route to that destination, the latest sequence number heard for that destination, and the metric. A node forwards packets
to the next hop specified by the current contents of its routing table. Every node periodically broadcasts a route
advertisement packet containing its complete routing table. This advertisement is known as a full dump, and occurs at
the full dump period. |
| Step1: ETX sums the (re)transmission counts of all the links to find the transmission count of the entire path by
assuming that all the links on that particular path contend with each other. This is true for less hop paths but is not
applicable for longer paths because longer paths have more links that are not in the same contention domain. This
spatial reuse implies that the actual transmission cost of a path is less than the sum of the transmission counts of all the
links of the path. Thus, adding the ETX of all the links of a path unfairly increases the cost of longer paths due to more
packet drops. In other words, ETX penalizes routes with more hops. So, the metric does not consider the longer paths to
select the best one. This deficiency of ETX and ETT. There are three available paths from source to destination. ETX
and all those ETX-based metrics that do not take inter-flow interference into account would select one of the paths
between Path1 and Path3 and would penalize Path2. It is obvious from that Path2 has multiple contention domains
(CDs). The transmissions on a link in CD1 do not interfere the transmissions taking place on a link in CD3. As a whole,
Path2 has interference value comparable to that of Path1 and Path3 or even less. As longer paths have higher
throughput but are ignored by ETX, so, Path2 is never selected for data transmissions. |
| Step2: ETX, ETT and ETP do not explicitly implement any mechanism to encounter interference that usually becomes
performance bottleneck in the wireless static networks. |
| Step3: ETX and ETT do not take any information from the MAC-layer that makes the computations more robust at the
routing layer. |
| Step4: ELP are not capable of differentiating among the transmissions taking place on the links in the same contention
domain. Being unable to calculate the bandwidth of the contending nodes, ELP do not consider the longer paths.
Though, the later one takes into account the longer paths by implementing the interference but the former one still
remains unable to take the longer paths into account. So, ETP tackles this issue and takes the bandwidth values of the
contending links into account. The model proposed in these techniques considers the reduction in successful data
delivery due to contention from the slow links and expects the better routes than ETP and ETT. An obvious problem of
ETP, like ELP and ETT is that it does not take interference into consideration. Presence of channel variability in ETX
became the reason to design TBETX. The difference between ETX and ETP is: rather than considering probe losses,
TBETX works at the bit level. The TBETX metric computes the bit error probability using the position of the corrupted
bit in the probe and the dependence of these bit errors throughout successive transmissions. This is possible because
probes are composed by a previously known sequence of bits. The variability of the link is modeled using the statistics
of this stochastic process. Then, the mean number of transmissions is analytically calculated and the results show that it can be closely approximated with the statistics of the bit error probability, summed over packet duration. For TBETX,
the critical time scale for the link variability is the transmission time of a single packet including all its retransmissions. |
 |
| μ means the impact of slowly varying and static components, like shadowing, slow fading in the channel and σ2 shows
the impact of relatively rapid channel variations, as fading, interference, etc. which the term μΣ (and hence the ETX)
cannot track. μ and σ2 are estimated by the bit level information, as counting only the packet losses is not sufficient;
thus, parameters μ and σ2 are estimated by considering the number of erred bits in each probe packet. Complexity of
“channel estimation” is the main disadvantage of the TETX, as: |
| (1) probe packets are to be processed at the bit level raising energy consumption issue in wireless sensor networks
(which may not be an issue for wireless mesh networks due to their abundance of processing power), (2) σ2 Increases
with increased estimation error. A link’s high TETX is due to high channel variability and estimation error which
results a better link to be malformed. TETX can be adapted like ETX easily for those wireless links which provide bit
rate adaptation by normalizing the metric according to the transmission rate. |
IV. SIMULATION RESULTS |
| The sources transmit Continuous Bit Rate (CBR) traffic. The nodes taking part in the simulation are randomly
dispersed in an area of 1000m x 1000m. The nodes move in the simulation area following the Random Waypoint
Model. Each node in network starts moving towards a randomly chosen destination. The speed with which a node
moves is set to be 20 m/sec. When a node reaches the destination, it takes a pause for a specified time period. The
pause time in our simulation setup is 2 sec. As soon as this pause time for of a node is expired, it starts its journey
towards next randomly chosen destination. This process continues until the end of the simulation time, 900 sec in case
of our simulations. The bandwidth provided to all the wireless links is 2 Mbps. To examine the behavior of protocols
under different network loads, simulations are run for packet rates of 2, 4, 8, 16, and 32 packets/sec. The size of packet
is set to 64 bytes. For scalability analysis, the packet size is 512 bytes. Number of nodes used is 500, out of which 10
act as sources. For each packet rate the simulation is run five times and the result is averaged for analysis. |
| The network showed in Fig. 1 is compare different network load value to calculate the network packet delay source to
destination in this we compare the proposed system take less delay compare with existing protocols w. It clearly shows
in Fig. 2 that the metric network load vs throughput with number of hops. The proposed protocol takes high throughput.
Fig. 3 shows the execution time of proposed system with existing protocol. Our results shows that the metric delay,
throughput, execution time. |
V. CONCLUSION AND FUTURE WORK |
| Simulations were performed and presented to evaluate the performance of the new link quality metric over DSDV
routing protocol for different packet rates and network sizes, it was observed that the TBETX metric outperforms ETX
and MDR in terms of throughput, average end-to-end delay, NRL and PDR. It was also shown to be sensitive to the
packet rate. Since in DSDV, each node stores the entire information of the network topology and tries its best to record
every destination it learns from neighbours, which leads to a higher success ratio in the route discovery process,
however, its overhead increased rapidly along with the number of nodes, Therefore, it might no scale in large or high
density networks. For future work, the extension of the IBETX metric over other routing protocols (AODV and OLSR)
will be considered, and an enhanced TBETX based on physical layer parameters such as the Signal-to Noise Ratio
(SNR) will be taken into account as well. This can shed further light on the impact of physical layer on optimal routing
decisions and the support for multi-channel networks. |
| |
Figures at a glance |
 |
 |
 |
| Figure 1 |
Figure 2 |
Figure 3 |
|
| |
References |
- N. S. M. Usop, A. Abdullah and A. F. A. Abidin, âÃâ¬ÃÅPerformance evaluation of AODV, DSDV & DSR routing protocol in grid environmentâÃâ¬ÃÂ, InternationalJournal of Computer Science and Network Security, vol.9, no.7, pp.261-268, 2011.
- Mueen Uddin et al , âÃâ¬ÃÅImproving performance of Mobile Ad hoc Networks using efficient tactical on demand distance vector (taodv) routing algorithm âÃâ¬ÃÂ,International Journal of Innovative Computing, Information and Control Vol 8 No 6, pp. 4375âÃâ¬Ãâ4389 , June 2012, ISSN 1349-4198.
- Y.-B. Ko and N. H. Vaidya, âÃâ¬ÃÅLocation-aided routing (LAR) in mobile ad hoc networks, Wireless NetworksâÃâ¬ÃÂ, Vol 6, No 4, pp.307-321, 2000.
- Khalid Hussain, Abdul Hanan Abdullah, Khalid M. Awan and ZohairIhsan, âÃâ¬ÃÅAn Artificial Intelligence Based X-AODV Routing Protocol forMANETâÃâ¬ÃÂ,World Applied Sciences Journal 23 (4): 541-548, ISSN 1818-4952, 2013.
- 5. Dhirendra Kumar Sharma, Chiranjeev Kumar ,Sandeep Jain, Neeraj Tyagi , âÃâ¬ÃÅAn Enhancement of AODV Routing Protocol for Wireless Ad HocNetworksâÃâ¬ÃÂ, 1st IntâÃâ¬Ãâ¢l Conf. on Recent Advances in Information Technology RAIT-2012, IEEE 978-1-4577-0697-4/12 2012.
- MohannadAyash , Mohammad Mikki , âÃâ¬ÃÅImproved AODV Routing Protocol to Cope With High Overhead in High Mobility MANETsâÃâ¬ÃÂ, IEEE , 978-0-7695-4684-1/12 , 2012.
- Akshatha, P.S., Khurana, N., Rathi, âÃâ¬ÃÅOptimal Path For Mobile Ad-Hoc Networks Using Reactive Routing ProtocolâÃâ¬ÃÂ. International Journal of Advancesin Engineering & Technology, IJAET (2011) ISSN: 2231-1963.
- D. Chakeres and E. M. Belding-Royer. âÃâ¬ÃÅAODV routing protocol implementation designâÃâ¬ÃÂ. In Proceedings of the International Workshop on Wireless AdhocNetworking (WWAN), pp. 698âÃâ¬Ãâ703, Tokyo, Japan, March 2004.
- E. Perkins, E. M. Royer, and S. R. Das, âÃâ¬ÃÅAd-hoc On-Demand Distance Vector (AODV ) RoutingâÃâ¬ÃÂ, Internet Draft, draft-ietf-MANETsaodv -10.txt, workin progress, 2002.
- Kaur, S. âÃâ¬ÃÅPerformance Comparison of DSR and AODV Routing Protocols with Efficient Mobility Model in Mobile Ad-Hoc NetworkâÃâ¬ÃÂ. IJCST 2(2) (June2011).
- ShahramBehzad, Reza Fotohi, ShahramJamali,"Improvement over the OLSR Routing Protocol in Mobile Ad Hoc Networks by Eliminating theUnnecessary Loops", IJITCS, vol.5, no.6, pp.16-22, 2013. DOI: 10.5815/ijitcs.2013.06.03.
- YasharGanjali, AbtinKeshavarzian,âÃâ¬ÃÂLoad Balancing in Ad Hoc Networks: Single-path Routing vs. Multi-path RoutingâÃâ¬ÃÂ, IEEE INFOCOM 2004, 0-7803-8356-7/04.
|