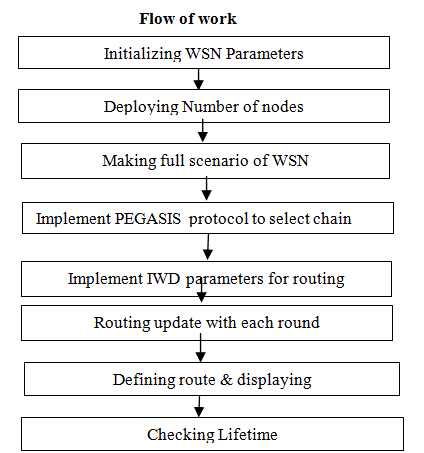
A sensor network is one of the busiest networks on which large amount of different kind of data is communicated over the network. In PDCH, the Cluster head consumes large energy and time of round also increase so, they chose double cluster heads in one chain & used hierarchical structure in order to avoid long chain. But still cluster head consumes large energy and time of round increases. In this paper the implementation of IWD and PEGASIS protocol is used for the route optimize. In the proposed work, firstly nodes are taken which makes full scenario for WSN and then the PEGASIS protocol is used for the routing which discovers the chain head. Implementation of IWD is done which update the routing after each round and giving the optimized route. In that way the life time of network is increased because it takes less energy as compare to others.
Keywords |
| Wireless Sensor Network; Nodes |
INTRODUCTION |
| Wireless Sensor networks [1] are one of major wide spread networks that are effective in recent years because of the
involvement of the network in terms of electronics, communication and information technology in the single network.
A sensor network is composed with vast number of tiny sensors. Each sensor node is defined with specific parameters
in terms of energy. With each communication over the network some energy is consumed. The type of energy in the
network can be of different types such as solar, electronic energy etc. This kind of network requires the effectiveness of
each kind of operation in terms of energy. More the energy will be wasted, lesser the network life will be. A network is
the network of connected sensors defined in terms of radio frequency, range specification etc. Each device available
these days having some sensor incorporated in it such as laptops, mobiles etc. Because of this it is the challenging
advance area that requires feasibility in terms of memory, power consumption, memory management, security etc. The
economic and the technological factors are also required to be analyzed. Sensing + CPU + Radio = Thousands of
potential applications |
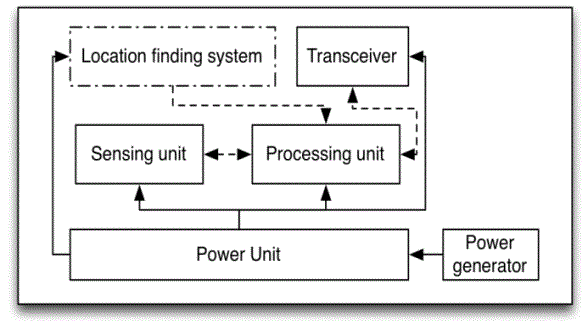
COMPONENT OF SENSOR NETWORK |
1) Sensing Unit: |
| Sensors play an important role in sensor networks by creating a connection between physical world and computation
world. Sensor is a hardware device used to measure the change in physical condition of an area of interest and produce response to that change. Sensors sense the environment, collect data and convert it to fundamental data (current or
voltage etc) before sending it for further processing. |
2) Memory Unit: |
| This unit of sensor node is used to store both the data and program code. In order to store data packets from
neighboring (other) nodes Read Only Memory (ROM) is normally used. And to store the program code, flash memory
or Electrically Erasable Programmable Read Only Memory (EEPRM) is used. |
3) Power Unit: |
| For computation and data transmission, the corresponding units in sensor node need power (energy). A node consist a
power unit responsible to deliver power to all its units. The basic power consumption at node is due to computation and
transmission where transmission is the most expensive activity at sensor [2] node in terms of power consumption. |
4) Processing Unit: |
| Sensor node has a microcontroller which consist a processing unit, memory, converters (analogue to digital, ATD)
timer and Universal Asynchronous Receive and Transmit (UART) interfaces to do the processing tasks. This unit is
responsible for data acquisition, processing incoming and outgoing information, implementing and adjusting routing
information considering the performance conditions of the transmission. |
5) Communication Unit: |
| Senor Nodes use radio frequencies or optical communication in order to achieve networking. This task is managed by
radio units in sensor nodes that use electromagnetic spectrum to convey the information to their destinations [1].
Usually each sensor node transfers the data to other node or sinks directly or via multi hop routing. |
RELATED WORK |
• PEGASIS |
| PEGASIS [15] (Power-efficient Gathering in Sensor Information Systems) is a greedy chain-based power efficient
algorithm. Also, PEGASIS is based on LEACH. The key features of PEGASIS are |
| • The Base Station is fixed at long distances from the sensor nodes. |
| • The sensor nodes are alike and energy constrained with consistent energy. |
| • No mobility of sensor nodes. |
| PEGASIS is based on two ideas; chaining, and data fusion. In PEGASIS, each node can take turn of being a leader of
the chain, where the chain can be constructed using greedy algorithms that are deployed by the sensor nodes. PEGASIS
assumes that sensor nodes have a global knowledge of the network, nodes are stationary (no movement of sensor
nodes), and nodes have location information about all other nodes. PEGASIS performs data fusion except the end
nodes in the chain. PEGASIS outperforms LEACH by removing the overhead of cluster formation, decreases the sum
of distances that non leader-node must transmit, less the number of transmissions and receives all nodes, and use only
one transmission to the BS per round. PEGASIS has the same problems that LEACH suffers from. Also, PEGASIS
does not scale, cannot be applied to sensor network where global knowledge of the network is not easy to get. Powerefficient
Gathering in Sensor Information Systems (PEGASIS) [6] is an enhancement of the LEACH protocol. Rather
than designing multiple clusters, PEGASIS makes chains of sensor nodes so that every node transmits and receives
from a neighbor-hood and only one node is picked up from that chain to transmit to the base station. Collected data
transfer from node to node, aggregated and eventually sent to the base station. The chain designing is achieved in a
greedy way. Node c0 transmit its data to node c1. Node c1 combine node c0 data with its own and then passes it to the
leader. After node c2 passes the token to the node c4, node c4transfer its data to node c3. Node c3 combines node c4’s
data with its own and then passes to the leader. Node c2 waits to receive data from both neighbour-hood and then
attached its data with its neighbour-hood data. Finally, node c2 pass one message to the base station. |
• LEACH |
| Low Energy Adaptive Clustering Hierarchy (LEACH),[19] a hierarchical protocol in which most nodes transmit to
cluster heads, is presented. The Setup Phase: |
| 1. In this phase, the clusters are organized and the cluster heads are selected. In every round, a stochastic algorithm is
used by each node to check whether it will become a cluster head. If a node can be a cluster head once, it can’t become
a cluster head again for P rounds, where P is the percentage of these cluster heads. |
| 2. The Steady Phase: In this phase, the data is transmitting to the base station. The duration of this phase is much longer
than the duration of the above phase in order to reduce overhead. |
| LEACH is a protocol that uses to reduce energy consumption in a wireless sensor network. However, LEACH uses
Single-hop routing in which every sensor node sends information directly to the cluster-head or the Sink. Therefore, it
is not recommended for networks that are delivered in large areas. |
• Ant Colony Algorithm |
| Ant colony algorithm [12] originates from the actual behavior of ants which communicate with each other by
pheromone. Pheromone is a chemical substance released by ants and in turn affecting their moving decisions. Initially,
no pheromone is laid on the branches and ants have no bit of information about the length of branches. However, once
a shorter one is found, it will receive pheromone at a higher rate. The more quantities ants leave pheromone on the
path, the larger probability they visit this path next time. Thus, there will be a positive feedback in the group of ants. |
PROPOSED WORK |
| In the previous work IWD is introduced the IWD algorithm gets a representation of the problem in the form of a graph
(N, E) with the node set N and edge set E. Then, each IWD begins constructing its solution gradually by travelling on
the nodes of the graph along the edges of the graph until the IWD finally completes its solution. One iteration of the
algorithm is complete when all IWDs have completed their solutions. After each iteration, the iteration-best solution
TIB is found and it is used to update the total-best solution TTB |
Algorithm Working |
| Step 1. Initialization of WSN Scenario. |
| Step 2. Applying IWD for performing energy efficient routing in WSN. |
| Step3. Velocity of water drop = number of iteration
Soil = nodes / path |
| Water drop = routing based on protocol |
| Step 4. The path followed by the water drop will be the routes in the WSN Scenario. |
| Step 5. Find routes before and after applying the IWD algorithm. |
| Step 6. The shortest path will be generated by IWD algorithm |
 |
| a=1 b=0.1by default and c=1 |
RESULT AND DISCUSSION |
Performance Evaluation |
| 1).Throughput: It is the average at which data packet is delivered successfully from one node to another over a
communication network. It is usually measured in bits per second. |
| Throughput = (no of delivered packets * packet size) / total duration of simulation |
| 2). Packet delivery Ratio (PDR): It is the ratio of all the received data packets at the destination to the number of data
packets sent by all the sources. It is calculated by dividing the number of packet received by destination through the no.
of packet originated from the source. |
| PDR = (Pr / Ps) * 100 |
| Where, Pr is total packet received and Ps is total packet sent |
| 3). Jitter: It the maximum number of packets delivered in minimum time. |
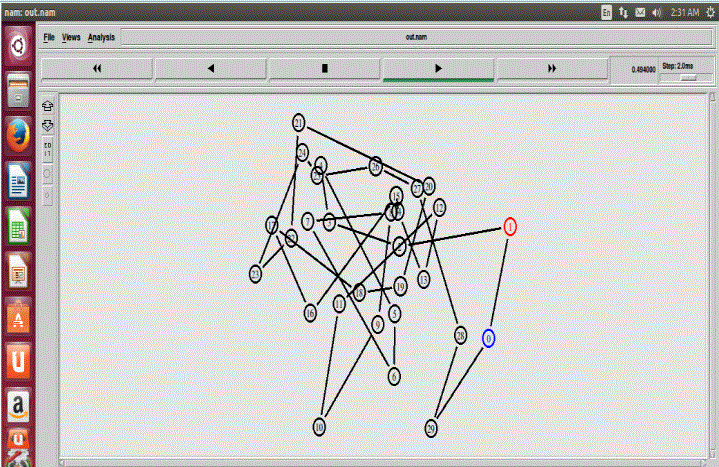
Scenario 1 |
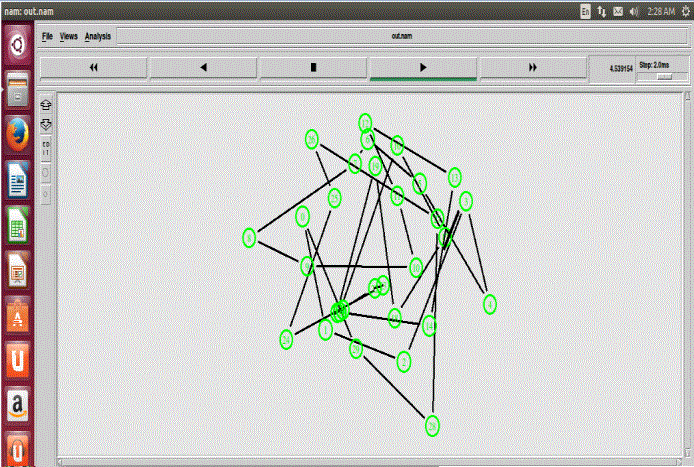
| In very first scenario 30 nodes are taken and PEGASIS is applied for routing which chooses the chain cluster head.
Here, node 1 having red color shows current chain head and node 1 in blue shows previous chain head. |
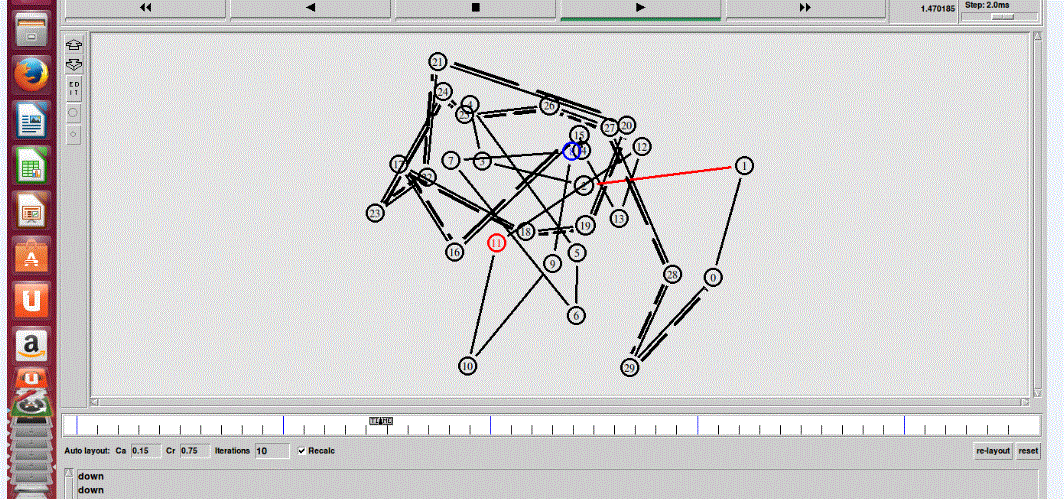
Scenario 2 |
| This scenario showing routing which describes with the help of IWD the route get change every time and here, the
current chain head is node 11 and node 8 represent previous cluster head. |
Scenario 3 |
| This scenario shows that the routing is finished and no packet transmission is there, after this the nodes are in the
sleeping mode which is shown with the help green nodes. |
Scenario 4 |
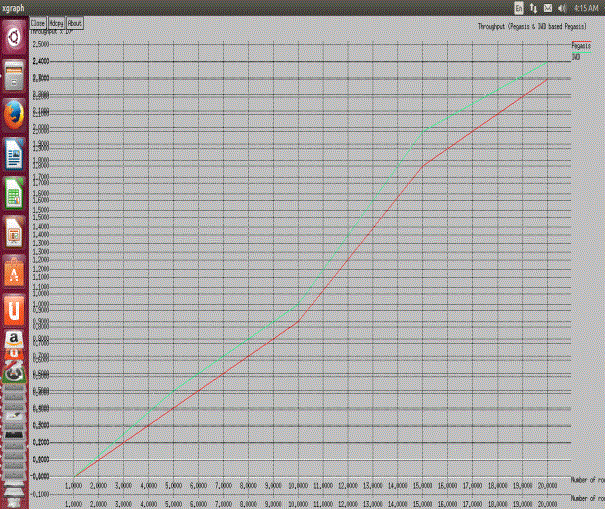
| In this graph green line is used for IWD algorithm and red line is used for PEGASIS algorithm. Here, green line
indicate that throughput of IWD is better than PEGASIS because higher the values higher the throughput. |
Scenario 5 |
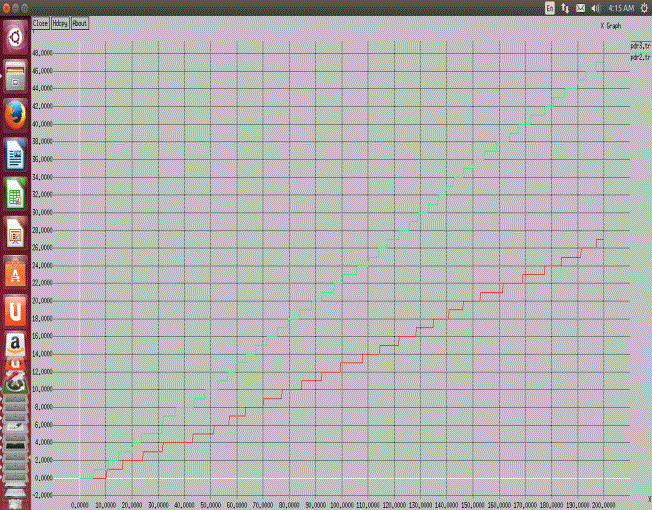
| In this graph green line is used for IWD algorithm and red line is used for PEGASIS algorithm. Here, green line
indicate that pdr of IWD is better than PEGASIS because higher the values higher the pdr ratio. |
Scenario 6 |
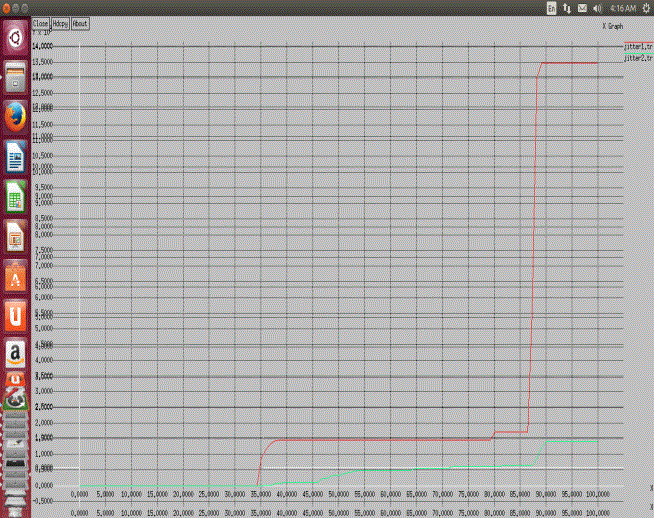
| In this graph green line is used for IWD algorithm and red line is used for PEGASIS algorithm. Here, green line
indicate that jitter of IWD is better than PEGASIS because it have lower value. |
CONCLUSION AND FUTURE WORK |
| Wireless Sensor networks are major wide spread networks that are effective in recent years because of the involvement
of the network in terms of electronics, communication and information technology in the single network. A sensor
network is composed with vast number of tiny sensors. Each sensor node is defined with specific parameters in terms
of energy. With each communication over the network some energy is consumed. The type of energy in the network
can be of different types such as solar, electronic energy etc. This kind of network requires the effectiveness of each
kind of operation in terms of energy. More the energy will be wasted, lesser the network life will be. To increase the
lifetime of network in this research PEGASIS algorithm is used for routing and then intelligent water drop (IWD)
algorithm is used for discover chain cluster head which is a part artificial intelligent scheme. Initialization of WSN
parameter is done in this research the parameter taken is packet delivery ratio (pdr), jitter and throughput. Firstly nodes
are taken which makes full scenario for WSN and then the pegasis protocol is used for the routing which discovers the
chain head. Implementation of IWD is done which update the routing after each round and giving the optimized route.
In that way the life time of network is increased because it takes less energy as compare to others. |
Figures at a glance |
 |
 |
 |
 |
| Figure 1 |
Figure 2 |
Figure 3 |
Figure 4 |
|
 |
 |
 |
 |
| Figure 5 |
Figure 6 |
Figure 7 |
Figure 8 |
|
References |
- S M Lambor and S M Joshi, “Performance Analysis of Network Lifetime and Energy Consumption in a Multi-Hop Wireless Sensor Network”,International Conference and workshop on Emerging Trends in Technology (ICWET), Vol.4, pp.45-51, 2011.
- FengQian,CaiZhongmin,YangJin and Hu Xunchao, “A Performance Comparison of the Ad Hoc Network Protocols”, International Workshop onComputer Science and Engineering (IWCSE), Vol. 2, pp.293-297, 2009.
- Shio Kumar Singh, M P Singh and D K Singh, “Energy Efficient Homogenous Clustering Algorithm for Wireless Sensor Networks”,International Journal of Wireless & Mobile Networks (IJWMN), Vol.2,pp,105-112, 2010.
- S M Lambor and S M Joshi, “Performance Analysis of Network Lifetime and Energy Consumption in a Multi-Hop Wireless Sensor Network”,International Conference and workshop on Emerging Trends in Technology (ICWET), Vol.3, pp.114-122, 2011.
- OnurSoysal, Sami Ayyorgun and Murat Demirbas, “PowerNap: An Energy Efficient MAC Layer for Random Routing in Wireless SensorNetworks”, IEEE Communications Society Conference on Sensor, Mesh and Ad Hoc Communications and Networks, Vol.5, pp.184-191, 2011.
|