Keywords
|
| Wireless sensor network,Energy-hole,Node deployment,Network lifetime, Adjustable transmission range |
INTRODUCTION
|
| Sensor networks are formed of a number of nodes that are deployed for monitoring specific activities, such as environmental monitoring, battlefield monitoring, and construction distortion detection. These nodes have limited resources in terms of computation power, memory, battery power, and transmission capability. Among these issues, the energy problem is of key concern. Low power devices can be used in order to reduce energy consumption. Network lifetime is the time span from the deployment to the instant when the network is considered non-functional. When a network should be considered non-functional is, however, application-specific. It can be, for example, the instant when the first sensor dies, a percentage of sensors die, the network partitions, or the loss of coverage occurs. |
| As energy consumption for data transmission is an exponential function of the communication distance between sender and receptor according to the energy consumption model, multi-hop communication strategy is considered to be efficient in energy conservation for data gathering [1]. This phenomenon is referred to as energy-hole. When energy-hole exists in the network, the traffic flow undertook by sensors in the region of energy-hole will be switched to other alive sensors, which accelerates the expansion of the energy-hole region. This phenomenon is referred to as funnelling effect. At last, the entire network is subject to premature death because it is separated by the energy-hole. In fact argue that by the time the network is out of function, some sensors in the network still have up to 90% initial energy. Energy hole forms in the hotspots, which is also known as the weakness of the network, it can be mitigated and avoided by deploying additional nodes in this area. |
| Network lifetime is perhaps the most important metric for the evaluation of sensor networks. Of course, in a resourceconstrained environment, the consumption of every limited resource must be considered. However, network lifetime as a measure for energy consumption occupies the exceptional position that it forms an upper bound for the utility of the sensor network. The network can only fully its purpose as long as it is considered "alive", but not after that. It is therefore an indicator for the maximum utility a sensor network can provide. If the metric is used in an analysis preceding a real-life deployment, the estimated network lifetime can also contribute to justifying the cost of the deployment. |
| Lifetime is also considered a fundamental parameter in the context of availability and security in networks. Network lifetime strongly depends on the lifetimes of the single nodes that constitute the network. This fact does not depend on how the network lifetime is defined. Each definition can finally be reduced to the question when the individual nodes fail. Thus, if the lifetimes of single nodes are not predicted accurately, it is possible that the derived network lifetime metric deviates in an uncontrollable manner. |
RELATED WORK
|
| Many researchers generally agree that the sensors around the sink consume the highest amount of energy in most circumstances and the energy-hole tends to form in these areas. However, the usual statement ‘‘around the sink’’ is too vague to guide the network deployment and optimization. These conventionalized studies fail to precisely identify which part of the network should be deployed with more nodes and what is the exact number of sensors needed. |
| Sensor placement problem has been addressed in many network applications” Sensor placement in optimal filtering and smoothing problems” [1]. Different performance measures have been used to develop sensor placement schemes. Dhillon and Chakrabarty[2] ‘‘Sensor placement for effective coverage and surveillance in distributed sensor networks’’ propose two algorithms to optimize sensor placement with a minimum number of sensors for effective coverage and surveillance purposes under the constraint of probabilistic sensor detections and terrain properties. |
| Lin and Chiu [3] “A near-optimal sensor placement algorithm to achieve complete coverage/discrimination in sensor networks” address the sensor placement problem for complete coverage under the constraint of cost limitation. |
| Ganesan et al.[4] ‘‘Power efficient sensor placement and transmission structure for data gathering under distortion constraints’’ jointly optimize sensor placement and transmission structure in a one-dimensional data-gathering WSN. Their approach aims at minimizing the total power consumption under distortion constraints. Kar and Banerjee [5] “Node placement for connected coverage in sensor networks’’ address the optimal sensor placement to ensure connected coverage in WSNs. Sensor placement schemes that maximize network lifetime have also been addressed for different WSNs. |
| Dasgupta et al. [6] ‘‘Topology-aware placement and role assignment for energy-efficient information gathering in sensor networks’’ propose an algorithm to find the optimal placement and role assignment to maximize the lifetime of a WSN that consists of sensors and relay nodes. |
| Hou et al. [7] “On energy provisioning and relay node placement for wireless sensor networks” address the energy provisioning and relay node placement in a two-tiered WSN. In[8] ‘‘Topology control for wireless video surveillance networks’’, the placement of gateway nodes is studied to maximize the lifetime of a two-tiered WSN. In[9] ‘Energy-aware node placement in wireless sensor network’’, a greedy sensor placement scheme is proposed to maximize the lifetime of a linear WSN. |
| It is noticed that cluster-based networks can achieve higher energy efficiency than flat network [2]. However, the energy-hole problem still exists. In HEED [5] and UCR[7]hierarchical structures of the sensor networks are constructed and clustering schemes are proposed aiming at balanced energy depletion among all nodes. LEACH employs clusters head rotation to balance the energy depletion. Different from LEACH, HEED proposes to select cluster head based on node energy budget and the communication cost within the cluster. However, energy-hole avoiding algorithm based on clustering network is different from the classical uniform clustering algorithms such as HEED [5], they employ an unequal clustering size model for network organization, which leads to more uniform energy dissipation among the cluster head. |
| Effective routing protocols, Singh and Woo[4]extends the network lifetime through power-aware routing. Chang and Tassiulas[5]propose the idea of selecting the optimal path from multiple available paths based on comprehensive cost of each path. Efthymiou et al. in [5] presents the method of multiple routing paths to balance the energy consumption. In[3], the problem of how to select the optimal routing path is converted to the problem of constrained linear program optimization. |
| Node deployment strategy, Deploying additional relay nodes near the sink can also effectively alleviate the problem of uneven energy cost. Gupta et al.[7]proposes a method to deploy the network by heuristic method. |
| To the best of current knowledge, there is no research that comprehensively analyses the impact of the occurrence time, the region, size and the duration of the energy-hole. Energy-hole avoiding strategies based on node deployment are not as satisfactory as expected. Here it accurately analyses the location and dimension of the energy-hole. On this basis, an effective node distribution strategy to assist network deployment and energy-hole avoidance will be developed. |
OVERVIEW OF THE TECHNIQUE
|
| A. Network model: |
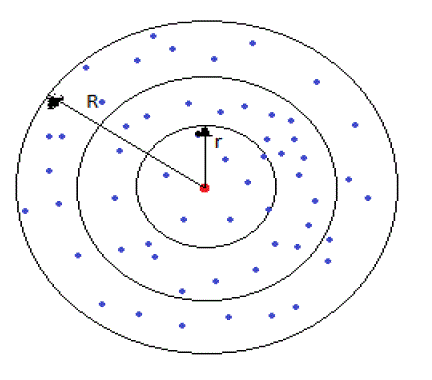
| All sensor nodes are deployed in the circular network with R as the radius and the centre red node as the sink. The sensor field in the shape of a disk is shown in Fig. 1 with the sink at the centre. |
| The nodes are uniformly spread out and the node density is a constant. We only need to compute a finite number of node densities, one for each ring. The routing rule is specified at the granularity of the rings. Assume the minimum node density ensuring network connectivity and coverage to be s which is also called working node density. Denote the network node density as ρ and if ρ≤τ all nodes work concurrently and if ρ >τ a corresponding node density control strategy is used so that the density of nodes working concurrently is τ. In each round of data collection each sensor generates a packet and sends it to the sink. |
| Each packet is forwarded to the sink using greedy strategy with multi-hop transmission. The effective network lifetime is the number of rounds of data collection. The transmitting radius of sensor node is denoted with r. The transmission power of node is adjustable, that is the node can adjust its transmission power according to the distance between it and the receiver, such as the Berkeley Motes, which has 100 transmission power levels. Communication range or transmission range is the distance between the sender and the receiver, which is usually not larger than r and nodes are randomly deployed. |
| B. Energy consumption model: |
| A sensor uses its energy in order to carry out three main functions: acquisition, communication and data processing. |
| • Acquisition |
| The energy consumed to carry out the acquisition is generally negligible. Nevertheless, it varies in considerable proportions depending on the type of monitoring being carried out. |
| • Communication |
| It consumes more energy than any other task. It covers the communications in terms of emission and reception. It presents a transmission system model and the rules applied to controlled energy consumption [6]. |
| • Data processing |
| The energy consumed for the calculation operation is very low as compared with the communication energy. The energy needed to transmit 1 KB over a 100m distance is approximately equivalent to the energy necessary to carry out 3 million instructions at a speed of 100 million instructions per second (MIPS). This level might be much dependent on the circuitry installed in the nodes and the features requested. |
| Compute the amount of energy for forwarding l-bit message packet through Eq. (1) and the energy for receiving the same amount of data through Eq. (2). |
 |
 |
| If the transmission distance is less than the threshold d0, the power amplifier loss is based on free-space model; if the transmission distance is greater than or equal to the threshold d0, the multi-path attenuation model is used. The electronics energy, Eelec, depends on the factors such as the digital coding, modulation, whereas the amplifier energy Efs, Eamp are respectively the energy required by power amplification in the two models. The energy cost for receiving l bit of data is given by Eq. (2). |
PROPOSED METHODOLOGY
|
| The demand for maximum network lifetime in many mission-critical applications of wireless sensor networks motivates the great significance to deploy as few sensors as possible to achieve the expected network performance. Proposed system use a deployment strategy with T as the required minimum network lifetime. In order to achieve evenly balanced energy consumption among all nodes, the node density in different areas of the network should be a continuous varying function of the distance from the sink. |
| A. Contributions |
| • First step to compute the traffic load and energy consumption in different regions of the network through theoretical analysis and then propose a more elaborate energy consumption model, which provides a theoretical basis for accurate energy-hole avoidance. |
| • Based on the energy consumption model, it proposes the deployment strategy which ensures a guaranteed FDT and ADT of the network with the minimum number of sensors. |
| • Finally derive the residual energy ratio of the network at FDT and ADT. |
| B. Algorithm description for FDT |
| Aim of the proposed algorithm is to maximize the network life by deploying the nodes where energy consumption rate is high in the network. |
| Step 1. Suppose that the required minimum FDT is T, calculating the energy consumption in each ring using eq. (1) |
| Step 2. Comparing the energy consumption in each ring with the Energy consumption rate ET=Einit/T (where Einit is the initial energy of the nodes). |
| Step 3. If ET is high then deploy the nodes in that particular ring. |
| Step 4. New node density calculation using, FDT TFDT= Einit/ET |
| C. Algorithm description for ADT |
| Aim of the proposed algorithm is to maximize the network life by deploying the nodes where energy hole occurs in the network. |
| Algorithm 1: Energy – hole region computation |
| Input: Network radius R and transmission radius r |
| Output: An ordered pair (d1,d2) specifying the region which inner ring is d1 from sink and outer ring is d2 from sink. |
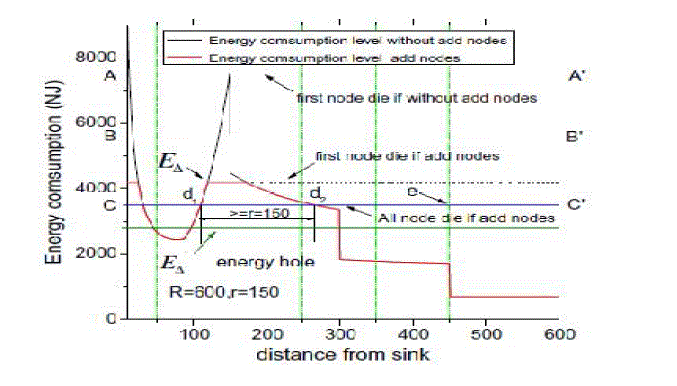
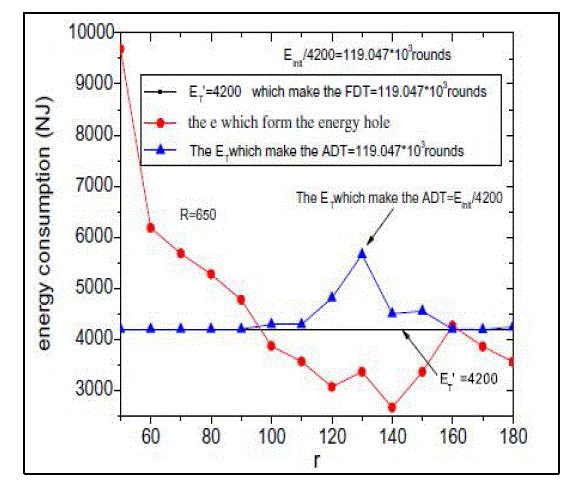
| 1) Draw energy consumption curve of sensor nodes under the case of different distances from the sink.(fig .2) |
| 2) Choose the maximum energy consumption as the initial energy, and then assign the value to variable e. |
| 3) Draw a horizontal line with the value of e. This line will intersect with energy consumption line and then denote the intersection points as d1,d2,d3….dn. if| d1 ,d2|>=r and the energy consumption of nodes whose distance to sink is between d1 and d2 is greater than e , then stop. //This region is the energy hole. |
| 4) Else, e=e-ε go to step3; // ε is a small value. |
| 5) Output the two intersecting points d1, d2 and |
| 6) End. |
| Algorithm 2: deployment strategy |
| Input: Network radius R and transmission radius r, the guaranteed minimum network ADT Lifetime T. |
| Output: The network new node density in different regions of the network |
| 1) According to Algorithm 1, calculate the energy hole region |
| 2) Let ET= Einit/T; |
| 3) ADT TADT= Einit/ET |
| 4) If TADT < = T then go to step 6; |
| 5) ET = ET + ε recalculate TADT, then go to step 3; |
| 6) If TADT < T then ET = ET - ε; // ET = ET - ε, then TADT > = T; |
| 7) Determine the network node density in different regions; |
| 8) end. |
| D. System design |
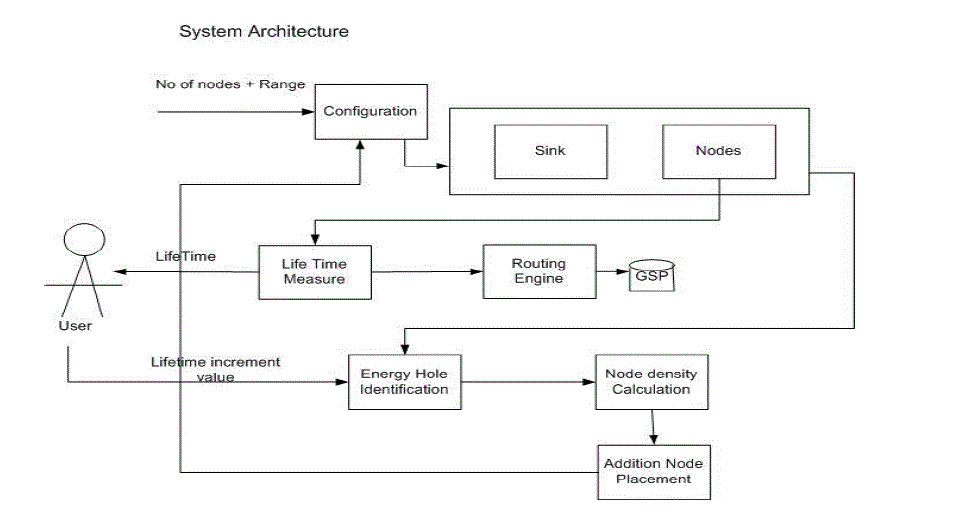
| System architecture is the conceptual design that defines the structure and behaviour of a system. An architecture description is a formal description of a system, organized in a way that supports reasoning about the structural properties of the system. It defines the system components or building blocks and provides a plan from which products can be procured, and systems developed, that will work together to implement the overall system. |
| Fig.3 shows number of nodes and ranges are configured to the sink and nodes. Calculate the life time measures from the node and user access the lifetime achieved by the node. Routing engine finds the Geographic Shortest Path (GSP). User increments the lifetime value to the energy hole. The energy holes are identified by the nodes and calculate the node density. Addition node placements are configured to the sink and nodes. |
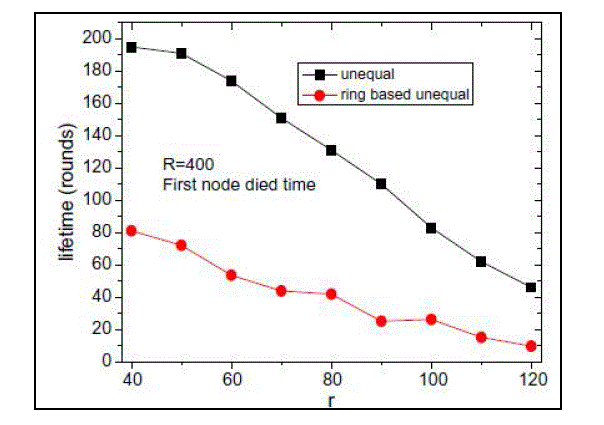
| Proposed method is comparing with ring based strategy. In ring based strategy, they divide the network into several rings with the same width as r. And the area closer to the sink is deployed with higher node density while the node density in area far away from the sink is smaller. But the node density in the same ring is uniform. We call this method as ring based deployment. Another difference with proposed method is that: compute the node density in each ring based on the assumption that all deployed nodes work at the same time. While in this paper the assumption is based on the fact that the density of all working nodes should be s. Fig. 4 shows the comparison of lifetime of the two differently deployed networks. In ring based deployment network, the energy consumption in the same ring is not balanced although nodes are uniformly deployed in the same ring. Since FDT is the time when the first node dies, node with higher energy consumption in this area dies first and thus the network achieve lower FDT. |
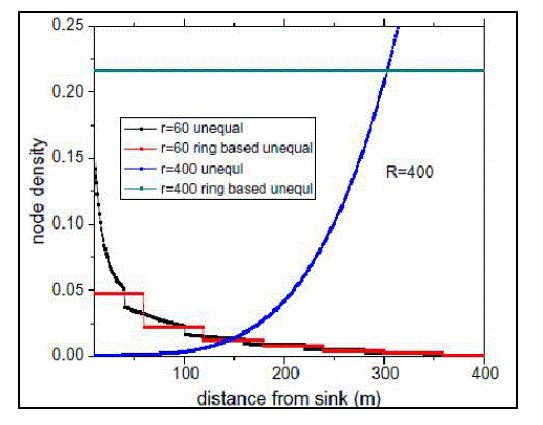
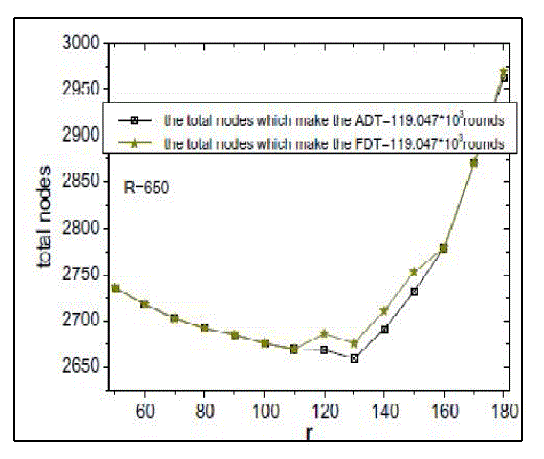
| Fig. 5 shows the node distributions between ring-based deployment and proposed method. The main difference is: in proposed method, the node density in different part of the network is a function of the distance to the sink. While in ring based unequal deployment, the node density is a piecewise function with the interval of r. where r = R: In this case, each node directly sends their packet to sink without relaying. So the nodes close to sink have smaller energy consumption than the nodes far away from the sink. Our proposed method will deploy more nodes in areas far away from the sink. However, in ring based unequal deployment, nodes are uniformly deployed in the ring whose width is r. fig 6 and fig 7 Shows energy consumption rate and number of nodes required for FDT and ADT respectively. |
CONCLUSION
|
| Data load of sensor nodes and the energy consumption in different regions of network are computed to identify the hotspot and the energy-hole regions and further derive the deployment strategy and extends the non-uniform node deployment strategy to achieve balanced energy consumption in both the non-uniformly and uniformly distributed networks. And it is also applicable to the optimization of partly non-uniformly distributed network: when the number of nodes is insufficient to achieve balanced energy consumption over the whole network, can still deploy the network in this strategy with the minimum number of nodes in order to achieve the maximum network lifetime. This study therefore has a significance of broad and general guidance. Main contribution is to present a method for computing the required node density function. |
Figures at a glance
|
 |
 |
 |
 |
| Figure 1 |
Figure 2 |
Figure 3 |
Figure 4 |
|
 |
 |
 |
| Figure 5 |
Figure 6 |
Figure 7 |
|
References
|
- A. Arbel, Sensor placement in optimal filtering and smoothing problems, IEEE Trans. Automat. Control 27 (February) (1982) 94–98.
- S.S. Dhillon, K. Chakrabarty, ‘‘Sensor placement for effective coverage and surveillance in distributed sensor networks’’, in: Proc. of IEEE WirelessCommunications and Networking Conference, vol. 3, March 2003, pp. 1609– 1614
- F.Y.S. Lin, P.L. Chiu, A near-optimal sensor placement algorithm to achieve complete coverage/discrimination in sensor networks, IEEE Commun.Lett. 9 (1) (2005) 43–45.
- D. Ganesan, R. Cristescu, B. Beferull-Lozano, ‘‘Powerefficient sensor placement and transmission structure for data gathering under distortionconstraints’’, in: Proc. Of Third International Symposium on Information Processing in Sensor Networks (IPSN’04), Berkeley, April 2004, pp. 142–150.
- K. Kar, S. Banerjee, ‘‘Node placement for connected coverage in sensor networks’’, in: Proc. of International Symposium on Modeling andOptimization in Mobile, Ad Hoc and Wireless Networks, 2003.
- K. Dasgupta, M. Kukreja, K. Kalpaki, ‘‘Topology-aware placement and role assignment for energy-efficient information gathering in sensornetworks’’, in: Proc. of Eighth IEEE International Symposium on Computer and Communication, June–July 2003, pp. 341 348.
- Y.T. Hou, Y. Shi, H.D. Sherali, S.F. Midkiff, On energy provisioning and relay node placement for wireless sensor networks, IEEE Trans. Wirel.Commun. 4 (5) (2005) 2579– 2590.
- J. Pan, Y.T. Hou, L. Cai, Y. Shi, S.X. Shen, ‘‘Topology control for wireless video surveillance networks’’, in: Proc. of Ninth Annual InternationalConference on Mobile Computing and Networking, San Diego, CA, 2003, pp. 286–299.
- P. Cheng, C.-N. Chuah, X. Liu, ‘‘Energy-aware node placement in wireless sensor network’’, in: Proc. of IEEE Global TelecommunicationsConference, vol. 5, November– December 2004, pp. 3210–3214.
|