The Wi-Fi positioning systems available for enclosed spaces use the existing network infrastructure to calculate the position of the mobile device (MD). The most commonly used parameter is RSSI (Received Signal Strength Indicator). In this paper, we analyze the Fingerprint technique considering some variations aimed at improving the accuracy of the technique and minimizing calculation time. Significant field work is carried out, analyzing the accuracy achieved with each technique.
Keywords |
| Indoor positioning, Wireless LAN, RSSI, Fingerprint |
INTRODUCTION |
| Location Based Services (LBS) allow obtaining information about the mobile device (MD) in relation to references
on a predefined space [1]. In this sense, positioning systems that are based on Wi-Fi signals have gained great
significance in recent years because they allow calculating the position using an already-existing infrastructure in most
buildings and public places, meaning that the installation of no additional hardware is required on the MDs, since most
of them already offer access to Wi-Fi connections. |
| The techniques used to calculate a position in an enclosed space are classified, based on the sensor technology used,
in: Time of Arrival (ToA), Angle of Arrival (AoA), and Received Signal Strength Indicator (RSSI). In the case of
RSSI, there are two main models used to calculate the position of the MD: signal propagation model and empirical
model. The former is based on the application of mathematical models that determine signal behavior and its
degradation while it propagates. The empirical model calculates the position based on parameters that are stored in a
database. Within the latter, the algorithm that is most widely used for calculating positions is the Fingerprint algorithm
[2] [5]. |
| The Fingerprint technique is the most widely used technique nowadays, due to its high degree of accuracy and its
low implementation costs. These systems offer an accuracy of 2-3 meters in enclosed spaces, and 10 meters in outdoor
areas [3] [4]. |
| Several developments have been carried out in the area of device location using RSSI, and the Fingerprint technique
in particular. One of the first approaches is the RADAR system [6], which combines two methods – an empirical model
using Fingerprint and a mathematical model that takes into account signal propagation. The system obtains a mean
accuracy within 2-3 meters. |
| In [7], the authors of the RADAR system implement improvements, such as multipath and interference, with the
purpose of analyzing and reducing problems that are inherent to the nature of the signal. They also analyze
environmental changes during the experimental phase. The accuracy obtained is less than 2 meters. |
| In 2003, the LEASE system [8] offers a framework based on the Fingerprint technique that achieves an accuracy of
2.1 m. The Ekahau commercial system [9] is a positioning software that consists in an administrator, a server, and a
client. The administrator records the strength of the signal at the access points (APs), and creates the positioning database. The client sends requests to the server, and the server responds by calculating the position. System accuracy
is 2-3 meters. |
| The Aeroscout commercial system [10] has 4 main components: positioning tags, mobile devices, a calculation
engine, and a receiver. To calculate the position, a hybrid technique is used combining the ToA technique and RSSI
processing. The system achieves a relative accuracy of 2-3 meters. |
| In 2003, a signal propagation model [11] is used; this model obtains a third-degree polynomial regression to
calculate the position of the MD, achieving an accuracy of 1-3 meters. In 2004, the Fingerprint method is used with two
schemes [12]: The first one is based on changing the number of sampling points using the Euclidean distance as metric,
while the second one uses the enhanced Euclidean distance and the standard deviation of sampling sets as weights. The
system achieves a relative error of 2-3 meters. |
| In 2006, a system is presented that uses Fingerprint and the Euclidean distance method with an enhancement
algorithm that uses fuzzy logic [13]; an accuracy of 4.47 m is obtained first and then, with fuzzy logic, it is improved to
3 m. |
| In 2008, a calculation method based on a clustering algorithm is used [14], called Cluster Filtered KNN (K-Nearest
Neighbors); results are then compared to those obtained with the KNN calculation method. The system achieves an
accuracy of 2 meters. |
| In 2008, a positioning system is implemented that is based on a multilayer neural perceptron [15] that uses AP RSSI
values as metric, and then compares the results obtained with the WKNN and traditional KNN algorithms. The system
achieves a relative accuracy of 2 meters. |
| In 2010, a technique called PKNN (Predicted KNN) [16], based on the historical positioning data of a mobile device,
is used. The technique achieves a 33-percent improvement in relation to the traditional KNN algorithm, with an
accuracy of 1.3 meters |
| Also in 2010, the Fingerprint technique is used in combination with a propagation model [17] to calculate the
position of a MD. The propagation model is defined based on the physical features of the environment, calculating the
Wall Attenuation Factor (WAF). The proposed system uses a filter to improve accuracy, and achieves an error that is
below 1.8 meters. |
| In 2011, a Fingerprint positioning system is presented that is based on the LDPL (Long Distance Path Loss)
propagation model to calculate the distance between the pattern vector and the vectors stored in the database, without
using the Euclidean distance [18]. The system introduces an improvement of the order of 10% in relation to the KNN
algorithm, with an error of the order of 2 meters. |
| In this article, we present the development of a positioning system that is based on the Fingerprint technique but
introduces certain improvements in database building by means of statistical and mathematical techniques. In the
experimental phase, the results obtained are analyzed considering spaces with various obstacles with the purpose of
presenting the metrics obtained with the system. |
| This paper is organized as follows: Section 2 summarizes the state of the art, Section 3 presents the technique used,
Section 4 describes the experiments carried out, and Section 5 analyzes the results obtained during positioning
operations. Finally, Section 6 describes the conclusions and future work. |
II. EMPIRICAL MODEL: FINGERPRINT TECHNIQUE |
| Within the empirical model, most positioning systems use triangulation or fingerprinting algorithms to calculate the
position of the MD. In the case of the Fingerprint algorithm, first a radio map is designed containing RSSI
measurements for each visible AP in the coverage area of the MD. All the values obtained are stored in a database.
Then, the location can be calculated by obtaining a strengths pattern vector and applying an algorithm that allows
matching this vector with the values stored in the database [19]. |
| Calculation algorithms correlate the values obtained between the location information and the Fingerprint database
to determine the relative position of the MD. There are two classes of algorithms: probabilistic and deterministic |
| The most widely known deterministic method is that of the “nearest neighbor.” In this case, the strength vector is
compared with the vectors stored in the database in order to determine their proximity, which is calculated based on the distance between vectors. The most commonly used distance metric is the Euclidian distance. The vector that is closest
to the input value determines the location of the MD. |
| The main disadvantage of this method is that it requires calculating the distance from the pattern vector to each of
the vectors stored in the database, which increases computation time. In this sense, stored vectors are pre-processed
with the purpose of summarizing their values and reducing algorithm search times [20]. |
III. EXPERIMENTAL DESIGN |
| Even though experiments are done all over the campus of the National University of the Center of the Province of
Buenos Aires, the data analyzed in this paper are only those collected in certain offices of the INTIA/INCA research
institute. |
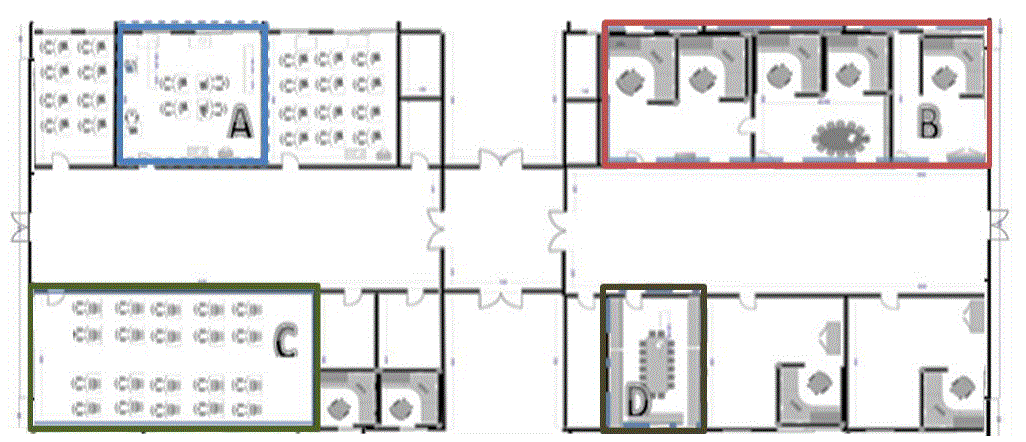
| To carry out measurements and design the radio map, 4 areas are considered as spatial references (Figure 1). Each of
these areas was set up with sampling points at 1 meter steps between them. Table 1 shows the number of sampling
points and calculation points, classified by area. |
| Data were captured with IWLIST on Ubuntu 8.04, and were processed with the WifiPos tool, developed in C
language in a Windows environment. |
| The data capture process for building the radio map is as follows: |
| 1. MD positioning at a reference point on the map, within a selected area. |
| 2. Scanning and capturing RSSI values for 180 seconds to stabilize sampling signal. |
| 3. Scanning, capturing and storing the RSSI and SSID parameters corresponding to the signal of the various APs
that are within reach at that position for 120 seconds |
| 4. Moving the device to the next point of reference in the map, and repeating step (1) if it is not the last point. If it is
the last point, the MD is moved to the next area. |
| Once the data are sampled, the Fingerprint database is built to then apply the KNN algorithm during the calculation
phase. For each sampling point, 120 strengths vectors are obtained. Each vector stores the RSSI value for visible APs,
and the strengths values for each of them. In this paper, data are statistically and mathematically pre-processed, so that
access time and algorithm calculation time can be minimized. |
| Given a set of RSSI values obtained from each AP, the following calculations are performed at each coordinates
point in each area |
| Maximum Values: The maximum value of RSSI reached by the AP is obtained. |
| Minimum Values: The minimum value of RSSI reached by the AP is obtained. |
| Average: The arithmetic average of the values obtained is calculated. |
| Mode: The mode is calculated with the total of the samples obtained. |
| Interquartile Pair: data are sorted in ascending order and then divided in 4 sets with equal number of elements.
Both end quartiles are removed, and the following are calculated from the inner quartiles: |
| average |
| arithmetic mean |
| Interquartile Pair Mean Value: The mean value of the interquartile pair is obtained. |
| This way, instead of working with the entire database and comparing against all vectors for each position of the MD,
it is possible to compare only against the results of the vectors that were processed |
IV. RESULT ANALYSIS |
| During the calculation phase, the MD is positioned at a reference point on the map within a given area (Figure 1),
and "pattern vectors" are obtained for the strengths of the visible APs for a period of 120 seconds. Then, with these
vectors and each of the strength vectors previously stored (maximum values, minimum values, average, mode, and
interquartile pair mean value), the Euclidean distance is calculated by obtaining the distances to each point of reference. |
| The position of the MD is determined as the point of reference with the shortest distance between the training set
(Fingerprint database) and the input data pattern. |
| Result analysis is divided in three stages. First, a quantitative analysis of the errors is carried out, considering the
results obtained at each calculation point within each area. Considering the actual position of the device and the
position calculated by each of these techniques, the maximum error is determined that results in 95% of the times
locating the device with that maximum error. Then, the mode of these values is calculated so that the technique with the
lowest positioning error (expressed in meters) can be selected. |
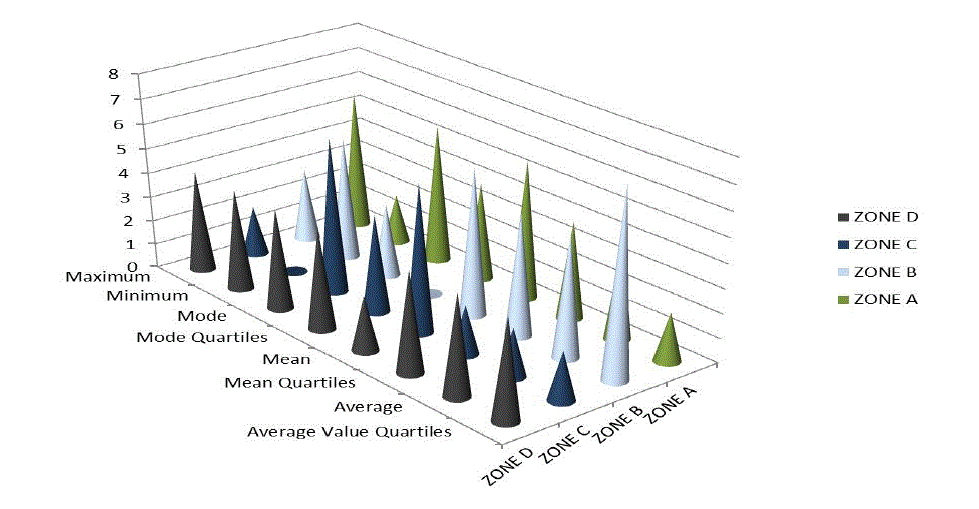
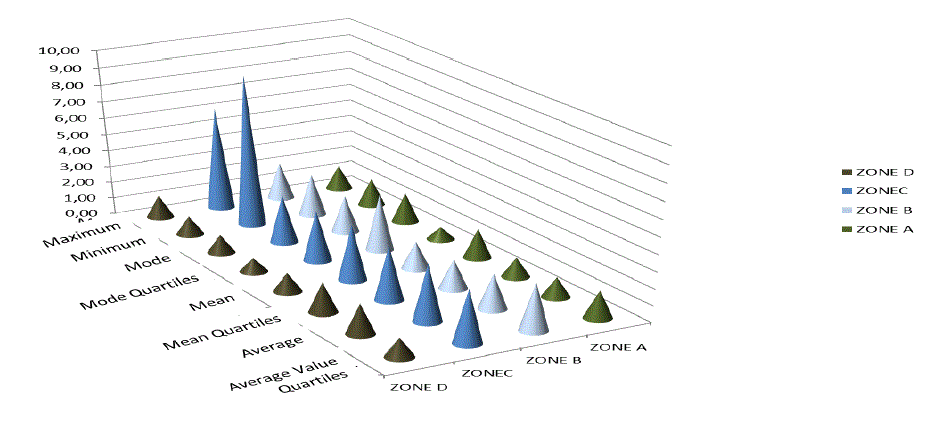
| Figure 2 shows the mode of the errors obtained with each of the techniques by reference point and by area. As it can
be observed, in areas A and C the "quartiles mean value" technique achieves a maximum error of 2 meters, while in
area D this maximum error is obtained with the "average" technique. In the case of area B, a maximum error of less
than 1 meter is obtained with the "quartiles mode" technique. |
| Then, if we select areas A and D, the individual errors obtained 95% of the times at each point are presented, which
will help determine those techniques that offer the lowest positioning error margins. |
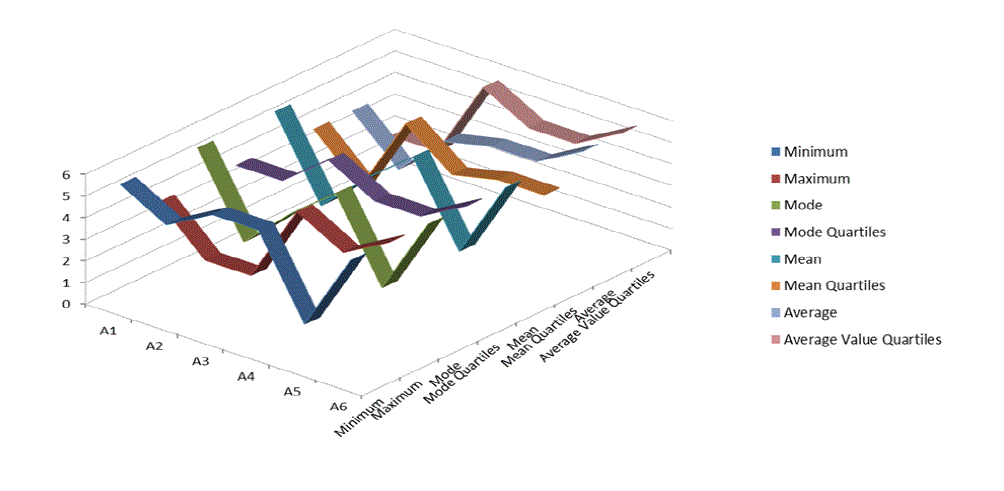
| Figure 3 details the maximum errors (measured in meters) obtained with each technique 95% of the times at the 6
calculation points in area A. At the inner positions, using the average and mode techniques, a maximum error of 2
meters is obtained, while in the worst of cases, this error is 4 meters with the mean value technique. |
| At the ends, where the MD is close to adjacent walls, the margin of error stays the same with the quartiles mode and
average techniques, yielding an error of 2 meters at positions A2 and A5. However, this error increases to 4 meters at
position A6. This increase in error magnitude is caused by phenomena (reflectance and absorption) that affect the
signal due to the presence of obstacles. |
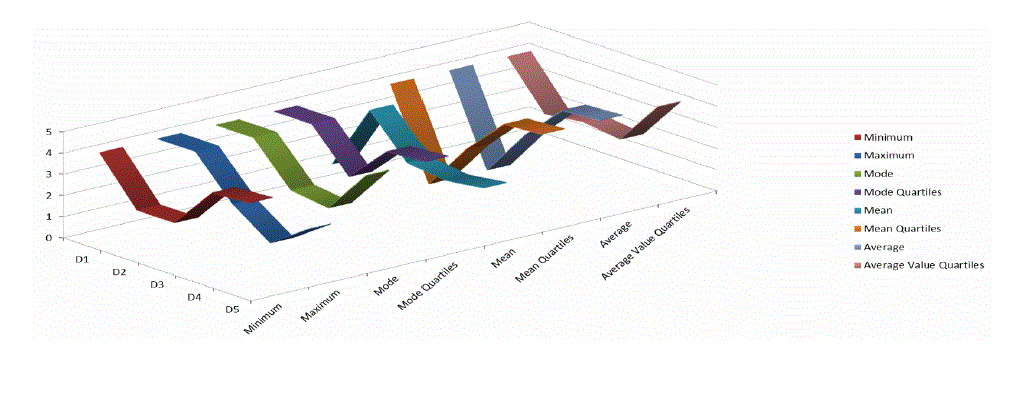
| Figure 4 shows the maximum errors (measured in meters) obtained with each technique 95% of the times at the 5
calculation points in area D. As it can be observed, the inner positions have a maximum error of 2.2 meters, whereas
for the remaining positions, the maximum error obtained is 4.2 meters. This larger error is caused by signal strength
fluctuations and signal absorption, both effects related to the presence of obstacles that are adjacent to the calculation
points. |
| Finally, a dispersion analysis of the errors obtained with each technique is carried out, considering the standard
deviation and, as a second instance, calculation points absolute errors |
| Figure 5 presents the standard deviations of the errors obtained with each technique. It can be observed that in areas
A, C and D, the “quartiles mode” technique offers lower data dispersion on the set of values obtained. It can then be
inferred that, in these areas, the errors achieved with this technique are somewhat more clustered around a central
value, which in this case is 4 meters. In area B, the technique that offers the lowest error dispersion is the "average"
technique. |
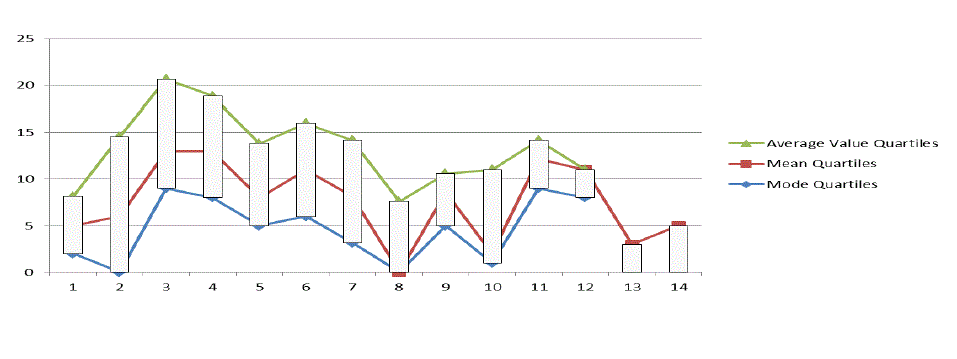
| Figure 6 presents the dispersion of the errors obtained at all calculation points in area B, considering the following
techniques: quartiles mode, quartiles average, and quartiles mean value. It can be observed that the set of values
obtained with the "quartiles mode" technique has a lower dispersion, similar to the standard deviation values shown in |
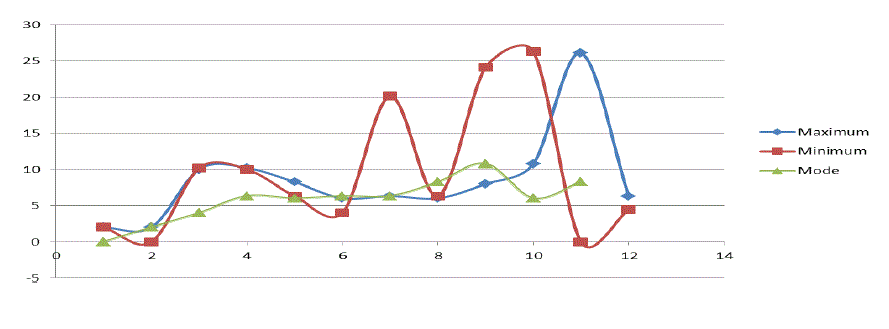
| Figure 7 presents the dispersion of the errors obtained at all calculation points in area C, considering the following
techniques: maximum, minimum, and mode. It can be observed that the set of values obtained with the "mode"
technique has a lower dispersion, similar to the standard deviation values shown in Figure 5. |
V. CONCLUSIONS AND FUTURE WORK |
| A comparative analysis of an indoor positioning system that uses the Fingerprint technique with variations is
presented. Several experimental areas have been considered, of various sizes and with different types of inner obstacles.
Based on the analysis carried out, and considering each of the techniques proposed, an accuracy of two meters for
positioning MDs is achieved. The technique that yields the best accuracy is the one that considers inner value quartiles
and the average; the accuracy in this case is less than two meters. |
| The use of a summary Fingerprint database is to be highlighted, since it allows reducing computational load and
maintaining positioning efficacy |
| As future work, efficacy will be analyzed in outdoor areas. Various mathematical models that allow taking into
account environmental variables and the characteristics of the signals analyzed will be considered. |
ACKNOWLEDGMENT |
| This work was supported by Consejo Nacional de Investigaciones Científicas y Técnicas (CONICET). |
Tables at a glance |
 |
| Table 1 |
|
| |
Figures at a glance |
 |
 |
 |
 |
| Figure 1 |
Figure 2 |
Figure 3 |
Figure 4 |
|
 |
 |
 |
| Figure 5 |
Figure 6 |
Figure 7 |
|
| |
References |
- T. S. Rappaport, J. H. Reed, and B. D. Woerner, „Position location using wireless communications on highways of the future‟, IEEECommunic. Vol. 34, No. 10, pp. 33-41, 1996.
- Retscher G., E. Mok, W.-Y. Yan, „Performance Test of Location-based Services in Hong Kong‟, European Journal of Navigation, Vol. 3,No. 3, pp. 22-27, 2005.
- Cheng Y.C., Y. Chawathe, „Accuracy Characterization for Metropolitan-scale Wi-Fi Localization‟, Intel Research, Vol. 1, No. 1, pp.1-10.2005.
- Retscher G., E. Mok, W.-Y. Yan, „Performance Test of Location-based Services in Hong Kong‟, European Journal of Navigation, Vol. 3,No. 3, pp. 22-27, 2005.
- K. Pahlavan, X. Li, and J. P. Makela, „Indoor geolocation science and technology‟, IEEE Communications Magazine., Vol. 40, No. 2, pp.112-118, 2002.
- P. Bahl and V. N. Padmanabhan, „RADAR: An in-building RF based user location and tracking system‟, IEEE Infocom 2000, Vol.2, No.1, pp. 775-784, 2000.
- ParamvirBahl, Venkata N. Padmanabhan, AnandBalachandran, „Enhancements to the RADAR User Location and Tracking System‟,Microsoft Academic Research, Technical Report. Vol 1, No. 1, pp. 1-13, 2000.
- P. Krishnan, A. S. Krishnakumar, Wen-Hua Ju, Colin Mallows, Sachin Ganu, „A System for LEASE: Location Estimation Assisted byStationary Emitters for Indoor RF Wireless Networks‟, IEEE Infocom 2004, Vol. 1, No. 1, pp. 1-11, 2004.
- Ekahau, „Ekahau positioning engine 2.0; 802.11 based wireless LAN positioning system‟, Ekahau Technology, Internal Report,www.eukahau.com, 2012.
- Aeroscout, „aeroscout positioning engine 2.0‟, aeroscout Technology, Internal Report, www.aeroscout.com, 2012.
- Y. Wang, X. Jia, and H.K Lee, „An indoors wireless positioning system based on wireless local area network infrastructure‟, 6th Int.Symp. on Satellite Navigation Technology Including Mobile Positioning & Location Services, Melbourne, pp. 1-13, 2003.
- KamolKaemarungsi and Prashant Krishnamurthy, „Modeling of Indoor Positioning Systems Based on Location Fingerprinting‟, IEEEInfocom 2004, Vol. 1, No. 1, pp.1-11, 2004
- A. Teuber, B. Eissfeller, „WLAN indoor positioning based on Euclidean distances and fuzzy logic‟, Proceedings of the 3rd Workshop onPositioning, Navigation and Communication (WPNC'06), Munich, Germany, pp. 159 – 168, 2006.
- Jun MA, Xuansong LI, Xianping TAO and Jian LU, „Cluster Filtered KNN: WLAN-Based Indoor Positioning Scheme‟, IEEE Infocom,Vol. 1, No. 1, pp.1-8, 2008.
- Shih-Hau Fang, Tsung-Nan Lin, „Indoor Location System Based on Discriminant-Adaptive Neural Network in IEEE 802.11Environments‟, IEEE transactions on neural networks, Vol. 19, No. 11, pp. 1973-1978, 2008.
- ShahrzadKhodayari, Mina Maleki, ElhamHamedi, „A RSS-based Fingerprinting Method for Positioning based on Historical Data‟,Symposium on Performance Evaluation of Computer and Telecommunication Systems (SPECTS), Ottawa, Canada, pp. 1-5, 2010.
- Yuhong Liu and Yaokuan Wang, „A Novel Positioning Method for WLAN Based on Propagation Modeling‟, Progress in Informatics andComputing (PIC), IEEE International Conference on Shanghai, Vol. 1, No. 1, pp. 397-401, 2010.
- Sukhoon Jung, Choon-oh Lee, and Dongsoo Han. „Wi-Fi Fingerprint-based Approaches Following Log-Distance Path Loss Model forIndoor Positioning‟, Intelligent Radio for Future Personal Terminals (IMWS-IRFPT), IEEE MTT-S International Microwave WorkshopSeries on. Daejeon, pp. 1-2, 2011.
- Li B.; Wang Y.; Lee, H.K.; Dempster A.G.; Rizos C., „A new method for yielding a database of location fingerprints in WLAN‟, IEEProc. Communications, Vol. 152, No. 5, pp. 580-586, 2005.
- Nelson Acosta, Juan Toloza, „A tool for prototyping a precision GPS system‟, International Journal of Computer & Technology, Vol 3,No. 1, pp.15-23, 2012.
|