Keywords
|
| Magnetic Resonance Imaging(MRI), CT- Scan, K-Means, ACO, CLAHE algorithm, Brain Tumor. |
INTRODUCTION
|
| Brain cancer is a tumor or cancerous growth in the brain. A tumor, whether in brain or elsewhere, is a mass of cells that reproduce themselves in an uncontrolled way. There are two main types of brain tumor. Brain cancer that originates in the brain is called a primary brain tumor. It can spread and destroy nearby parts of the brain. Cancers of the breast, lung, skin, or blood cells (leukemia or lymphoma) can also spread (metastasize) to the brain, causing metastatic brain cancer. Brain tumors can be benign, with no cancer cells, or malignant, with cancer cells that grow quickly.Benign brain tumors are abnormal collections of cells that reproduce slowly and usually remain separate from the surrounding normal brain.They grow slowly, do not spread to other parts of the brain and can usually be removed more easily than malignant tumors. Malignant tumors grow and spread aggressively, overpowering healthy cells by taking their space, blood, and nutrients. Like all cells of the body, tumor cells need blood and nutrients to survive.Their borders are hard to distinguish from the normal brain around them. That is why it is hard to remove them completely without damaging the surrounding brain. |
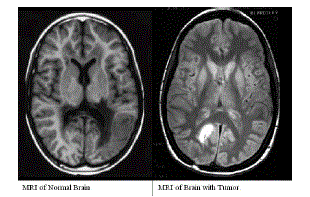
| Tumors may or may not be symptomatic: some tumors are discovered because the patient has symptoms, others show up incidentally on an imaging scan. Identifying the presence of a brain tumor is the first step in determining a course of treatment.In case of brainimages, MRI scan is preferred than CT scan, the reason is as follows: |
A. CT Scan
|
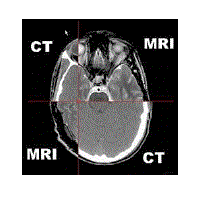
| A CT scan combines sophisticated x-ray and computer technology. CT can show a combination of soft tissue, bone, and blood vessels. CT images can determine some types of tumors, as well as help detect swelling, bleeding, and bone and tissue calcification. Usually, iodine is the contrast agent used during a CT scan. |
B. MRI Scan
|
| MRIis a scanning device that uses magnetic fields and computers to capture images of the brain on film. It does not use x-rays. It provides pictures from various planes, which permit doctors to create a three-dimensional image of the tumor. The MRI detects signals emitted from normal and abnormal tissue, providing clear images of most tumors. |
| An MRI is performed in a similar way to a CT scan - the patient usually enters a cylindrical machine. However, an MRI scan tends to last longer, and can last up to 45 minutes. In some cases, the patient will be injected with a dye, helping the technician to make the image even clearer.MRI scans are far superior for collecting images for areas of the body apart from bone. They are also more versatile, and are used for help in diagnosing a wide variety of conditions.Another benefit to an MRI scan is that it does not expose either patient or technician to potentially harmful radiation. Although the length of time of exposure is relatively short, CT scans still have this risk; there are no known adverse effects to the patient from an MRI scan. |
LITERATURE SURVEY
|
| Literature pertaining to detect brain tumor in MR Image of brain using K-Mean, CLAHE algorithm and ACO are presented. J. Selva Kumar, et al. proposed computer aided method for segmentation of tumor based on the combination of two algorithms [1]. The stage of tumor is displayed based upon the amount of area calculated from the cluster. P. Vasuda, S.Satheesh used improved fuzzy k means algorithm for MR brain image segmentation [3]. Emdaldin,et al. made use of hybrid image segmentation technique [5]. |
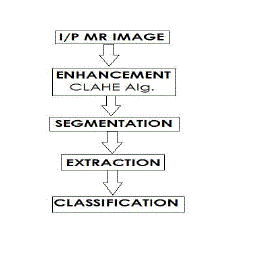
| This paper deals with Enhancement, Segmentation, Extraction and Classification of the MR Brain Image. Enhancement is done by using CLAHE algorithm which is succession of Adaptive Histogram Equalization. ACO is used for segmentation and K-means algorithm for classification of normal and abnormal tissues in the MR brain image. The use of ACO algorithm yields an efficient and accurate output with reduced timecomplexity. |
EXISTING SYSTEMS
|
PROPOSED SYSTEM
|
| The block diagram for the proposed method is shown in Figure 4.1. Enhancement is done using CLAHE (Contrast Limited Adaptive Histogram Equalization) algorithm. Segmentation, Extraction & Classification is done using (ACO) Ant Colony Optimizationcombined with K-Means algorithm. Noise removal is achieved in the first level of image enhancement via CLAHE algorithm. Basically, ACO algorithm is used for segmentation of any image in a more accurate manner in less time and K-means is used in classification of normal and abnormal tissues in the MR brain image. So, the MR brain tumor image is trained in the K-means algorithm and then combined with the ACO algorithm for the segmentation process. |
A.Image Enhancement Using CLAHE Algorithm
|
| CLAHE(Contrast Limited Adaptive Histogram Equalization)is an improved version of AHE (Adaptive Histogram Equalization). Both overcome the limitations of standard histogram equalization.CLAHE differs from ordinary adaptive histogram equalization in its contrast limiting. Sharp field edges can be maintained by selective enhancement within the field boundaries. Selective enhancement is accomplished by first detecting the field edge in a portal image and then only processing those regions of the image that lie inside the field edge. |
B. Image Segmentation Using ACO Algorithm
|
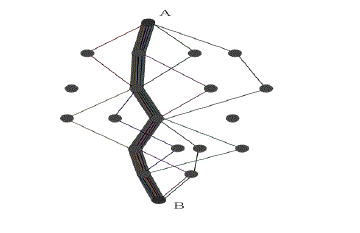
| ACO is a probabilistic technique for solving computational problems which can be reduced to finding good paths through graphs.Initially proposed by Marco Dorigo in 1992 in his PhD thesis, the first algorithm was aiming to search for an optimal path in a graph, based on the behavior of ants seeking a path between their colony and a source of food. The original idea has since diversified to solve a wider class of numerical problems, and as a result, several problems have emerged, drawing on various aspects of the behavior of ants. |
| In a series of experiments on a colony of ants with a choice between two unequal length paths leading to a source of food, biologists have observed that ants tended to use the shortest route.A model explaining this behavior is as follows: |
| 1. An ant (called "blitz") runs more or less at random around the colony |
| 2. If it discovers a food source, it returns more or less directly to the nest, leaving in its path a trail of pheromone |
| 3. These pheromones are attractive; nearby ants will be inclined to follow, more or less directly, the track returning to the colony, these ants will strengthen the route |
| 4. If there are two routes to reach the same food source then, in a given amount of time, the shorter one will be traveled by more ants than the long route |
| 5. The short route will be increasingly enhanced, and therefore become more attractive |
| 6. The long route will eventually disappear because pheromones are volatile; |
| 7. Eventually, all the ants have determined and therefore "chosen" the shortest route. |
| The basic philosophy of the algorithm involves the movement of a colony of ants through the different states of the problem influenced by two local decision policies, viz., trails and attractiveness. Thereby, each such ant incrementally constructs a solution to the problem. When an ant completes a solution, during the construction phase, the ant evaluates the solution and modifies the trail value on the components used in its solution. This pheromone information will direct the search of the future ants. Furthermore, the algorithm also includes two more mechanisms, viz., trail evaporation and daemon actions. Trail evaporation reduces all trail values over time thereby avoiding any possibilities of getting stuck in local optima. The daemon actions are used to bias the search process from a non-local perspective. |
C. Classification Using K-Means Algorithm
|
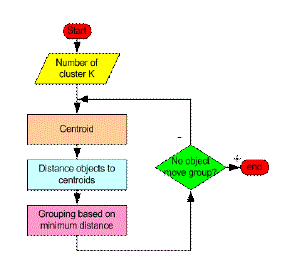
| The K-Means is a simple clustering algorithm used to divide a set of objects, based on their attributes/features, into k clusters, where k is a predefined or user-defined constant. The main idea is to define k centroids, one for each cluster. The centroid of a cluster is formed in such a way that it is closely related (in terms of similarity function) to all objects of that cluster.Since the number of clusters to be formed is predefined, the objects in the input list are initially divided into random groups, that is, each object is assigned to a random cluster. After this, the algorithm iteratively refines each group by moving objects from irrelevant group to relevant group. The relevance is defined by the similarity measure or function. Whenever a new object is added or removed from a cluster, its centroid is updated or recalculated. Each iteration is guaranteed to increase the similarity between all the points inside a cluster. This iterative refinement is continued until all the clusters become stable i.e. there is no further movement of objects between clusters. The k-means algorithm is also referred to as Lloyd's algorithm. |
D.Demonstration of K-Mean Algorithm
|
| Steps followed in k-means algorithm are: |
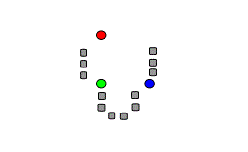
| 1) k initial "means" (in this case k=3) are randomly generated within the data domain (shown in color). |
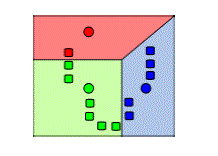
| 2) k clusters are created by associating every observation with the nearest mean. The partitions here represent the Voronoi diagram generated by the means. |
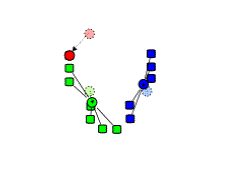
| 3) The centroid of each of the k clusters becomes the new mean. |
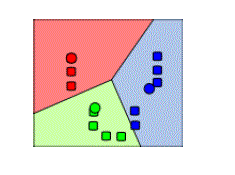
| 4) Steps 2 and 3 are repeated until convergence has been reached |
SOFTWARE USED
|
| A. MATLAB |
| The MATLAB version used here is Matlab 7.6.0(R2008a). MATLAB is used for a range of applications, including signal processing and communications, image and video processing, control systems, test and measurement, computational finance, and computational biology. More than a million engineers and scientists in industry and academia use MATLAB, the language of technical computing. Image Processing Toolbox provides a comprehensive set of reference-standard algorithms and graphical tools for image processing, analysis, visualization, and algorithm development. We can perform image enhancement, image de-blurring, feature detection, noise reduction, image segmentation, geometric transformations, and image registration. |
| Image Processing Toolbox supports a diverse set of image types, including high dynamic range, gigapixel resolution, embedded ICC profile, and tomographic. Graphical tools allow us to explore an image, examine a region of pixels, adjust the contrast, create contours or histograms, and manipulate regions of interest (ROIs). With toolbox algorithms we can restore degraded images, detect and measure features, analyze shapes and textures, and adjust color balance. |
RESULTS
|
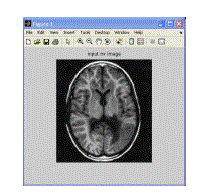
| A. Input MR Brain image |
| The input image is shown in Figure 6.1. |
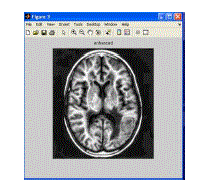
| B. Output Enhanced MR Brain Image. |
| The given input MR Image of Brain is enhanced in the initial stage by using CLAHE algorithm.The Enhanced output image is shown in Figure 6.2. |
CONCLUSION ANDFUTURE WORK
|
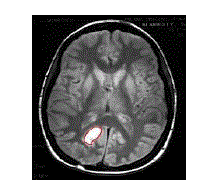
| Thus by using CLAHE algorithm, removal of noise and enhancement is done together. So, using CLAHE algorithm in the first level of implementation, will giveefficient image enhancement, compared to any other enhancement methods. And by using ACO algorithm extraction of tumor from brain MR image is done. Whereasusing K-Means algorithm, the brain tumor image is segmented and trained in with ACO for extraction and classification.Future work can be carried out in the 3D assessment of the brain using 3D slicer. |
Tables at a glance
|
 |
| Table 1 |
|
Figures at a glance
|
 |
 |
 |
 |
| Figure 1 |
Figure 2 |
Figure 3 |
Figure 4 |
|
 |
 |
 |
 |
| Figure 5 |
Figure 6 |
Figure 7 |
Figure 8 |
|
 |
 |
 |
 |
| Figure 9 |
Figure 10 |
Figure 11 |
Figure 12 |
|
References
|
- Sevla Kumar J, Arivoli T, Lakshmi A.“Brain Tumor Segmentation and its Area calculation in Brain MR Imagesusing K-Mean Clustering and Fuzzy C-Mean Algorithm”. International Conference on Advantages In Engineering,Science and Management. March 2012.
- M.C. Jobin Christ, R.M.S. Parvathi. “Detection of Brain Tumor using Hybrid Topology Preserving Map”. InternationalJournal of Computer Applications, August 2012.
- P. Vasuda, S.Satheesh. “Improved Fuzzy C-Means Algorithm for MR Brain Image Segmentation”. InternationalJournal of Computer Science and Engineering, 2010.
- Lalit P. Bhaiya, SuchitaGoswami. “Classification of MRI Brain Images using Neuro Fuzzy Model”. InternationalJournal of Electronics Communication and Computer Engineering, 2012.
- EmadaldinMozafariMajd, M.A. As’ari, U.U. Sheik, S.A.R. Abu-Bakar. “Hybrid Image Segmentation using Fuzzy CMeansand Gravitational Search Algorithm”.Fourth International Conference on Digital Image Processing, 2012.
- Caroline Pantofaru, Martial Hebert. “A Comparison of Image Segmentation Algorithm”. TheRobotics Institute,Carnegie Mellon University, September 2005.
- M.Masroor Ahmed, Dzulkifli Bin Mohamad. “Segmentation of Brain MR Images of tumor extraction by combining KMeansClustering and Perona-Malik Anisotropic Diffusion Model”. International Journal of Image Processing. Volume2, 2010.
|