Local Variability in the Sagittae Otolith Shape of Mugil cephalus from the Sea of Tabarka and the Dam of Nebeur in Tunisia
Maïssa Khedher1*, Abderraouf Ben Faleh1, Manel Fatnassi1, Manel Rebaya1, Abdellah Chalh2, Jean-Pierre Quignard3 and Monia Trabelsi1
1Unit of Marine Biology, Faculty of Sciences, Tunis El Manar University, Tunis, Tunisia
2Unit of Population Genetics and Biological Resources, Faculty of Science, Campus University, Tunis, Tunisia
3Laboratory of Ichthyology, University Montpellier II, France
- *Corresponding Author:
- Maïssa Khedher
Unit of Marine Biology
Faculty of Sciences, Tunis El Manar
University, Tunis
Tunisia
Tel: +21694520552
E-mail: khedhermaissa@yahoo.fr
Received date: 20/07/2017; Accepted date: 22/09/2017; Published date: 24/09/2017
Visit for more related articles at Research & Reviews: Journal of Zoological Sciences
Abstract
The otolith shape analysis is a powerful tool to use in studies focusing to marine biology and ecology in various aquatic areas (marine, dam and lagoons) as well the identification of fish stocks of species. In the present study, the sagittae otoliths were used to compare specimens of Mugil cephalus collected from two Tunisian regions, Tabarka Sea and Nebeur Dam. We analyzed the shape variation by sex (male and female) and otolith side (left and right) in order to discriminate the stock structure of Mugil cephalus. Discriminant analysis demonstrated statistical differences in the otolith shape between specimens of two sampling sites, which indicate a clear population differentiation. Also, these results were confirmed by highly statistically significant difference between otoliths’ shape (left and right) for both sexes. Hence, the shape variability of otolith between these two sampling sites is probably correlated with local environmental factors.
Keywords
Mugil cephalus Otoliths shape,
Tabarka Sea, Nebeur Dam, Tunisia, Discriminant
function analysis
Introduction
The fish group of mullets (family Mugillidae) is common in many brackish water ecosystems such as lagoons, estuaries, and
small creeks around mangrove forests [1]. They are euryhaline species inhabiting from marine to freshwater environments [2,3] and
they constitute a fundamental protein resource for populations living in coastal areas [4,5]. In Tunisia, this family is represented by
five species: Mugil cephalus, Liza saliens, Lisa aurata, Lisa ramada and Chelonlabrosus [6,7]. The grey mullet Mugil cephalus has
the largest market value among other mullets species [8,9]. In fact, this species occurs worldwide mainly between latitudes 42°N
and 42°S [10,11] and plays an important role in the fisheries and aquaculture of tropical and subtropical regions of the world [12-14].
In the last decades, numerous investigations has been focused on fish sclerochronology using otoliths to the detriment of
other calcified structures such as elements of internal skeleton and scales [15-17]. According to literature, numerous investigations
[18-20] confirmed that otoliths have been showed as natural data loggers that record information at different temporal scales related
to their environment and growth, including, movement patterns and habitat interactions, age and growth [21-25].
This information can be interpreted at the population level in terms of the ecology, demography, life history of the species, and
hence they are considered fundamental to the management of fisheries and protected species around the world [26]. Specifically,
otoliths are hard-calcified structures located in the inner ear of all teleost fishes [27-29]. There are three pairs of otoliths named as
sagittae, asteriscus and lapillus [30].
The otolith shape analyses are powerful tools in the systematic research, species identification and stomach content of
predators [31-33]. The variability of otolith shape is a species-specific feature, which can be used to discriminate among stocks and
seems to be associated with genetic heterogeneity [28,34-37]. The morphological differences from fish’s species affect both the size
and shape of the otoliths [38-40]. Different factors such as tempeture deth and food influence the contour shape of the otolith [27,41-45].
However, there are also other factors such as phylogeny [46,47] and adaptive aspects related with the inner ear functions [38,48,49]. As
known, otholiths exhibited some phenotypique plasticity inter-and/or specifique and intrapopulationel [37,45,50].
Previous studies of Mugil cephalus focused on the biology of this species [51], morphological and genetic variations [52],
reproduction [53], the feeding as well as the otolith characters [53-55], however in Tunisia, no studies regarding the otolith morphological
characterization of Mugil cephalus.
The aim of this study was to evaluate for the first time by using otolith shape, the stock structure of Mugil cephalus from
marine (Tabarka Sea) and Nebeur Dam in Tunisia, which exhibited different ecological parameters. Also, we analyzed Sagittae
otolith shape variation of this species for two sides (left-right otolith) and both sexes (males and females) for each specimen (60
fish of each sampling site).
Materials and Methods
Sampling
Mugil cephalus individuals were collected during 4 months between February and May 2013 in two stations in Tunisia
(Tabarka Sea and Nebeur Dam) (Figure 1).
Figure 1: Sampling sites of the two Mugil cephalus populations (Tabarka and Nebeur) analyzed in this study.
Tabarka Sea located in the extreme northwest of Tunisia [56] and Nebeur or “Mellegue” dam, which is a large reservoir
drainage area (10.300 Km2) [57], located about 7 kilometers west of the city of Nebeur (Kef). For each sampling site we collected
and selected 60 specimens: 30 males (♂) and 30 females (♀).
Methods
We take the standard length of fish SL (mm) and we determined the total weight of fish TW (g) using a precision balance
(see Table 1).
Otolith Extraction
To access cavities containing sagittae otoliths, we open the skull; the cut was made with care to avoid destroying the otolith:
on the ventral side, the lid was removed over the head of the fish, the gills are visible and gill arches are cut on the inner edge,
using a chisel. A small incision in the outer portion of the bubble opens to the inner ear. Once collected, the otoliths (left and right)
were cleaned with distilled water, dried, wrapped in cotton wool and kept in Eppendorf tubes.
Otolith Analysis
A total of 180 otoliths were photographed using a digital camera (Sony) with high performance associated with a dissecting
microscope. The otolith photos were processed by the software: Adobe Photoshop CS6 which transforms the original image of the otolith into a binary image (Figure 2). Then, images were processed with "Shape 1.3" software, to determine, the Fourier
coefficients (a, b, c and d) which correspond to values of the projection image on the axes (X) and (Y) [58],(Figure 3) allowing to
describe the otolith contour.
Figure 2: Photo otolith (Left-Right) processed by Photoshop (B) from the two sampling sites.
Figure 3: Discriminant Function Analysis of M. cephalus for two sexes and two sides of otoliths.
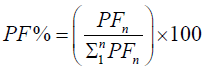
We calculated the Fourier Power (FP), the percentage of the Fourier Power (FP%) and the cumulative percentage of the
Fourier Power (FP%) to describe the silhouette of the otolith colled harmonic. Each harmonic was characterized by these Fourier
coefficients. The cumulative percentage of Fourier Power (PF%) is calculated in order to determine the necessary and sufficient
number of harmonics for better construction of the silhouette of the otolith [59]. This is obtained for a value equal to 99.99% of the
average cumulative percentage of Fourier Power (PFC%). The formulas are given by the following expressions:
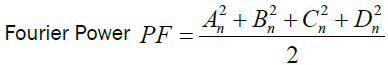
Percentage of Fourier Power
Cumulative percentage of Fourier Power: 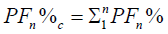
The obtained results are converted into Microsoft Excel so that they are processed by the statistical software.
Statistical Analysis
The statistical analysis of the otolith’s silhouette is conducted by the Elliptic Fourier Analysis (EFA) describing the shape of
this latest. A number of 20 harmonics are fixed (this number necessary and sufficient) to have the best possible otolith shape [59]. A
total of 180 replicates were obtained (60 observations for each sexes, thereby each left-right otolith sets and each study site). The
multivariate analysis was performed to treat all otolith parameters. The data matrix was previously subjected to the Discriminant
Function Analysis (DFA), to illustrate the differences and similarities between the observed groups and optimize the variability
existing between them [60]. All statistical analyses were performed using STAT EXCEL 2010 software.
Results
The Mahalanobis and Fisher Distances between two sides of otoliths (Right and left) and both sexes (male and female) for
the two sampling sites are indicated in Tables 1 and 2.
| |
Nebeur Dam
Males N=30 |
Nebeur Dam
Females N=30 |
Tabarka
Males N=30 |
Tabarka
Females N=30 |
| SL (mm) |
278 ± 27.3 |
276 ± 27.31 |
265 ± 24.1 |
245.5 ± 45.29 |
| TW (g) |
422 ± 67.2 |
388 ± 50.33 |
392 ± 49.10 |
430 ± 80.20 |
(SL: Standard length; TW: Total weight; SD: standard deviation; N: individuals number)
Table 1: Mugil cephalus mean and standard deviation of standard length (SL) and total weight (TW) of specimens of examined in this study.
| |
DFR |
DFL |
DMR |
DML |
TFR |
TFL |
TMR |
TML |
| DFR |
0 |
12.999 |
12.268 |
12,268 |
20.942 |
21.375 |
15.808 |
16.348 |
| DFL |
|
0 |
6.576 |
6.576 |
16.121 |
11.714 |
15.375 |
11.019 |
| DMR |
|
|
0 |
0.000 |
17.048 |
12.282 |
16.496 |
10.922 |
| DML |
|
|
|
0 |
17.048 |
12.282 |
16.496 |
10.922 |
| TFR |
|
|
|
|
0 |
11.985 |
6.079 |
11.864 |
| TFL |
|
|
|
|
|
0 |
13.479 |
7.794 |
| TMR |
|
|
|
|
|
|
0 |
10.381 |
| TML |
|
|
|
|
|
|
|
0 |
(DFR: Dam Female Right, DFL: Dam Female Left, DMR: Dam Male Right, DML: Dam Male Left, TFR: Tabarka Female Right, TFL: Tabarka Female Left, TMR: Tabarka Male Right, TML: TabarkhaMale Left)
Table 2: Pair wise Mahalanobis Distances between two sexes and two sides of otolith from the two sampling sites (Tabarka and Nebeur Dam).
For both stations, females have more similarity in the left otoliths than the right (Tables 1 and 2). The right otolith showed
the highest Mahalanobis distance (20.942) while the left one exhibited the lowest value (11.714). Also, the two sides of otoliths
(right and left) have statistically significant differences (P=0.031).
For the two populations, males have a higher similarity in the left otolith than in the right with Mahalanobis distances ranged
from 10.922 to 16.496 respectively. In addition, statistically significant differences were recorded between the two sides of the
otoliths (P=0.013).
Indeed, the comparison within the same population, the P-value (left–right) of Fisher distance was not significant,
P-value=1>0.05 (the two populations are confounding) for the males originally from Dam population (case of left–right symmetry).
While the P-values were statistically significant (P=0.03< 0.05) for the females of Nebeur Dam, the males and females of Tabarka
(male P=0.054, female P=0.009) (case of left–right: symmetry for male and asymmetry for female) (as shown in Table 2 below
the diagonal). In another hand, sexual dimorphism was observed for female and male right of Dam population (P=< 0.0007< 0.05),
but not for female and male left, P=0.766>0.05. This result indicates that in Dam population, the dimorphism was significant only
for right otoliths. However, no difference was detected between males and females of Tabarka population (for female and male
left, P=0.449>0.05), (for female and male right, P=0.868>0.05).
The Wilks’ lambda tests of discriminant analysis indicated significant differences for the two sampled populations (Wilk’s
lambda=0.025; P< 0.0001) (Tables 3 and 4).
| |
DFR |
DFL |
DMR |
DML |
TFR |
TFL |
TMR |
TML |
| DFR |
0 |
1.703 |
1.607 |
1.607 |
2.743 |
2.800 |
2.071 |
2.141 |
| DFL |
0.003 |
0 |
0.861 |
0.861 |
2.112 |
1.534 |
2.014 |
1.443 |
| DMR |
0.007 |
0.766 |
0 |
0.000 |
2.233 |
1.609 |
2.161 |
1.431 |
| DML |
0.007 |
0.766 |
1.000 |
0 |
2.233 |
1.609 |
2.161 |
1.431 |
| TFR |
<0.0001 |
<0.0001 |
<0.0001 |
<0.0001 |
0 |
1.570 |
0.796 |
1.554 |
| TFL |
<0.0001 |
0.013 |
0.006 |
0.006 |
0.009 |
0 |
1.766 |
1.021 |
| TMR |
<0.0001 |
0.000 |
<0.0001 |
<0.0001 |
0.868 |
0.001 |
0 |
1.360 |
| TML |
<0.0001 |
0.028 |
0.031 |
0.031 |
0.011 |
0.449 |
0.054 |
0 |
Table 3: Fisher Distances between two sexes and two sides of otolith from two sampling sites (Tabarka and Nebeur Dam) above diagonal and P-values below diagonal.
| Lambda |
0.025 |
| F (Observed value) |
1.435 |
| F (critical value) |
1.128 |
| DDL1 |
539 |
| DDL2 |
1102 |
| p-value |
<0.0001 |
| Alpha |
0,05 |
Table 4: The Wilks' Lambda test.
In discriminant function analysis, the first canonical function accounted for the largest amount of between-stock variability
(39.25%), while the second accounted for 24.41 % respectively. Plotting DF1 and DF2 explained 63.67% of variability between
populations (Figure 3).
In the discriminant analysis, DF1 differentiate the two populations distributed in marine and freshwater. Also, the centroids
projections showed clearly a discrimination between both sexes for Tabarka (♀ (- 2.194, - 0.846) and ♂ (- 1.869, - 0.645)) and
Nebeur Dam (♀ (1.258, 1.051) and ♂ (1.623, 1.623)) respectively.
We revealed significant differences (p< 0.05) between the pair of otoliths (L and R) of ♀ from both sites, marine and freshwater
(P=0.013, < 0.0001). Also, statistically significant differences were recorded between the left and right otolith of ♂ from both
stations, marine and freshwater (P=0.031). Our statistical analyses confirm the occurrence of statistically significant differences
from the otoliths in the two sampling sites.
Discussion
The otolith shape variability was analyzed for Mugil cephalus in two stations: Tabarka Sea and Nebeur Dam. In this study, the
Fourier analyses results for the pair of otoliths (left and rights) compared by sex confirms the existence of two different populations
of Mugilidae along the Tunisian coast. The discriminant function analysis showed that the otolith shape have statistically significant
differences in these two stations. Also, these results were confirmed by highly statistically significant difference between otoliths’
shape (left and right) for both sexes.
Generally, otoliths are natural data loggers that record information at different temporal scales related to their
environment [61]. Hence, the difference in the morphology detected between the two populations was related to the different
properties of the dam environment such as Food and reproductive strategies from the marine environment to the dam [62,63]. In
this way, environmental factors (such as temperature, salinity, feeding and depth) could probably cause the geographic variations
in the shape or appearance of the otolith nucleus, otolith annuli, and variations in the ratio of otolith size to fish size [64]. In this
way, Chang et al. [65] confirmed that the otolith elemental composition of Grey Mullet Mugil cephalus can be affected by the salinity
which differed from fresh water and seawater.
In this context, Trojette et al. [60], confirmed otolith shape variation in three populations of the brown rockfish Scorpaenaporcus
from marine and island environments along the Tunisian coast. Also, Leguá et al. [32] described significant differences of otolith
shape of Micromesistius australis between the Pacific and Atlantic oceans but these differences were not affected by sexe.
In this case, for Mugilcuremain Cuyutlan Lagoon (Mexico), Espino-Barr et al. [66] revealed a morphometric differences in two
sexes between right and left otoliths (sagitta, asteriscusand lapillus) of fish sides. Recently, Rebaya et al. revealed an extensive
morphological variation of sagitta shape of Liza Ramada from marine (Sea resort of Cap Zebib) and freshwater waters (Mellegue
Dam) in Tunisia which correlated with local environmental and ecological factors.
Otolith shape analyses are based on the geographical variation, even within a species [35] and have higher morphological
specificity [67-71]. Due to these properties, otolith shape is a useful tool for identifying intraspecific relationships (biological
interactions or stock groups within a population) and interspecific relationships [72].
In this case, Hüssy [73] reported that the size and shape of the otoliths of Gadus morhua are ontogenetic effects but small
differences in shape can result specifically from the availability of food and other environmental factors. In addition, the water
chemistry is a considerable factor influencing the otolith [19].
In order to explain differences in intraspecific size otolith shape in fish species Platt and Popper suggested that otoliths are a
very important part of the fish’s inner ear and play an important role in the sound transduction process [74]. Additionally, variability
in otolith size is an indicator of the way how the teleostean inner ear functions [38,41,48,49,75,76].
In another way, Morales-Nin [44] claimed that the environments occupied by each species can influence otolith growth which
is closely related to depth and temperature [42,43]. Closely related species or populations from temperate or shallower waters have
relatively larger otoliths than those from colder or deeper water [34,77].
In this work, the otolith morphological difference between Tabarka Sea and the Nebeur Dam stock may be due to
environmental differences that correspond to marine and freshwater habitat respectively. Also, the otolith shape differences in
a same stock (left-right otoliths) in M. cephalus can be attributed to environmental influences (temperature, currentology, depth,
die) [50,63,78,79] or genetic mutations [59,80-106].
Conclusion
In conclusion, for this investigation, multivariate and Discriminant Fuction Analysis (DFA) were performed to analyze the
sagitta shape variability from two different sampling sites. Indeed, the statistical analyses demonstrated the presence of extensive
differences in otolith shape between Tabarka Sea and Nebeur Dam stock as well for both sexes and two sides (left-right). We can
speculate that this differentiation may explained by environmental factors.
In future, genetic investigations including D-loop mitochondrial region are necessary to confirm our results.
References
- Cardona L. Habitat selection by grey mullets (Osteichthyes: Mugilidae) in Mediterranean estuaries: the role of salinity. Sci Mar 2006;70:443-455.
- Harrison IJ and Howes GJ. The pharyngobranchial organ of mugilidae fishes; its structure, variability, ontogeny, possible fonction and taxonomic utility. Bull Brit Mus Nat Hist Zool 1991;57:111-132.
- Whitfield AK. Why are there so few freshwater fish species in most estuaries? J Fish Biol 2015;86:1227-1250.
- Nelson JS. Fishes of the world. 3rd edn. John Wiley and Sons, New York, USA. 1994; p: 600.
- Glamuzina B, et al. Some biological parameters of the thin-lipped mullet, Liza ramada (Pisces, Mugilidae) in the Neretva River delta (Eastern Adriatic, Croatian coast). Vie et Millieu 2007;3:131-136.
- Bayed A, et al. Pêche artisanale dans la lagune de MerjaZerga. Rapport pour l’Administration des Eaux et Forêts et de la Conservation desSols et programme. Med Wet 1997;2:70.
- Blel H, et al. Phylogenetic relationships in grey mullets (Mugilidae) in a Tunisian lagoon. Aqua Res 2008;39:268-275.
- Bahri S and Marques A. Myxosporean parasites of the genus Myxobolus from Mugil cephalus in Ichkeul lagoon, Tunisia: description of two new species. Diseases of Aquatic Organisms (Dis Aquat Org) 1996;27:115-122.
- Kheriji S, et al. Effets de la salinité et de la température du milieu sur le degré de saturation des acidesgras et sur les différentescatégories lipidiques des alevins de Mugilcephalus. Bull. Inst. Nat. Sci Techn Mer de Salammbô 2000;27:61-68.
- Render JH, et al. Reproductive development of stripped mullet in Louisiana estuarine waters with notes on the applicability of reproductive assessment methods for isochronal species. Trans Am Fish Soc 1995;124:26-36.
- Lan KW, et al. Effects of climate variability and climate change on the fishing conditions for grey mullet (Mugilcephalus L.) in the Taiwan Strait. Climatic Change 2014;126:189-202.
- Nash CE and Shehadeh ZH. Review of the breeding and propagation techniques for grey mullet, Mugilcephalus. ICLARM Studies and Reviews 1980;3:87.
- Crosettia D, et al. Geographic variability in the grey mullet Mugilcephalus: preliminary results of mtDNA and chromosome analyses. Aquaculture 1993;111:95-101.
- Imsiridou A, et al. Genetic identification and phylogenetic inferences in different Mugilidae species using 5S rDNA markers. Aqua Res 2007;38:1370-1379.
- Fossum P, et al. Special issue: 2nd International Symposium on Fish Otolith Research and Application, Bergen, Norway, Foreword. Fish Res 1998;46:1-2.
- Panfili J, et al. Manual of fish sclerochronology. Vol. I. Brest, France, 2002.
- Matta EM, et al. Otolith oxygen isotopes measured by high-precision secondary ion mass spectrometry reflect life history of a yellowfin sole (Limandaaspera). Rapid Commun Mass Spectrom 2013;27:691-699.
- Campana SE. Otolith science entering the 21st century. Marine and Freshwater Research 2005;56:485-495.
- Panfili P. Les otolithes, intégrateurs de l'histoire individuelle des poissons. In: Habilitation à diriger des recherches. Institut de Recherche pour le Développement (IRD), Université Montpellier 2, France. 2007; pp: 5-6.
- Morat F. Influence des apports rhodaniens sur les traits d’histoire de vie de la sole commune (Solea solea): Apports de l’etude mineralogique et chimique des otolithes. These de doctorat, Universite Aix Marseille II: Marseille, France. 2011; p: 308.
- Massou AM, et al. Effects of different food restrictions on somatic and otolith growth in Nile tilapia reared under controlled conditions. J Fish Biol 2002;60:1093-1104.
- Sweeting RM, et al. Crystalline otoliths in teleosts: comparison between hatchery and wild coho salmon (Oncorhynchus kisutch) in the Strait of Georgia. Rev Fish Biol Fish 2004;14:361-369.
- Oxman DS, et al. The effect of vaterite deposition on sound reception, otolith morphology, and inner ear sensory epithelia in hatchery-reared Chinook salmon (Oncorhynchus tschawytscha). Can J Fish Aquat Sci 2007;64:1469-1478.
- Radhakrishan K, et al. Otoliths - the biological CD-ROMs of fish. Current Science 2009;97:1121-1122.
- Limburga KE, et al. Tracking Baltic hypoxia and cod migration over millennia with natural tags. Proc Natl Acad Sci USA 2011;108:E177-E182.
- Begg AG, et al. Suthers, Otolith research and application: current directions in innovation and implementation. Mar Fresh Res 2005;56:477-483.
- Campana SE and Neilson JD. Microstructures of fish otoliths. Can J Fish Aqu Sci 1985;42:1014-1032.
- Campana SE and Casselman JM. Stock discrimination using otolith shape analysis. Can J Fish Aquat Sci 1993;50:1062-1083.
- Mendoza RPR. Otoliths and their applications in fishery science. Ribarstvo 2006;64:89-102.
- Das M. Age determination and longevity in fishes. Gerontology 1994;40:70-96.
- Akkiran N. A systematic study on Sparidae (Pisces) employing otolith characters in the East Mediterranean. METU of Pure and Appl Sci 1984;7:269-286.
- Leguá L, et al. Otolith shape analysis as a tool for stock identification of the southern blue whiting, Micromesistius australis Javier Lat. Am J Aquat Res 2013;41:479-489.
- Sadighzadeh S, et al. Use of otolith shape for stock identification of John’s snapper, Lutjanusjohnii (Pisces: Lutjanidae), from the Persian Gulf and the Oman Sea. Fish Res 2014;155:59-63.
- Torres GJ, et al. Saggitalotolith size and shape variability to identify geographical intraspecific differences in three species of Genus merluccius. J Mar Biol Assoc, UK 2000;80:333-342.
- Cardinale M, et al. Effects of sex, stock, and environment on the shape of known-age Atlantic cod (Gadusmorhua) otoliths. Can J Fish Aquat Sci 2004;61:158-167.
- Swan SC, et al. Otolith chemistry: an aid to stock separation of Helicolenus dactylopterus (bluemouth) and Merlucciusmerluccius (Europeanhake) in the Northeast Atlantic and Mediterranean, ICES. J Mar Sci 2006;63:504-513.
- Vignon M, et al. Evidence for spatial limitation of the blue stripesnapperLutjanuskasmira in French Polynesia from parasite and otolith shape analysis. J Fish Biol 2008;73:2305-2320.
- Paxton JR. Fish otoliths: do sizes correlate with taxonomic group, habitat and/orluminescence. Phil Tran Roy Soc Lond B 2000;355:1299-1303.
- Wright PJ, et al. Types of calcified structures: otoliths. In Manual of Fish Sclerochronology (Eds) Panfili J, de Pontual H, Tradec H and Wright PJ. Brest: Ifremer-IRD. 2002; pp: 31-57.
- Volpedo A and Echevarri ADD. Ecomorphological patterns of the sagitta in fish on the continental shelf off Argentine. Fish Res 2003;60:551-560.
- Lombarte L and Cruz A. Otolith size trends in marine fish communities from different depth strata. A Journal of Fish Biology 2007;71:53-76.
- Simkiss K. Calcium metabolism of fish in relation to ageing. In Ageing of Fish (Ed) Bagenal TB. Old Woking: Unwin Brothers, 1974; pp: 1-12.
- Wilson RRJ. Depth-related changes in sagitta morphology in six macrourid fishes of the Pacific and Atlantic Oceans. Copeia 1985; pp: 1011-1017.
- Morales-Nin B. Influence of environmental factors on microstructure of otoliths of three demersal fish species caught off Namibia. In the Benguela and Comparable Ecosystems. In: Payne AIL, Gulland JA, Brinkd KH (eds.), S Afr J Mar Sci 1987;5:255-262.
- Lombarte A and Lleonart J. Otolith size changes related with body growth, habitat depth and temperature. Environmental Biology of Fishes 1993;37:297-306.
- Gaemers PAM. Taxonomic position of the Cichlidae (Pisces, Perciformes) as demonstrated by the morphology of their otoliths. Neth J Zool 1984;34:566-595.
- Nolf D. Otolithpiscium. In: Handbook of Paleoichthyology. In: Schultze HP (ed.), Sttutgart: Gustav Fisher Verlag 1985;10:1-145.
- Lychakov DV and Rebane YT. Otolith regularities. Hea Res 2000;143:83-102.
- Parmentier E, et al. Morpho-anatomy of the oticregion in carapid fishes: eco-morphological study of their otoliths. J Fish Biol 2001;58:1046-1061.
- Annabi A, et al. Inter-population differences in otolith morphology are genetically encoded in the killifish Aphaniusfasciatus (Cyprinodontiformes). Sci Mar 2013;77:269-279.
- Tirumala P and Bharatha Lakshmi B. A Review on Mugil Cephalus Biology and its Occurrence in Visakhapatnam Coast. IJPAJX-CAS-USA, 2015.
- Crosetti D, et al. Geographic variability in the grey mullet Mugil cephalus: preliminary results of mtDNA and chromosome analyses. Elsevier Science Publishers BV, Amsterdam Aquaculture 1993;111:95-101.
- Chih-Chieh H, et al. A Growth Check Deposited at Estuarine Arrival in Otoliths of Juvenile Flathead Mullet (Mugil cephalus L). Zoological Studies 2009;48:315-324.
- Chang CW, et al. Relationship between Sr:Ca Ratios in Otoliths of Grey Mullet Mugil cephalus and Ambient Salinity: Validation, Mechanisms, and Applications. Zoological Studies 2004;43:74-85.
- Gallardo-Cabello M, et al. Study of the otoliths of stripped Mellet cephalus Linnaeus 1758 in Mexican CentralPacific. Journal of Fisheries and Aquatic Science 2012;7:346-363.
- Halouani N, et al. Beach and nearshore morphodynamic changes of the Tabarka coast, Northwest of Tunisia. Environ Earth Sci 2011;66:1059-1069.
- Jemmali D and Leclerc G. Couplage d’un évacuateur vanné avec une tranche de laminage, cas du barrage de Sidi Salem en Tunisie Combining gated spillway and flood damping, Sidi Salem dam in Tunisia. Colloque CFBR-SHF: Dimensionnement et fonctionnement des évacuateurs de crues, janvier, Lyon. 2009; pp: 20-21.
- Kuhl FP and Giardina CR. Elliptic Fourier features of a closed contour. Comp Graph Image Process 1982;18:236-258.
- Crampton JS. Elliptic Fourier shape analysis of fossil bivalve. Practical consideration. Lethaia 1995;28:179-186.
- Trojette M, et al. Applied sagittal otolith shape in the discrimination of fish populations Scorpaenaporcus (Linnaeus, 1758) (Scorpaenidae) in the Tunisian coasts. Cah Bio Mar 2014;55:499-450.
- Neves A, et al. Age and growth of small red scorpionfish, Scorpaena notate (Actionopterygii: Scorpaeniformes: Scorpaenidae), a common discard species from the Portuguese fishery. Act Ichthyol Piscat 2015;45:13-20.
- Brown JR and Severin PK. Otolith chemistry analyses indicate that water Sr: Ca is the primary factor influencing otolith Sr:Ca for freshwater and diadromous fish but not for marine fish. Can J Fish Aquat Sci 2009;66:1790-1808.
- Limburg EK, et al. In search of the dead zone: Use of otoliths for tracking fish exposure to hypoxia. J Mar Syst 2015;141:167-178.
- Cañás L, et al. Use of the otolith shape analysis in stock identification of anglerfish (Lophiuspiscatorius) in the Northeast Atlantic. ICES J Mar Sci 2012;69:250-256.
- Chang CW, et al. Migratory environmental history of the grey mullet Mugil cephalus as revealed by otolith Sr:Ca ratios. Mar Ecol Prog Ser 2004;269:277-288.
- Espino-Barr E, et al. Otoliths analysis of Mugil curema (Pisces: Mugilidae) in Cuyutlan Lagoon, Mexico. Ava Invest Agrop 2013;17:35-64.
- Aurioles GD. Behavioral ecology of California sea lions in the Gulf of California. PhD Thesis in Biology, University of California, Santa Cruz, USA 1988; p: 175.
- Lowry MS, et al. Food habits of California sea lions Zalophus Californian usat San Clemente Island, California, 1981-86. Fish Bull 1990;88:509-521.
- García R. Ecología alimentaria del lobo marino de California, Zalophus Californian uscaliforninus, en Los Islotes, B.C.S, México. Tesis de Licenciatura. Universidad Autónoma de Baja California del Sur, La Paz 1995; p: 106.
- Hernández GM, et al. Reséndiz, Descripción morfológica de los otolitos de las familias Engraulidae, Haemulidae y Achiridae del sistema estuarino de Tecolutla, Veracruz. Rev Zool 2004;15:7-13.
- Martinez J, et al. Utilización de otolitos como herramienta en la determinación de especies. Rev Zool 2007;18:13-18.
- Deng X, et al. Interspecific Variations of Inner Ear Structure in the Deep-Sea Fish Family Melamphaidae. The Anatomical Record 2013;296:1064-1082.
- Hüssy K. Otolith shape in juvenile cod (Gadusmorhua). Ontogenetic and environmental effects. J Exp Mar Biol Ecol 2008;362:131-136.
- Popper AN and Fay RR. Sound detection and processing by fish: critical review and major research questions. Brain Beh Evol 1993;41:14-38.
- Gauldie RW. Function, form and time-keeping properties of fish otoliths. Comp. Bioch. Phys. 1988;91:395-402.
- Reichenbacher B and Reichard M. Otoliths of Five Extant Species of the Annual Killifish Nothobranchius from the East African Savannah. PLoS ONE 2014;9:e112459.
- Gauldie RW. Continuous and discontinuous growth in the otolith of Macruronus novaezelandiae (Merlucciidae: Teleostei). J Morp 1993;216:271-294.
- Capoccioni F, et al. Ontogenetic and environmental effects on otolith shape variability in three Mediterranean European eel (Anguilla anguilla L.) local stocks. J Exp Mar Biol Ecol 2011;397:1-7.
- Midway RS, et al. Southern flounder (Paralichthyslethostigma) stock structure inferred from otolith shape analysis. Fish Bull 2014;112:326-338.
- Ben Mammou A and Louati MH. Evolution temporelle de l’envasement des retenues de barrages de Tunisie. Journal of Water Science 2006;20:201-210.
- Carlström D. A crystallographic study of vertebrate otoliths. Biol Bull Mar Biol Lab Woods Hole. 1963;125:441-463.
- Castonguay M, et al. Usefulness of Fourier analysis of otolith shape for Atlantic mackerel (Scomberscombrus) stock discrimination. Can J Fish Aquat Sci 1991;48:296-302.
- Chia-Hui W, et al. The Migratory Environmental History of Freshwater Resident Flathead Mullet Mugil cephalus L. in the Tanshui River, Northern Taiwan. Zoological Studies 2010;49:504-514.
- Cruz A and Lombarte A. Otolith size and its relationship with colour pattern and sound production. J Fish Biol 2004;65:1512-1525.
- Degens ET, et al. Molecular structure and composition of fish otoliths. Mar Biol 1969;2:105-113.
- Emmanuel OL, et al. Aspects of the biology of grey mullet, Mugil cephalus, in Lagos lagoon, Nigeria. AACL Bioflux 2010;3:3.
- Gallardo-Cabello M. Estudio de la ultraestructura del otolito sagitade la brótolaPhycisblennoides (Brunnich, 1768) en el Mediterráneo occidental (Pisces: Gadidae). An Inst Cienc del Mar y Limnol Unam México 1986;13:197-206.
- Gatti LV, et al. Vertical pro- filer of CO2 above eastern Amazonia suggest a net carbon flux to the atmosphere and balanced biosphere between 2000 and 2009. Tellus B 2010;62:581-594.
- Hickling CF. The structure of the otolith of the hake. Q Jl Microsc Sci 1931;74:547-561.
- Ian J. The fresh and brackish water fishes of lower Guinea, west-central Africa. Bull Br Mus Nat Hist Zool 1991;39:451-471.
- Javier L, et al. Otolith shape analysis as a tool for stock identification of the southern blue whiting, Micromesistius australis. Lat Am J Aqu Ress 2013;3:479-489.
- Khedher M. Caractéristiques otolithométrique des populations tunisiennes de Mugil cephalus. In: Master de recherche, spatialité Biologie Marine, Faculté des sciences de Tunis, Université Tunis El Manar, Tunisiepp 2013; pp: 48-49 (unpublished data).
- Lagler KF, et al. Ichthyology. The University of Michigan, John Wiley and Sons, USA, 1962; p: 491.
- DOI: 10.3923/jfas.2017.207.217
- Merigot B, et al. Characterization of local populations of the common sole Soleasolea (Pisces, Soleidae) in the NW Mediterranean through otolithmorphometrics and shape analysis. Mar Biol 2007;151:997-1008.
- Monteiro LR, et al. Allometric changes and shape differentiation of sagittaotoliths in sciaenid fishes. Fish Res 2005;74:288-299.
- Ouel ML, et al. Etude comparative des lipides de la botargue du mulet a grosse tête (Mugilcephalus, Linnaeus 1758) de l’océan atlantique: Nouakchott (Mauritanie) et de la mer méditerranée: Tunis (Tunisie), Bull Inst Natn Scien Tech Mer de Salammbô 2005;31:69-74.
- Grønkjær P. Otoliths as individual indicators: a reappraisal of the link between fish physiology and otolith characteristics. Marine and Freshwater Research 2016;67:881-888.
- Rafael JA and Francisco GA. Reproductive biology of the mullet Mugil liza (Teleostei: Mugilidae) in a tropical Brazilian bay. Zoologia 2010;27:331-340.
- doi: 10.1590/S1984-46702010000300003
- Randy JB and Kenneth SP. Otolith chemistry analyses indicate that water Sr:Ca is the primary factor influencing otolith Sr:Ca for freshwater and diadromous fish but not for marine fish. Can J Fish Aquat Sci 2009;66:1790-1808.
- Samira S, et al. Biological, histological and ultra-structural studies of female mullet, Mugil cephalus, ovaries collected from different habitats during annual reproductive cycle. African journal of Biotechnology 2015;14:2400-2414.
- DOI: 10.5897/AJB2014.14092
- Sasaki H and Miyata J. Experimentelle Studien über Otolithen. Zeitschr Rhinol Otol 1955;34:740-748.
- Thomson JM. Synopsis of biological data on the grey mullet (Mugilcephalus Linnaeus. 1758). Fish. Synop. Div. Fish. Oceanography, CSIRO, Australia 1963; p: 1.
- Parisi-Barada V, et al. Otolith shape contour analysis using affine transformation invariant wavelet transforms and curvature scale space representation. Marine and Freshwater Research 2005;56:795-804.


