Keywords
|
| Image detection, SIFT, Image recognition, |
INTRODUCTION
|
| The use of symbols in communications has been documented since the time of hieroglyphics. Symbols are used to convey depth of information in an efficient manner, and they can be used to replace what would normally require a lot of explanation. Symbols are a fantastic way to convey a concept. Graphic logos are a special class of visual objects extremely important to assess the identity of something or someone. |
| The expanding and massive production of visual data from companies, institutions and individuals, and the increasing popularity of social systems like Flickr, YouTube and facebook for diffusion and sharing of images and video, have more and more urged research in effective solutions for object detection and recognition to support automatic annotation of images and video and content-based retrieval of visual data. In industry and commerce, logos have the essential role to recall in the customer the expectations associated with a particular product or service. This economical relevance has motivated the active involvement of companies in soliciting smart image analysis solutions to scan logo archives to find evidence of similar already existing logos, discover either improper or non authorized use of their logo, unveil the malicious use of logos that have small variations with respect to the originals so to deceive customers, analyse videos to get statistics about how long time their logo has been displayed. Logos are graphic productions that either recall some real world objects, or emphasize a name, or simply display some abstract signs that have strong perceptual appeal. |
| Colour may have some relevance to assess the logo identity. But the distinctiveness of logos is more often given by a few details carefully studied by graphic designers semiologists and experts of social communication. The graphic layout is equally important to attract the attention of the customer and convey the message appropriately and permanently. Different logos may have similar layout with slightly different spatial disposition of the graphic elements, localized differences in the orientation, size and shape, or in the case of malicious tampering – differ by the presence/absence of one or few traits. Logos however often appear in images/videos of real world indoor or outdoor scenes superimposed on objects of any geometry, shirts of persons or jerseys of players, boards of shops or billboards and posters in sports playfields. In most of the cases they are subjected to perspective transformations and deformations, often corrupted by noise or lighting effects, or partially occluded. Such images and logos thereafter have often relatively low resolution and quality. Regions that include logos might be small and contain few information. Logo detection and recognition in these scenarios has become important for a number of applications such as the automatic identification of products on the web to improve commercial search-engines, the verification of the visibility of advertising logos in sports events the detection of near-duplicate logos and unauthorized uses. Special applications of social utility have also been reported such as the recognition of groceries in stores for assisting the blind. A generic system for logo detection and recognition in images taken in real world environments must comply with contrasting requirements. On the one hand, invariance to a large range of geometric and photometric transformations is required to comply with all the possible conditions of image/video recording. Since in real world images logos are not captured in isolation, logo detection and recognition should also be robust to partial occlusions. At the same time, especially if we want to discover malicious tampering or retrieve logos with some local peculiarities, we must also require that the small differences in the local structures are captured in the local descriptor and are sufficiently distinguishing for recognition. |
II.SIFT
|
| Scale Invariant Feature Transform (SIFT) is an approach for detecting and extracting local feature descriptors that are reasonably invariant to changes in illumination, image noise, rotation, scaling, and small changes in viewpoint. |
A. Detection of scale-space extrema
|
| SIFT key points of objects are first extracted from a set of reference images and stored in a database. An object is recognized in a new image by individually comparing each feature from the new image to this database and finding candidate matching features based on Euclidean distance of their feature vectors. From the full set of matches, subsets of key points that agree on the object and its location, scale, and orientation in the new image are identified to filter out good matches. Finally the probability that a particular set of features indicates the presence of an object is computed, given the accuracy of fit and number of probable false matches. Object matches that pass all these tests can be identified as correct with high confidence. |
| This step detect key points using a cascade filtering approach that uses efficient algorithms to identify candidate locations that are then examined in further detail. The first stage of key point detection is to identify locations and scales that can be repeatably assigned under differing views of the same object. Detecting locations that are invariant to scale change of the image can be accomplished by searching for stable features across all possible scales, using a continuous function of scale known as scale space. The efficient scale-space kernel is the Gaussian function. Therefore, the scale space of an image is defined as a function, L(x, y,σ), that is produced from the convolution of a variable-scale Gaussian, G(x, y, σ), with an input image, I(x, y): |
 |
| where ∗ is the convolution operation in x and y |
 |
| To efficiently detect stable key point locations in scale space, we use scale-space extrema in the difference-of-Gaussian function convolved with the image, D(x, y, σ), which can be computed from the difference of two nearby scales separated by a constant multiplicative factor k: |
 (1) (1) |
| There are a number of reasons for choosing this function. First, it is a particularly efficient function to compute, as the smoothed images, L, need to be computed in any case for scale space feature description, and D can therefore be computed by simple image subtraction. In addition, the difference-of-Gaussian function provides a close approximation to the scale normalized Laplacian of Gaussian, σ2∇2G, the normalization of the Laplacian with the factor σ2 is required for true scale invariance. The maxima and minima of σ2∇2G produce the most stable image features compared to a range of other possible image functions, such as the gradient, Hessian, or Harris corner function. Once this DoG are found, images are searched for local extrema over scale and space. For eg, one pixel in an image is compared with its 8 neighbours as well as 9 pixels in next scale and 9 pixels in previous scales. If it is a local extrema, it is a potential key point. It basically means that key point is best represented in that scale. |
| B. Orientation assignment |
| In this step, each keypoint is assigned one or more orientations based on local image gradient directions. This is the key step in achieving descriptor can be represented relative to this orientation and therefore achieve invariance to image rotation. First, the Gaussian smoothed image L(x, y, σ) at the key point’s scale σ is taken so that all computations are performed in a scale invariant manner. For an image sample L(x, y) at scale σ, the gradient magnitude m(x,y), and orientation θ(x,y) are precomputed using pixel differences: |
 |
| The magnitude and direction calculations for the gradient are done for every pixel in a neighboring region around the keypoint in the Gaussian – blurred image L. An orientation histogram with 36 bins is formed, with each bin covering 10 degrees. Each sample in the neighboring window added to a histogram bin is weighted by its gradient magnitude and by a Gaussian-weighted circular window with σ that is 1.5 times that of the scale of the key point. The peaks in this histogram correspond to dominant orientations. Once the histogram is filled, the orientations corresponding to the highest peak and local peaks that are within 80% of the highest peaks are assigned to the keypoint. In the case of multiple orientations being assigned, an additional keypoint is keypoint for each additional orientation. |
| C. Keypoint descriptor |
| Previous steps found key point locations at particular scales and assigned orientations to them. This ensured invariance to image location, scale and rotation. Now we want to compute a descriptor vector for each key point such that the descriptor is highly distinctive and partially invariant to the remaining variations such as illumination, 3D viewpoint, etc. This step is performed on the image closest in scale to the key `point's scale. |
| First a set of orientation histograms is created on 4x4 pixel neighborhoods with 8 bins each. These histograms are computed from magnitude and orientation values of samples in a 16 x 16 region around the keypoint such that each histogram contains samples from a 4 x 4 subregion of the original neighborhood region. The magnitudes are further weighted by a Gaussian function with equal to one half the width of the descriptor window. The descriptor then becomes a vector of all the values of these histograms. Since there are 4 x 4 = 16 histograms each with 8 bins the vector has 128 elements. This vector is then normalized to unit length in order to enhance invariance to affine changes in dimension of the descriptor, i.e. 128, seems high, descriptors with lower dimension than this don't perform as well across the range of matching tasks and the computational low for finding the nearest-neighbor. Longer descriptors continue to do better but not by much and there is an additional danger of increased sensitivity to distortion and occlusion. It is also shown that feature matching accuracy is above 50% degrees. Therefore SIFT descriptors are invariant to minor affine changes. To test the distinctiveness of the SIFT descriptors, matching accuracy is also measured against varying number of keypoints in the testing database only very slightly for very large database sizes, thus indicating that SIFT features are highly distinctive |
| D. SIFT feature representation |
| Once a keypoint orientation has been selected, the feature descriptor is selected as orientation histograms on 4 by 4 pixel neighborhoods. The orientation histograms are relative to the keypoint orientation, the orientation data comes from the Gaussian image closest in scale to the keypoint's scale. Just like before contribution of each pixel is weighted by the gradient magnitude, and by a Gaussian with σ 1:5 times the scale of the keypoint. Histograms contain 8 bins each, and each descriptor contains an array of 4 histograms around the keypoint. This leads to a SIFT feature vector with 4 *4 *8 =128 elements. |
| Algorithm 1: CDS Logo Detection and Recognition |
 |
| An example of existing method is shown in figure 4 .1. By comparing the feature points of both images and finding the value of τ it is possible to find the matching. Here in this example value of τ is greater than 0.5 and the logo is matched with that in test image. |
IV. PROPOSED METHOD
|
| If one image contains two logos the sift algorithm finds feature points of total image then during comparing this test image with reference image the algorithm gets confused. One solution to this problem is image segmentation that is segmenting the required logos from the test image and use for comparison. And there are different type of segmentations are there. In case of active segmentation it depends on some fixed parameters or measurements. But in case of logos in real world scenes segmentation depends on seed point selected by the user. Since it may contain other dominant objects than logos? |
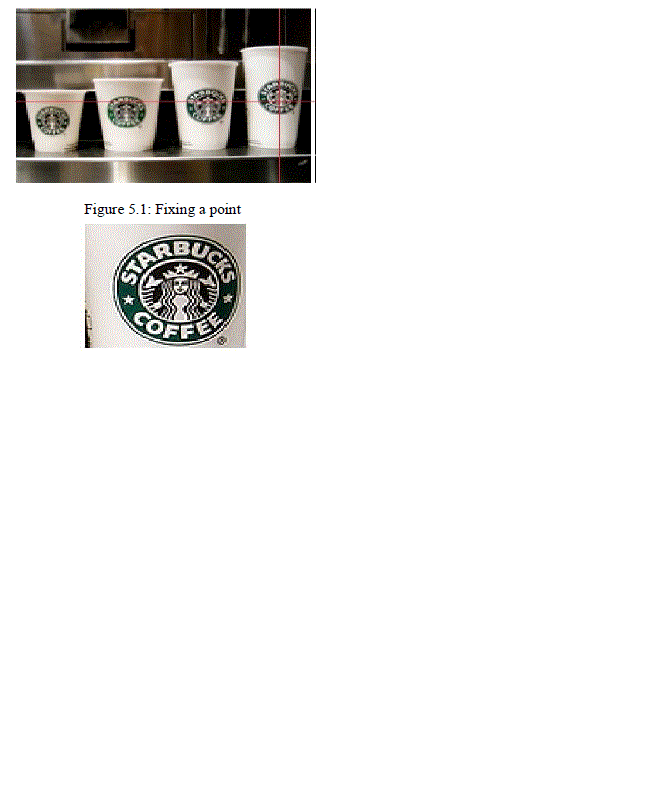
| Here propose a segmentation algorithm which takes a fixation point as its input and outputs the region containing the given fixation point in the scene. For example the fixation point indicated by the red cross lines in figure this method segments the corresponding regions enclosing those fixations points |
| The primary difference between the proposed segmentation framework and the standard approach is the fact that we always segment one region/object at a time. In order to segment multiple objects, the segmentation process will be repeated for the fixation points from inside each of the objects of interest. The diagram below shows that fixation has a critical role in proposed segmentation process and that is to identify the object of interest. |
| For a given fixation point, segmenting the region/object containing that point is a twostep process. |
| 1. Cue Processing: Visual cues such as color, texture, motion and stereo generate a probabilistic boundary edge map wherein the probability of a pixel to be at the boundary of any object in the scene is stored as its intensity. |
| 2. Segmentation: For a given fixation point, the optimal closed contour around that point in the probabilistic edge map. This process is carried out in the polar space to make the segmentation process scale invariant |
| After segmenting the same CDS algorithm is sufficient for further process. |
ACKNOWLEDGMENT
|
| The heading of the Acknowledgment section and the References section must not be numbered. Causal Productions wishes to acknowledge Michael Shell and other contributors for developing and maintaining the IEEE LaTeX style files which have been used in the preparation of this template. To see the list of contributors, please refer to the top of file IEEETran.cls in the IEEE LaTeX distribution. |
Figures at a glance
|
 |
 |
 |
 |
| Figure 1 |
Figure 2 |
Figure 3 |
Figure 4 |
|
| |
References
|
- G.Latorre, R.D.Cruz, and J.M.Arezia, “Classification of publications and models on Transmission Expansion Planning” presented at IEEE PES transmission and Distribution Conf., Brazil, Mar. 2002.
- M.OloomiBuygi, H.M.Shanchei“ Transmission Expansion Planning Approaches In Restructured power systems ” IEEE Bologna Power Tech Conference, June 23-26, Bolonga, Italy.
- R. E. Clayton, and R. Mukerji, “System planning tools for the competitive market,” IEEE Trans. Computer Application in Power, Vol. 9, No. 3, pp. 50-55, Jul. 1996.
- R. Baldick, and E. Kahn, “Transmission planning issues in a competitive economic environment,” IEEE Trans. PWRS, Vol. 8, No. 4, pp. 1497- 1503, Nov. 1993.
- Lee, C.W.; Ng, S.K.K.; Zhong, J.; Wu, F.F, “Transmission Expansion Planning From Past to Future”, Power Systems Conference andExposition, 2006. PSCE '06, IEEE PES, pages: 257 - 265
- de la Torre, S.; Conejo, A.J.; Contreras, J, “Transmission Expansion Planning in Electricity Markets”, IEEE Transactions on Power Systems,Vol: 23, No:1, pages: 238-248, Feb. 2008.
- Wu, F.F.; FengleiZheng, Fushuan Wen, “Transmission planning in restructured electric power systems”, IEEE Power Tech, pages: 1 – 42005.
|