| Keywords |
| Genetic algorithm, GLCM, Lung cancer, SVM classifier. |
INTRODUCTION
|
| Bio Medical images give information of shape and function of organs of human body, being one of the most important mean for establishing the diagnosis. Medical images are a special mean for controlling the therapeutic action. There are many medical imaging techniques which is used to identify the disease or affected part inside our body. Cancer is one of the important cause of death for both men and women. The early detection of cancer can be helpful in curing the disease completely. So the requirement of techniques for detecting the presence of cancer nodule in early stage is increasing nowadays |
| Lung cancer is a disease that occurs because of unwanted growth in tissues of the lung. The growth which spreading beyond the lung in a process known as metastasis and also spread into other parts of the body. Most cancers that begin its growth in lung, known as carcinomas that are derived from epithelial cells.If uncontrolled growth detected successfully at early stages, helps to proceed with many treatment options, which reduces risk of invasive surgery and increased survival rate. Possible treatments include surgery, chemotherapy, and radiotherapy. Survival depends on stage, overall health, and other factors, but overall only 14% of people who are diagnosed with lung cancer can survive five years after their diagnosis. Sometimes few medical images are not clear to view and identify the stage of disease exactly. PET/CT is a medical imaging technique or a device which combines the both a positron emission tomography scanner and computer tomography scanner in single gantry system, so that images gathered from both devices can be taken consecutively, in the same session and then combined into a single superposed image. Computed tomography (CT) and positron emission tomography (PET) able to define the level of the disease, both anatomically & functionally. |
RELATED WORK
|
| In [1] Histogram Equalization is used for preprocessing of the images and feature extraction process and neural network classifier is used to check the state of a patient or extent of the disease in its early stage to known whether it is normal or abnormal. After prediction of the survival rate of a patient will be increased by extracted features. The features are extracted through PCA for classification. PCA is to standardize the data in image. There are some steps to be carried out in PCA that are as follows i. Initially need to Calculate the mean and standard deviation of the features in the image. ii. Subtract the sample mean from each observation, then dividing by the sample standard deviation. This centers and scales the data. iii. Calculating the coefficients of the principal components and their respective variances is done by finding the Eigen functions of the sample covariance matrix.iv. The matrix contains the coefficients for the principal components. The diagonal elements store the variance of the respective principal component so that can the diagonal can be extracted.v. The maximum variance in data results in maximum information content which is required for better classification[2].In [4], an overview of the global cancer burden and the estimated number of new cancer cases , deaths in 2008, the incidence and mortality rates by region for selected cancer sites were discussed. These statistics are based on GLOBOCAN 2008, the standard set of worldwide estimates of cancer incidence and mortality are produced by the International Agency for Research on Cancer (IARC) for the year 2008. The potential benefits and limitations of PET for characterizing lung nodules, staging the mediastinum, identifying occult distant metastasis, determining prognosis and treatment response, guiding plans for radiation therapy, restaging during and after treatment, and selecting targets for tissue sampling were discussed. The three most common indications for PET in lung cancer includes Characterization of pulmonary nodules,Staging the mediastinum and identification of occult distant metastasis,Monitoring for recurrence after completion of treatment in [6]. |
EXISTING SYSTEM
|
| Lung cancer is the major cause of cancer death worldwide, resulting in 1.4 millions deaths annually and it can’t be detected earlier. PET and CT are the two medical imaging techniques which are used to find out affected part in accurate manner. |
| The existing system shows how PET/CT was used to detect the lung cancer and various ways for managing the respiratory motion in medical manner. It also explains the workflow of the imaging technique. Here in the existing system, particular algorithms are not used. Two concepts are integrated into patient-specific workflows i.e. are PET/CT guided radiotherapy and motion managed radiotheraphy. Imaging with PET/CT become a standard care in the lung cancer staging, but it is still underused in its direct integration to therapy planning. The most frequent application of PET and CT to lung cancer patient care is used for diagnosis and also to know the stage of the disease in accurate manner. In particular, the high reactivity and specificity of FDG-PET for the detection of involved nodes, unnecessary growth and distant metastases. Clinical application of FDG PET/CT in lung cancer radiotherapy planning has been deterred by unreliability in detection and quantification, which have led to difficulties in staging , regional lymph nodes, and distant metastases in certain case. PET/CT guided radiotherapy workflows are characterized by many distinct components i.e. are patient classification, PET/CT image acquisition and reconstruction, radiotherapy planning, treatment plan, image guided radiotherapy delivery and procedures. There is an issue that among heterogeneous population can’t know who will benefit from which method either suppression or compensation, that will be overcome in future process. |
| The limitations of FDG-PET imaging initially start from the use of hypermetabolism as a proxy for the presence of lung cancer. |
PROPOSED SYSTEM
|
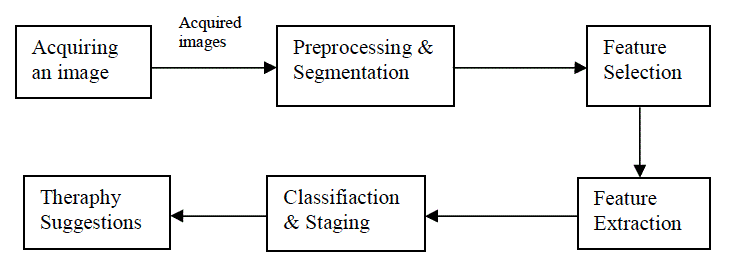
| In the previous sections, we have seen about the medical imaging technique i.e. PET and CT scan imaging process. The existing system explains about the causes of lung cancer and also shows how the respiratory motion was managed. The most prevalent application of PET/CT i.e. is FDG-PET/CT mainly used for best diagnosis, but it may cause some difficulties for staging the disease and distant metasis. Here comparison is made between PET and CT to know which gives the best and accurate result through applying some image processing techniques. In the proposed system, the system design is made for detecting the lung cancer in early stage. There are some steps to be followed in this system i.e. are Preprocessing, Feature selection, Feature extraction, Classification & Staging. |
| A. Preprocessing: |
| The affected part need to be extracted without any noises and blurness from the images, so here need to apply some pre-processing techniques like Filtering, Histogram equalization, Image enhancement ,noise removal etc. Most of the preprocessing for image is done with the help of matlab software.The preprocessing of image aims at selectively removing the redundancy present in scanned images without affecting the details which that play a role in the diagnostic process. Each image is preprocessed to improve its quality.The Preprocessing techniques which applied here are as follows |
| 1. Histogram equalization method was used to enhance the contrast of the image. |
| 2. Median filtering is required to remove the effect of poor contrast due to Glare, noise and effects caused by poor lighting conditions during image capture. A low frequency image was generated by replacing the pixel value with a median pixel value. The below diagram explains the whole system |
| Segmentation: There are two types of pixels with different density distribution: |
| 1) Pixels within the very dense body and chest wall structures (the body pixels) and 2) low-density pixels. Optimal thresholding is applied on the pre-processed lung image to select a segmentation threshold to separate the body and nonbody pixels through an iterative procedure. The pixels with a density lower than the threshold value are recognized assigned a value 1 and appear white, whereas other pixels are assigned the value of 0 and appear black. |
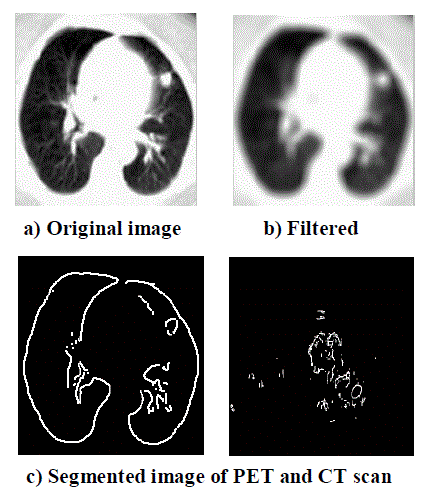
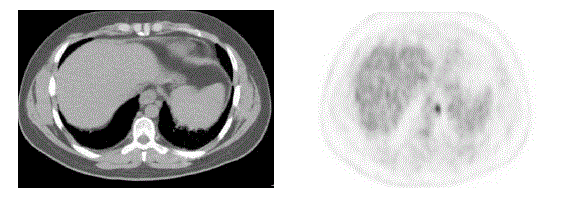
| Figure 2 shows the architecture of the proposed system. Images of CT and PET scan are acquired initially. Basically the medical images or scanned images may not have high resolution due to the number of slices per pixel and also contain noise. So the image is preprocessed by applying specific preprocessing techniques such as histogram equalization and Median filter to remove noise and enhance the image. Next, the preprocessed image is segmented for choosing the right portion of the infected region (black and white color region in Figure 1). Then, selection of region through which cancer affected part are selected using Genetic algorithm. Then the selected features are extracted using GLCM algorithm and stored in the database for classification. The classification is based on growth of the cell and it is done using SVM classifier. Based on the classification, stage of the cancer is identified which helps physician to give suitable therapy. |
| B. Feature Selection: |
| Feature Selection also called as variable selection. It is the process which is used for selecting a small set of relevant features for future use. After preprocessing have to select the features or region from the preprocessed image using genetic algorithm which is best in selecting the feature for biomedical images. Genetic algorithms (GAs) are new paradigm for a search, based on principles of selection .GAs was proven to be the most strong optimization technique among a large solution space. Genetic algorithms (GAs) are best known for their ability to efficiently search large spaces about which little is known as priori. Here the relevant features need to be selected for future process. There are 5 steps in genetic algorithm. |
| 1. Start with a randomly generated population of N chromosomes, where N is the size of population, l – length of chromosome x. |
| 2. Calculate the fitness value of function of each chromosome x in the population. |
| 3. Repeat until N off springs are created: |
| a) Probabilistically select a pair of chromosomes from current population using value of fitness function |
| b) Produce an offspring yi using crossover and mutation operators, where i=1,2,….N |
| 4. Replace current population with newly created one. |
| 5. Go to step |
| C. Feature Extraction: |
| Feature extraction is the process which involves for clarifying the amount of resources required from a large set of data accurately. Once features are selected then it need to be extracted. Image features Extraction stage is an important stage that uses algorithms and techniques to detect various desired portions or shapes. The selected features (affected part) must be extracted. The GLCM is a tabulation which shows how often various combinations of pixel values (grey levels) occur in an image. Firstly create gray-level co-occurrence matrix from image using graycomatrix function in MATLAB. A GLCM denote the second order conditional joint probability densities of each of the pixels, which is the probability of occurrence of grey level i and grey level j within a given distance ‘d’ and along the direction ‘θ’.9 features are considered for proposed method. |
| 1. Area: It shows the actual number of pixels in the ROI. |
| 2. Convex Area: It shows the number of pixels in convex image of the ROI. |
| 3. Equivalent Diameter: It is defined as the diameter of a circle with the same area as the ROI. |
| 4. Solidity: It is defined as the proportion of the pixels in the ROI. |
| 5. Energy: It describes that the summation of squared elements in the GLCM and its value ranges between 0 and 1. |
| 6. Contrast: It is defined as the measure of contrast between an intensity of pixel and its neighboring pixels over the whole ROI. |
| 7. Homogeneity: The homogeneity is the measure of closeness of the distribution of elements in the GLCM to the GLCM of each ROI and its Value ranges between 0 and 1. |
| 8. Correlation: It is the measure of correlation of pixel to its neighbor over the ROI. |
| 9. Eccentricity: The eccentricity is defined as the ratio of the distance between the focus of the ellipse and its major axis length. |
| D. Classification: |
| Support vector machines are said to be as supervised learning models with associated learning algorithms that is used for analyzing data and also for recognizing patterns.SVM is also mainly used for classification process. The basic SVM takes some set of input data and for each given input, s p e c i f i e s which of two classes forms the input, making it a non- probabilistic binary linear classifier. From selected set of training sets, each marked as belonging to one of two categories, an SVM training set builds a model for assigning new examples into one category or the other. In the proposed method we are using linear classifier because it will give the accurate result. The extracted features need to be classified based on their tumorous cell growth, based on it stages will be identified which will be useful to physician to plan the treatment. |
EXPERIMENTAL RESULTS
|
 |
| Initially the images were read and noise is removed using median filter shown in fig b).The above diagram fig.c) shows segmentation of both scanned images which are shown in white and black pixel. Then the preprocessed images will be taken as input for further module. |
CONCLUSION
|
| The proposed model identifies and detects the stage of disease based on the features extracted. Initially process is to read the image and need to preprocess because of high resolution and noise occur in the image, the noises are removed using median filter and the image is enhanced and segmented. In the future the preprocessed image will be the input for feature selection and extraction which are used to extract the particular region. The extracted features must be stored for classification. Based on the classification, stages will be identified which is used for a physician to give some therapy suggestions. |
Figures at a glance
|
 |
 |
| Figure 1 |
Figure 2 |
|
| |
References
|
- Ada, Rajneet Kaur ,”Early Detection and Prediction of Lung Cancer Survival using Neural Network Classifier”, International Journal of Application or Innovation in Engineering and Management (IJAIEM), Volume 2, Issue 6, June 2013
- Ada, Rajneet Kaur,”Feature Extraction and Principal Component Analysis for Lung Cancer Detection in CT scan Images”,International Journal of Advanced Research in Computer Science and Software Engineering (IJARCSSE),Volume 3, Issue 3, March 2013
- Ali Nawaz Khanb, Hamdan AL-Jahdalia, Shukri Loutfic,Abdullah S. Al-Harbia “Guidelines for the role of FDG-PET/CT in lung cancer management”, ELSEVIER Journal of Infection and Public Health Issue 5, pg.S35—S40,2012
- Ahmedin Jemal, Freddie Bray, Melissa M. Center, Jacques Ferlay, Elizabeth Ward, David Forman,” Global cancer Statistics”, American Cancer Society
- Abhinav Vishwa, Alka Vishwa, Archana ArchanaSharma, “Pre-diagnosis of lung cancer using feed forward neural network and back Propagation algorithm” International Journal On Computer Science and Engineering (IJCSE), Vol. 3 No. 9 September 2011
- Afshin Rashtian, Ching-Fei Chang, and Michael K. Gould “The Use and Misuse of Positron Emission Tomography in Lung Cancer Evaluation”, Clin Chest Med. 2011 December; 32(4): 749–762. doi:10.1016/j.ccm.2011.08.012
- Carla E. Brodley, Jennifer G, Kak, Lynn S. Broderick, and Alex M. Aisen “Unsupervised Feature Selection Applied to Content-Based Retrieval of Lung Images” IEEE TRANSACTIONS on pattern analysis and machine intelligence, vol. 25, no. 3, march 2003
- Fernando, Udeshani, Meegama, “Statistical Feature-based Neural Network Approach for the Detection of Lung Cancer in Chest X-Ray Images”, International Journal of Image Processing (IJIP), Volume (5) Issue (4): 2011
- Rajneet Kaur, “Using Some Data Mining Techniques to Predict the Survival Year of Lung Cancer Patient”, International Journal Of Computer Science and Mobile Computing(IJCSMC), Vol. 2, and Issue.4, pg.1 – 6,April 2013
|