Keywords
|
| Maximum power point tracking(MPPT), DC Link Capacitor droop control(DC Link CDC), Photovoltaic(PV)array, Purtube and observe (P&O), |
INTRODUCTION
|
| As the current going conventional energy sources are rapidly depleted, due to growing demand on energy. And the limited availability and rising prices of conventional sources forced solar Photovoltaic (PV) to emerge as an alternative energy resource. Photovoltaic (PV) power generation has an important role to play due to the fact that it is a green source. The field of photovoltaic array (PV) has experienced a remarkable growth for past two decades in its widespread use from standalone to utility interactive PV systems. A study in Germany, of PV systems revealed that inverters contribute for 63% of failures, PV modules 15%, and other components 23%, on an average, every 4.5years [2].When PV module Maximum Power Point Tracking (MPPT) comes into case of a real time is a well-known problem. Using a solar panel or an array of panels without a controller that can perform Maximum Power Point Tracking (MPPT) will often result in wasted power. An efficient MPPT algorithm is important criteria to increase the efficiency of PV system to maintain the PV array’s operating point at its MPP at all environmental conditions [1]. |
| There is two kinds of systems are available one standalone PV system other is grid connected PV system. Both works for the achievement of a common goal but entirely different MPPT and control techniques are need for each to work. The objective of this paper is firstly to review two MPPT algorithms for two different platforms which are completely different in its working strategy. The most popular, perturb and observe (P&O) and DC Link Capacitor Droop Control Technique [3]. These are analyzed in depth and tested in simulation software to all extent according to the standard conditions. These are analyzed in depth and tested in simulation software MATLAB/Simulink to all extent according to the standard conditions. Also relevant points are taken out and obtained why these two methods are entirely differ in logic, complexity, cost, response and they are proposed for two circumstance despite of being developed for common purpose. An entire simulation model is created for the testing of these methods. In order to come out with much more clear picture which one preferred when and why. |
| Simple circuit-based PV models (Figure 1) used for mathematical functional models for the performance analysis of newly developed systems. These developed systems could not be readily adopted by the field. Hence the need for simplified Simulink modeling of PV module has been long felt [5]. Extracting from the same Simulink model a hardware is setup for P&O system, MPPT algorithm is created in the front end of software called LABVIEW and in the real time working is observed. A PV module with its control panel from ECOSENSE (manufacturer) is linked with the software to run all required tests. All interconnections and data transfers were done through NI cRIO 9025. Acquired data were taken into LabVIEW from cRIO and MPPT was run. Ecosense deliver the required information to the control system. |
PHOTOVOLTAIC MODULE AND ARRAY MODEL
|
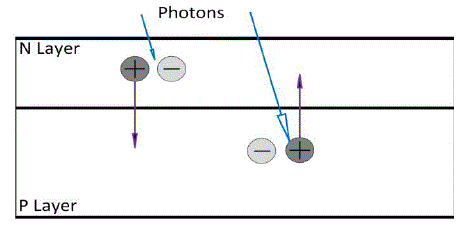
| Solar cell is basically a p-n junction fabricated in a thin wafer or layer of semiconductor. Solar cells are the basic components of photovoltaic panels. Most are made from silicon even though other materials are also used. Solar cells take advantage of the photoelectric effect: the ability of some semiconductors to convert electromagnetic radiation directly into electrical current. The charged particles generated by the incident radiation are separated conveniently to create an electrical current by an appropriate design of the structure of the solar cell[4] (Figure 1). |
| The solar cell works in several steps: |
| (1) Photons in sunlight hit the solar panel and are absorbed by semiconducting materials, such as silicon. |
| (2) Electrons are excited from their current molecular/atomic orbital. Once excited an electron can either dissipate the energy as heat and return to its orbital or travel through the cell until it reaches an electrode. Current flows through the material to cancel the potential and this electricity is captured. (3) An array of solar cells converts solar energy into a usable amount of direct current (DC) electricity. |
| (4) An inverter can convert the power to alternating current (AC)[9]. |
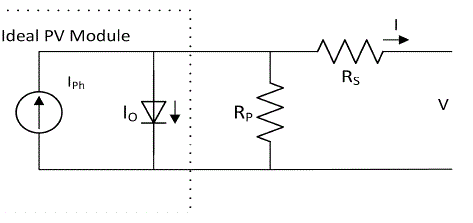
| PV system naturally exhibits a nonlinear I-V and P-V characteristics which vary with the radiant intensity and cell temperature. Figure. 2 shows the equivalent circuit models of cell. |
| A. Reference Model |
| A 36W Ecosense (manufacturer) PV module is taken as the reference module for simulation and the datasheet details are given in Table 1 |
| Note: The electrical specifications are under standard test conditions (STCs) which means an irradiation of 1000 W/m2 with an AM1.5 spectrum at 25âÃâæC. |
| B. Mathematical Equations of PV Module. |
| PV cells are grouped in larger units called PV modules, which are further interconnected in a series-parallel configuration to form PV arrays. The following are the basic equations [5] from the theory of semiconductors and photovoltaics [10] that mathematicallydescribe the I-V characteristic of the photovoltaic cell and module. |
| (i) PhotocurrentIPH: The module photocurrent IPH of the photovoltaic module depends linearly on the solar irradiation and is also influenced by the temperature according to the following equation (1): |
 (1) (1) |
| Where IPH [A] is the light-generated current at the nominal condition (25âÃâæC and 1000 W/m2), Ki is the short-circuit current/temperature coefficient (0.0017A/K), TK and TRef are, respectively, the actual and reference temperatures in K, λ is the irradiation on the device surface (W/m2), and the nominal irradiation is 1000 W/m2. |
| (ii) Module Reverse Saturation CurrentIRS: Module reverse saturation current, IRS, is given by equation (2) as follows. |
 (2) (2) |
| Where q is the electron charge (1.6 ×10⁻¹⁹C), VOC is the Solar module open-circuit voltage (21.24 V), Ns is the number of cells connected in series (36), K is the Boltzmann constant (1.3805×10⁻²³J/K), and A is the ideality factor (1.6). (iii)Module Saturation CurrentI0: The module saturation currentI0varies with the cell temperature and is given by Equation (3). |
 (3) (3) |
| WhereEg0 is the bandgap energy of the semiconductor (Eg0≈1.1 eV for the polycrystalline Si at 25âÃâæC). |
| (iv)Module Output Current IPV. The basic equation for current output of PV module can be modified as equation (4). |
 (4) (4) |
| Where NP is number of parallel connections of cells in the given photovoltaic module (NP=),VPV = VOC=21.24V, RS is the Equivalent series resistance of the module (0.1Ω). In addition, the maximum power can be expressed as |
 (5) (5) |
| âÃâ¹ÃŽ is the cell fill factor which is a measure of cell quality. |
| C. Simulation of solar pv module in MATLAB/Simulink |
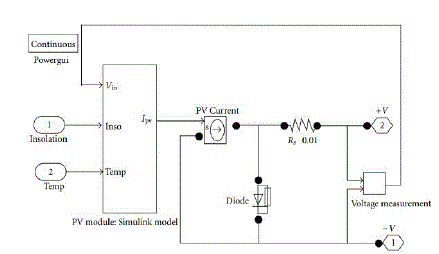
| In this section the characteristic equations (1), (2), (3) & (4) for the PV module is implemented in MatLab/Simulink as shown in Figure 3. These equation are simulated in Simulink and output is plotted for different Insolation, Temperature. The voltage V is considered varying from 0 to VOC corresponding to the variation in current from short circuit current ISC to 0 in all the simulation period. |
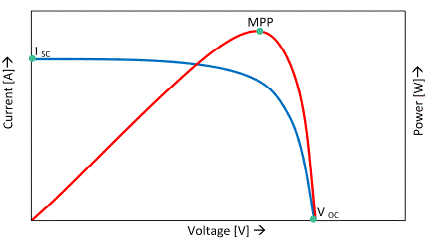
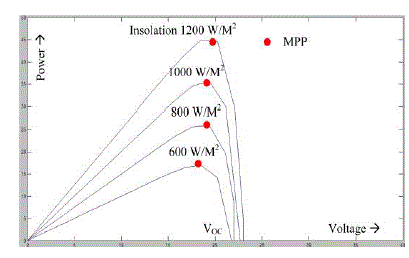
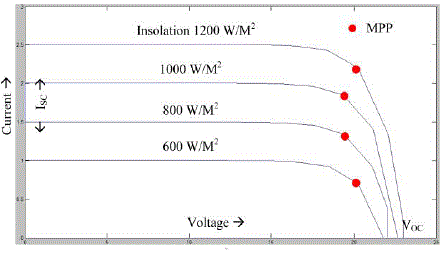
| When the characteristic results are compared with theoretical results, it is clear the Simulink model work much closer to the real time PV array module figure 4. Since module gives the required response it is clear to continue with the module to do the remaining experiments, when latter MPPT and Synchronizer added to the system.Simulation result of characteristics for the above PV module system for different insolation is given in figure 5 & 6. In P-V graph all the voltage starts from 0 and ends in the VOC region Power is increases with increase in insolation so as VOC becomes wider giving more operating region. I-V graph shows that current starts from ISC and ends in 0A and VOC point.as insolation changes ISCvalue also changes. |
MAXIMUM POWER POINT TRACKING
|
| As MPPT algorithms are necessary in PV applications because the MPP of a solar panel varies with the irradiation and temperature, so the use of MPPT algorithms is required in order to obtain the maximum power from a solar array. Over the past decades many methods to find the MPP have been developed and published. These techniques differ in many aspects such as required sensors, complexity, cost, range of effectiveness, convergence speed, correct tracking when irradiation and/or temperature change, hardware needed for the implementation or popularity, among others.Two comparatives are included in this paper apart from the above said differences these two methods are unique in their work environment. Well known perturb and observe (P&O) which is best in for standalone systems, And DC-Link Capacitor Droop Control one designed to work along with grid connected system. Simulation was done with PV model for two methods according to theirrequirement [3]. |
| A. Boost converter |
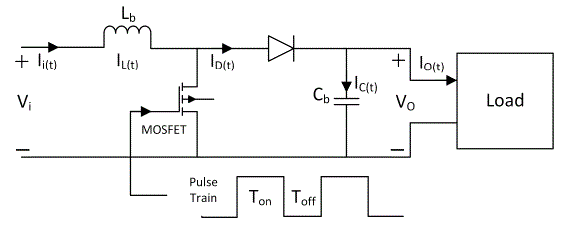
| The topology presented in this application note is a boost converter. The boost converter is a special case, since it not a linear dynamic behavior transfer function when operating in Continuous Conduction Mode (CCM). Though this complicated things compared to buck, and the MPPT controller can’t be implemented by operating directly on the converter duty cycle will yield unpredictable results. The other topologies have a nonlinear voltage transfer function and operating directly on the duty cycle will yield unpredictable results, especially at high duty cycles. In this case, the algorithm modifies the solar panel operating voltage by using a control algorithm (P&O, DC Link CDC), control loop, which steers the voltage to the desired value [4]. |
| The designed boost converter for the simulation is shown in the figure 7. Designed values and the mathematical equations used for the designing the components values are given as equations (6), (7), (8), Table 2.The critical inductance, Lbc, is defined as the inductance at the boundary edge between continuous and discontinuous modes we take boundary value for calculation and take a value higher than obtained it is defined as: |
 (6) (6) |
| Where; R: The equivalent load, Ω, FS: The switching frequency, Hz, D: Duty ratio. The switching frequency has been chosen arbitrarily to minimize the size of the boost inductor and limit the loss of the semiconductor device and to track the MPPT[8]. The output filter capacitors are chosen to meet an output voltage ripple specifications, as well as its ability to handle the required ripple current stress. An approximate expression for the required capacitance as a function of ripple voltage requirement, Vr, D, switching frequency FS and output voltage[8]. |
 (7) (7) |
| Vo is given as, |
 (8) (8) |
| After solving the equatuions component values are as given in Table 2. |
| B. Perturb and observes |
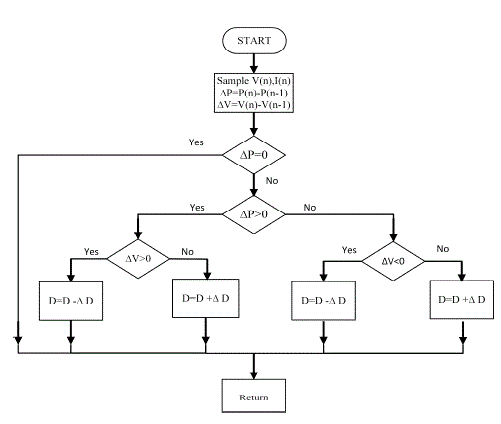
| It is the technique used for standalone PV system. In this technique, first the PV voltage and current are measured and hence the corresponding power P1is calculated. Considering a small perturbation of voltage ΔV or perturbation of duty cycle (ΔD) of the dc/dc converter in one direction corresponding power P2 is calculated. P2is then compared with P1 .If P2is more than P1, then the perturbation is in the correct direction; otherwise it should be reversed. In this way, the peak power point (PMPP) is recognized and hence the corresponding voltage (VMPP) can be calculated (figure 8.)[6]. |
| The major drawbacks of P&O/hill-climbing are occasional deviation from the maximum operating point in case of rapidly changing atmospheric conditions, such as broken clouds. Also, correct perturbation size is important in providing good performance in both dynamic and steady-state response [9]. To solve this problem, a modified adaptive hill climbing technique with a variable perturbation step size can be used, where an automatic tuning controller varies the perturbation step size to a large value when the power changes in a large range primarily due to environmental variation, to satisfy the fast response requirement during the transient stage. |
| Further, the controller is formulated in such a manner that when the power change is less than or equal to the set lowest limit, the controller assumes that the system enters the steady state and the value of perturbation becomes small. In similar context, one Adaptive P&O technique and another Predictive and Adaptive MPPT P&O technique [8] have been introduced. In the Adaptive P&O method, instead of VMPP, the main emphasis has been given on the voltage perturbation ΔV. In Predictive and Adaptive MPPT P&O method, a constant duty cycle perturbation (ΔD) that linearly reduces with increase of power drawn from PV panel has been taken.In this method, the sign of the last perturbation and the sign of the last increment in the power are used to decide what the next perturbation should be. As can be seen in Figures 8, 11 following. Then the operating point oscillates around the MPP. If there is an increment in the power, the perturbation should be kept in the same direction and if the power decreases, then the next perturbation should be in the opposite direction. |
| C. P&O Simulation and Results |
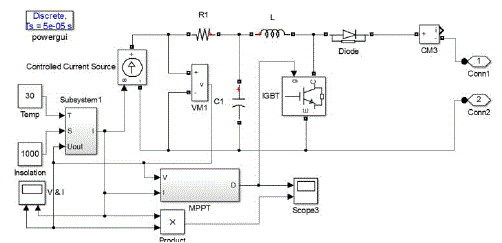
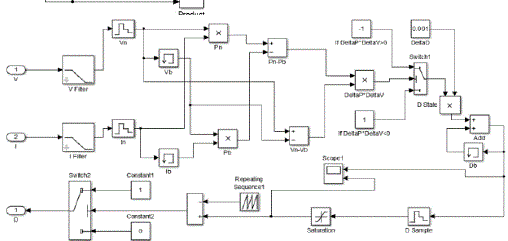
| Simulation model for modified P&O technique is given in figure 9. Since it is standalone only DC/DC converter and MPPT module comes into play output terminals are taken out to connect load. MPPT simulation block corresponding to the algorithm is as per in figure 10. |
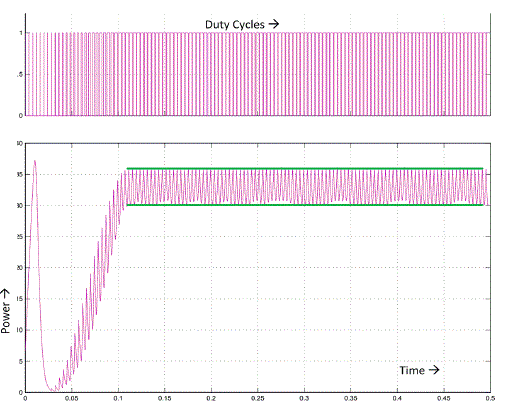
| The Power perturbations are as per the given result bellow (Figure p.). With change in each duty cycle the changes to the power occurred with a standalone system having constant load will have change in power when the voltage is varied through DC/DC converter and MPPT technique. |
| The Hysteresis band with in the green lines indicates the perturbation. In the steady state the value oscillates with in a limit making the system stable. |
| D. DC-Link Capacitor Droop Control |
| DC Link CDC system is one works along with grid connected system. Same DC/DC converter is used assuming a constant common load. DC-link capacitor droop control technique [10], is designed to work with a PV system that is connected in parallel with an ac system line. The duty ratio (D) of an ideal boost converter is represented as |
 |
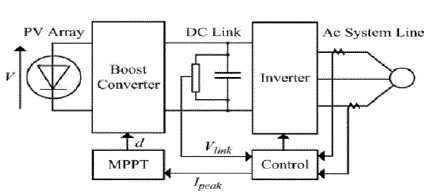
| WhereVPVis the voltage across the PV array and Vlink is the voltage across the dc link. If Vlink is kept constant, the power coming out of the converter can be increased by increasing the current going in the inverter. While the current is increasing, the voltage Vlink can be kept constant as long as the power required by the inverter does not exceed the maximum power available from the PV array. If that is not the case, Vlink starts drooping. Right before the drooping point, the current control command of the inverter is at its maximum and the PV array operates at the MPP. The ac system line current is fed back to dc-link to prevent Vlink from drooping and D is optimized to achieve MPPT as shown in Fig. 12. This technique is restricted to only to PV system that is connected in parallel with an ac system line. |
| Main drawbacks of this system is since it is independent of PV array it won’t track the change in the atmospheric condition or PV power but takes an alternate route which eventually takes the system to MPP. Thus it’s not a true MPPT. When connected to grid it is highly complex and system convergence speed is slow when compared to standalone system. This Technique is highly favorable under grid connection, it can easily check for the load change and make sure system runs in synchronized state. |
| E. Simulation and Results |
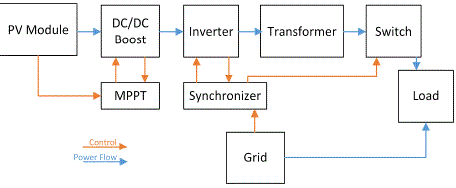
| Figure 13 shows the block diagram of grid connected system in general. Apart from standalone system grid connected system has a inverter, potential transformer, synchronizer, Inverter grid inter-connected automatic switch which is controlled from synchronizer, and other protection elements isolators, isolators, logic devises, memory devises to store data. |
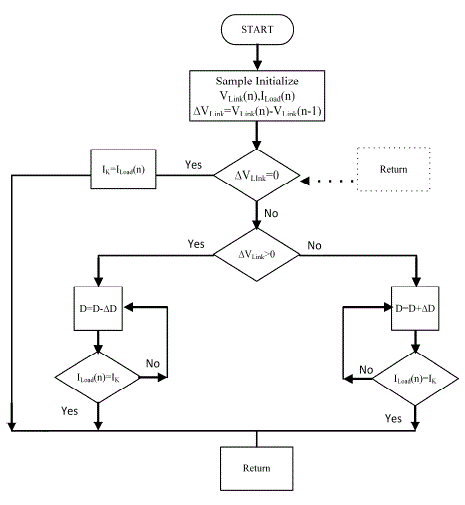
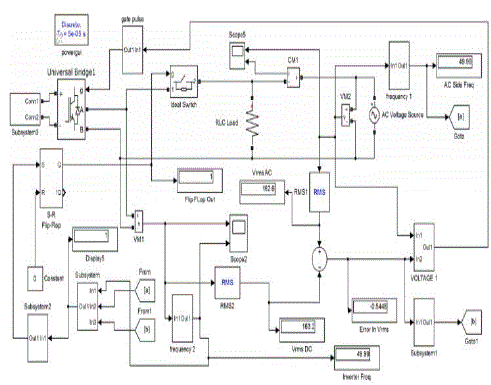
| Here we see a number of components, controlstabilization & protection equipments which makes the system complex. Figure 14 gives the DC Link CDC technique flowchart.And we can see it’s just the sensing parameters and MPPT are in difference from the other method. Here the output terminals are taken out to connect to an inverter which is connected to the grid via a switch.In figure 16 entire Simulink block for grid connection is shown. |
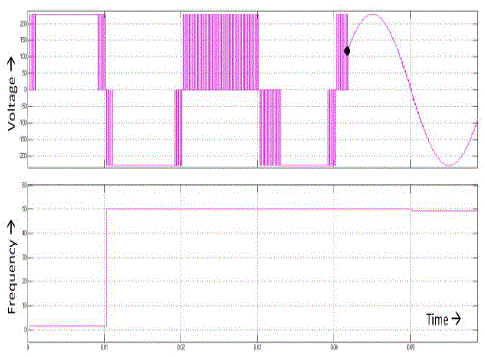
| Note: Even it’s designed for grid connection it can also work with standalone system, but the response will be slower Above Simulink block diagram gives the idea how DC Link CDC technique is created in Simulink, Figure 17. Black dot in the simulation is the point at which the synchronization takes place. Even after frequency reaches 50 Hz it waits for the VRMS Values to be equal so that the synchronization takes place. |
COMPARISON BETWEEN TWO MPPT TECHNIQUE
|
| Comparison between two MPPT techniques is useful in selecting one for better performance. But we have to consider so many things while selecting one. These are unique and purpose oriented techniques. Though the comparison is between two methods since it belong to two different category standalone and grid connected, it also gives the idea about two categories in general [11].The comparison results were based on analysis in the simulation results of conducted experiments and the theoretical results. The observation found were charted, and it is given in table 3 and 4. From the table one will be able to suggest a method for the suitable work. |
P&O REAL TIME CONTROL AND MONITORING
|
| In-order to understand the real time working of a PV array and MPPT a hardware was setup. P&O MPPT algorithm was the one used for the analysis of system performance. |
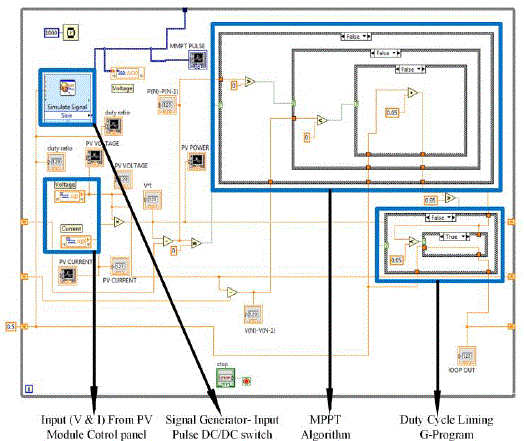
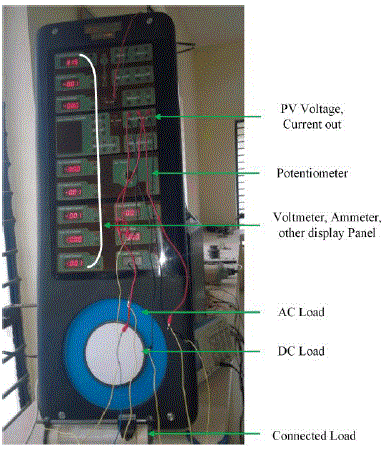
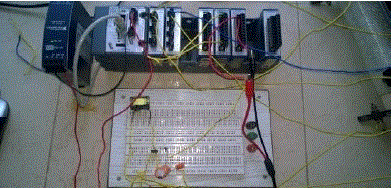
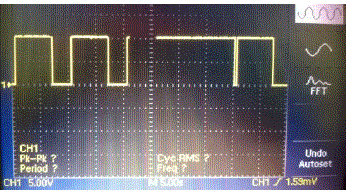
| Ecosence solar module was used to observe the real time values to the PV module via its control panel Figure 19. PV array specifications are as per table 1. All the data taken through control panel output port is given to the control module National Instruments cRIO 9025.It has a voltage, current sensing modules with Digital and analog input output modules. The connections are made as per in the Simulink model figure 9, Only MPPT block is replaced by LabVIEW program. LabVIEW software MPPT program is as given bellow figure 10. If conditional case structure and mathematical comparison were used in the LabVIEW interface to implement P&O technique as per flowchart figure 8.Since all the values were given into LabVIEW through cRIO 9025 it is made available to program by shared variable block. A sub conditional block is used for the limiting the duty ratio to controllable value. External values are taken in and processed to give out duty pulse to DC/DC through cRIO 9025. Pulse are generated by signal generator and its duty ration is controlled by program. Complete hardware setup is as given below. |
| Change in duty ration as change in load is observed and program works to create new duty ratio while change in insolation/or change in load value. In the above figure change in duty ratio is caused by varying rheostat/ load value. |
CONCLUSION
|
| From the classification of available power distribution standalone and grid, a number of MPPT techniques are available. Selecting a particular MPPT for a system has to deal with its cost, reliability, speed, safety of the system. The power ratings of PV panel and climate conditions are also factors in certain areas and in some applications. From the above study we can see a hybrid of both technique is most preferred. MPPT techniques meant for mismatched conditions such as partial shedding, non-uniformity of PV panel temperatures, dust effects, damages of panel glass. Cases studied and discussed in the paper gives us a brief idea of PV panel working along with standalone and grid along with MPPT. It also gives an advantage of pre evaluating overall system before going into real time. The whole PV panel – MPPT – Grid tied system is created in MATLAB/Simulink. PV panel Simulink block has under gone I-V, P-V characteristic check and results similar to real time condition is obtained. Further case studies where done over the PV panel connecting MPPT, Inverter, Synchronizer, and other supporting switches, And experiments are run. From the results comparisons are made.From hardware implementation real time response and behavior of a real time system working with P&O was observed and results were found matching. And by using LabVIEW, a new simple and effective controlling scheme is obtained. |
Tables at a glance
|
|
|
Figures at a glance
|
 |
 |
 |
 |
 |
| Figure 1 |
Figure 2 |
Figure 3 |
Figure 4 |
Figure 5 |
|
 |
 |
 |
 |
 |
| Figure 6 |
Figure 7 |
Figure 8 |
Figure 9 |
Figure 10 |
|
 |
 |
 |
 |
 |
| Figure 11 |
Figure 12 |
Figure 13 |
Figure 14 |
Figure 15 |
|
 |
 |
 |
 |
 |
| Figure 16 |
Figure 17 |
Figure 18 |
Figure 19 |
Figure 20 |
|
References
|
- MihneaRosu-Hamzescu, SergiuOprea “Practical Guide to Implementing Solar Panel MPPT Algorithms” AN1521 Microchip 2013 TechnologyInc.
- Ali Nasr Allah Ali, Mohamed H. Saied, M. Z. Mostafa, T. M. Abdel- Moneim “A Survey of Maximum PPT techniques of PV Systems”
- BidyadharSubudhi, Senior Member, IEEE, and RaseswariPradhan, “A Comparative Study on Maximum Power PointTracking Techniques forPhotovoltaic Power Systems,” IEEE Transactions on Sustainable Energy, Vol. 4, No. 1, January 2013.
- NatarajanPandiarajan, RamabadranRamaprabha, and RanganathMuthu, “Application of Circuit Model for Photovoltaic Energy ConversionSystem,”Hindawi Publishing Corporation International Journal of Photoenergy Volume 2012, Article ID 410401.
- KinalKachhiya, MakarandLokhande, Mukesh Patel, “MATLAB/Simulink Model of Solar PV Module and MPPT Algorithm” NationalConference on Recent Trends in Engineering & Technology.
- G. de Cesare, D. Caputo, and A. Nascetti, “Maximum power point tracker for photovoltaic systems with resistive like load,” Solar Energy, vol.80, no. 8, pp. 982–988, 2006.
- Jaber Abu-Qahouq and IssaBatarseh, "Generalized Analysis of Soft-Switching DC-DC Converters", ISCAS 2000 - IEEE InternationalSymposium on
- N. Femia, D. Granozia, G. Petrone, G. Spagnuolo, and M. Vitelli, “Predictive and adaptive MPPT perturb and observe method,”IEEETrans.Aerosp. Electron. Syst., vol. 43, no. 3, pp. 934–950, Jul. 2007.F. Shi, “A DSP-based single-stage maximum power point tracking pv inverter,” inProc. 25th IEEE Annu. Conf. Appl. Pow. Electr., China, Jun. 12–15, 2010, pp. 948–952.
- F. Liu, Y. Kang, Y. Zhang, and S. Duan, “Comparison of p&o and hill climbing MPPT methods for grid-connected PV generator,” inProc.3rdIEEE Conf. Industrial Electron. Applicat., Singapore, Jun. 3–5, 2008.
- V.Salas, E.Olias, A.Barrado, and A.Lazaro, “Review of the maximum power point tracking algorithm for stand-alone photovoltaic system,”Solar Energy Mater. Solar Cells, vol. 90, no. 11, pp. 1555–1578, 2006.
- F. Liu, Y. Kang, Y. Zhang, and S. Duan, “Comparison of p&o and hill climbing MPPT methods for grid-connected PV generator,” inProc.3rdIEEE Conf. Industrial Electron. Applicat., Singapore, Jun. 3–5,2008.
|