Keywords
|
| Microgrids, Over Current Relay, Directional relays, Short-circuit analysis, Digital Relays. |
INTRODUCTION
|
| Microgrid is a group of interconnected loads and distributed energy resources within clearly defined electrical boundaries that acts as a single controllable entity with respect to the grid and that connects and disconnects from such grid to enable it to operate in both grid connected or Island Mode. |
| This paper discusses the configuration of digital over-current relay (OCR) model and directional OCR on MATLAB. Modeling in MATLAB offers design flexibility and room for exploration which helps in developing better realizing of the physical development happening behind any module.Any protection scheme is a collection of various types of relays such as Over-current, distance relays, under or over-voltage, differential relays etc. All of these were traditionally constructed electromechanically and later in solid-state. Currently, digital relays have replaced both types; being faster, smaller and reliable in operation ensuring minimum power outage in case of fault. |
| Over-current relays are employed to protect distribution and sub-transmission system from the effects of excessive currents occurring either due to short circuits or overload conditions. It is also used for the protection of generators, power transformers and electric motors. To limit the extent of damage caused by such faults to a minimum level; fast, reliable and selective operation of relay are basic demands of any power system. To meet these expectations, advantages of digital logic, communication, information storage and processing capabilities of modern microprocessors are employed in digital design. OCR has its limitation in sensing the direction of fault, which is mitigated by adding a directional element along with it. Directional OCRs are most commonly employed for protecting ring or loop networks. |
THEORETICAL ANALYSIS
|
Over Current Relay:
|
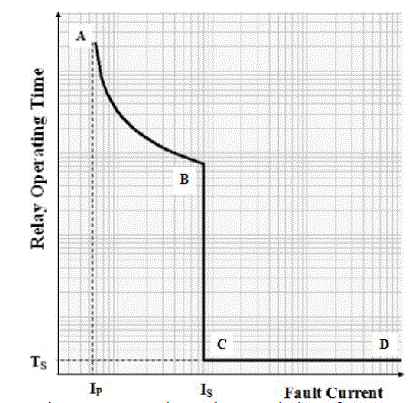
| Curve A-B is the inverse characteristic of the relay and is used to protect apparatus from excessive currents less than severe short circuit fault levels but large enough, that if allowed to sustain for a certain period would damage the apparatus it is meant to protect. Moreover, Curve B-C-D is meant for instantaneous, high speed clearing of severe short circuits (>IS) by reducing the clearing time to only Ts. The inverse time current characteristic of an over-current relay can be given as |
 |
| Where T is the operating time of the relay; Ia is the fault current normalized by the pickup current i.e.Ia=(IC/IP)Ic is the actual current; IP is the pickup current and ISis the short circuit current. ‘n’ and ‘K’ are constants. ‘n’ determines the inverse characteristic of the relay and K determines the relative operating time of the relay by shifting the inverse characteristics curve on vertical axis of Fig.2. |
| Equation (1) can be modified in terms of actual faults as: |
 (2) (2) |
| Over-current relays employed in a system should be coordinated with other relays in such a manner that if the primary protection fails to operate, then back- up protection should accomplish the task |
| For a fault F, beyond bus bar B, relay RB should cause its associated circuit breaker C.BB to clear the fault. If it fails to do so then relay RA, acting as back-up, should actuate its circuit breaker C.BA, to ensure fault isolation. For correct grading, the time setting of relay RA should always be greater than that of RB by an amount in which RB was supposed to have cleared the fault and this time is usually the sum of operating time of RB and breaker operating time (TC.B.B) i.e. |
 (3) (3) |
Directional Over-Current Relay:
|
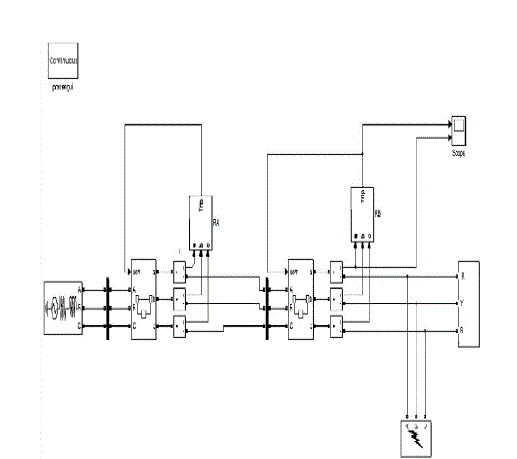
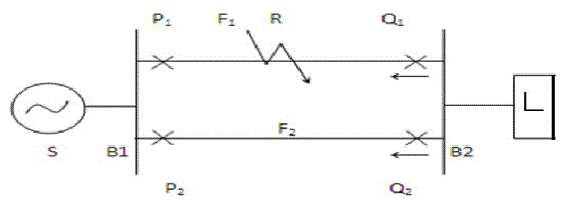
| To protect ring or loop networks directional over current relays are commonly employed. The directional element is added with the over-current relay in order to minimize the outage area. If non-directional relays are applied to parallel feeders, any fault occurring on any one of the feeders will result in complete loss of supply to the other end. With this type of system configuration, it is necessary to apply directional relays at the receiving end and to grade them with the non-directional relays at the sending end, to ensure correct discriminative operation of the relays during line faults. This is done by providing directional relays Q1 and Q2 at the other end looking non directional relays P1 and P2, at the source shown in Fig. 5 |
RELAY MODELLING
|
Over-Current Relay Modeling:
|
Measuring Peak Value Ic:
|
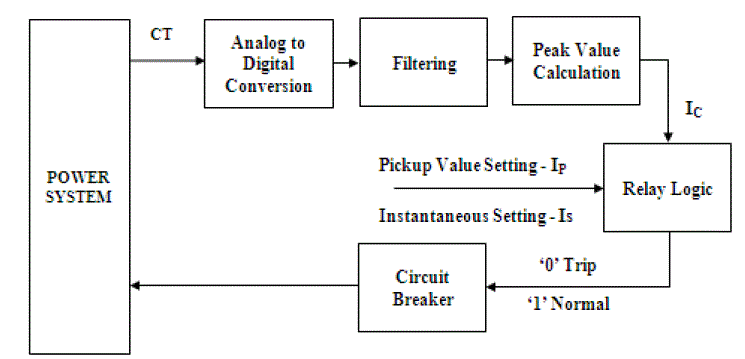
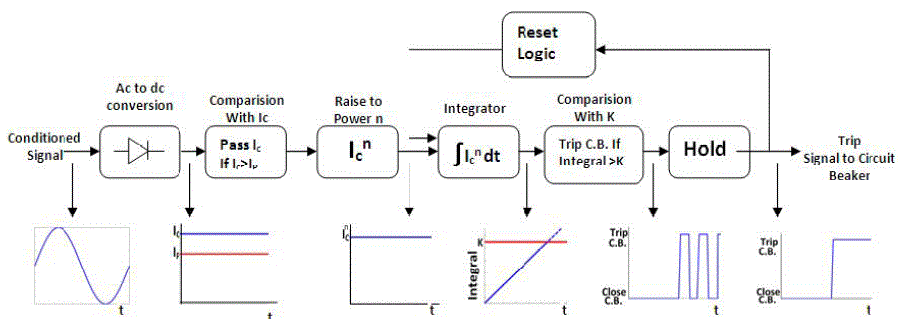
| After filtering the fundamental component, ac current signal(I) of frequency ‘f’ entering the relay must first converted to a representative dc value( peak/r.m.s.) for comparison with the pre-set pick-up current of relay. By measuring the slope at the zero crossing of the current signal, we get its peak value (Ic) as mathematically given in (4). |
 (4) (4) |
 (5) (5) |
| The slope ‘m’ at the zero crossing is: |
 (6) (6) |
 (7) (7) |
Measuring frequency f:
|
| The frequency is determined by measuring the time between two consecutive zero crossings (T1 & T2). This will give half the time period (T) from which frequency is determined as follows: |
 (8) (8) |
 (9) (9) |
Directional Overcurrent Relay Modeling:
|
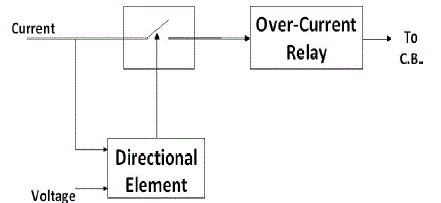
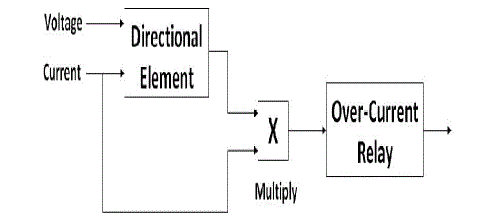
| The OCR relay designed above can be modified to behave also as a directional O.C. relay simply by incorporating a directional feature with the relay. The directional feature acts as a switch to allow current to pass to the O.C. relay to take decision only when power flows in a particular direction as shown in Fig.7. |
| These directional relays may use the phase angle between the fault current and some reference quantity (the corresponding voltage, for example) to determine the direction (forward or reverse) of the fault. |
| If ‘Ψ’ (let) is the angle between current in a phase and voltage on that phase then |
| -90o<Ψ < 90o shows Normal direction of load flow |
| 90o>Ψ > 270o shows Reversed power flow |
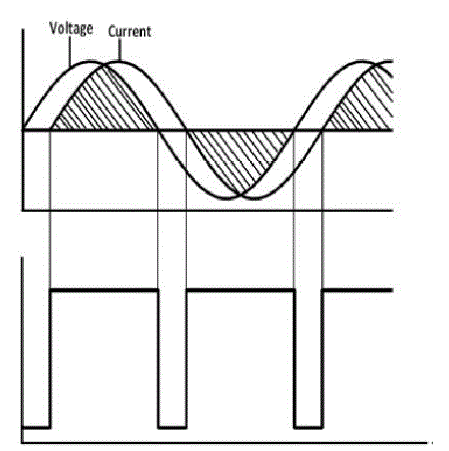
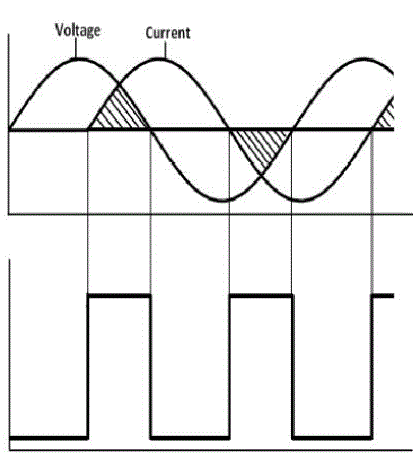
| Fig. 8a shows that during normal conditions (-90o<Ψ < 90o) the overlapping interval between voltage and current is longer than their non-overlapping interval whereas under reversed power flow conditions (90o>Ψ > 270o) the opposite is true as shown in Fig. 8b. |
| This difference in the overlapping interval under normal and reversed power flow conditions can be used to implement the directional element of a relay. |
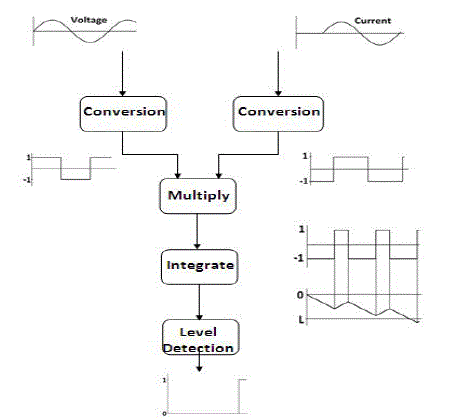
| To model the directional element, the current and voltage signals are first converted to a two level square wave, whose value is ‘1’ for positive values and ‘-1’ for negative values of the signals. The 2 level voltage and currents signals are then multiplied, giving an output ‘1’ during the overlapping and ‘-1’ for the non-overlapping interval. The product is then integrated. The upper limit of the integrator is set to saturate at a value of 0 so that under normal load flow conditions the integral always remains less than 0.However,under reversed power flow conditions the integral output tends to fall until it reaches the level below ‘L’, in which case the directional element’s output switches from ‘0’ to ‘1’. Fig.9 shows the concept diagram for implementing the directional element. |
| The directional element with an output ‘1’ under abnormal conditions and ‘0’ otherwise, serves as a switch by multiplying its output with the samples of current, to be sent to the O.C. relay as illustrated in Fig. 10. |
RELAY COORDINATION STUDY USING ETAP SOFTWARE
|
| Relays for breakers on the primaries of transformers: |
| 1. Pickup is typically chosen at approximately 140% of nominal transformercurrent or higher if coordination considerations dictate that. Values up to600% are allowed by the NEC, depending on system parameters andwhat other protective devices are used. |
| 2. Instantaneous pickup is greater than or equal to 160% of short circuit current for maximum fault downstream of the transformer to avoid tripping of the primary breaker for an asymmetrical secondary fault. 160% is used for larger transformers. |
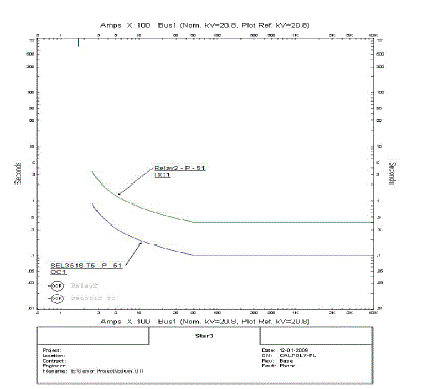
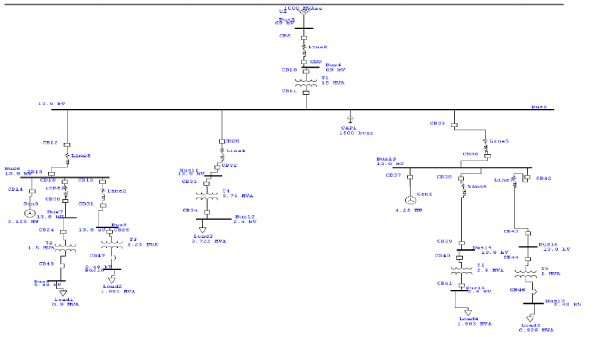
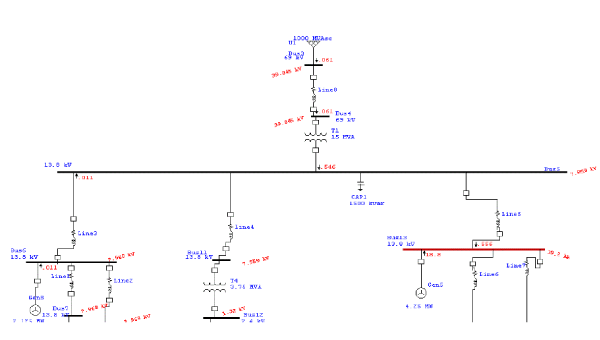
| ETAP’s STAR module was used to coordinate the time-current curves associated with the SEL351-s protective relays. In this study, there is a maximum of two protective devices needing to be coordinated at any given time. This occurs when a fault happens in any of the feeders tied in with the transformers. There are guidelines in coordinating these devices. There must be adequate time for the relay to sense the fault, transmit to the breaker, and open the breaker. If this does not occur in the downstream device, then the upstream device must perform this function. It is an industry standard that this coordination time is 0.30 seconds. The time-current curves for ideal operation are shown below (Fig11). The time-current curve for operation under backup power is shown in the appendix. |
SIMULATION RESULTS
|
 |
 |
 |
 |
 |
 |
 |
 |
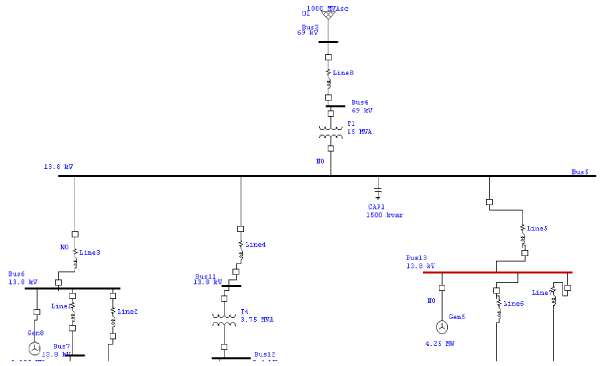 |
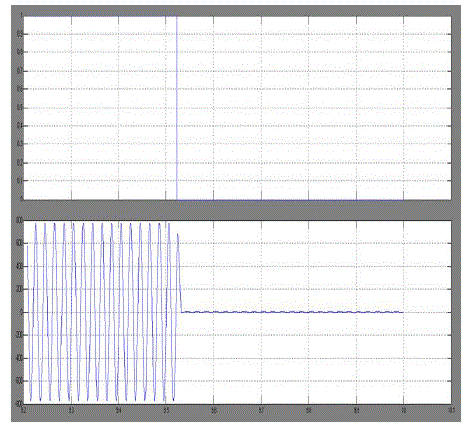
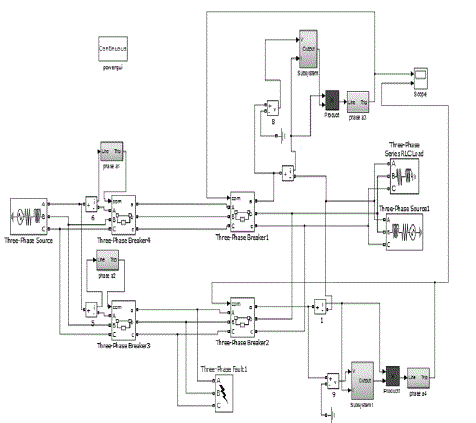
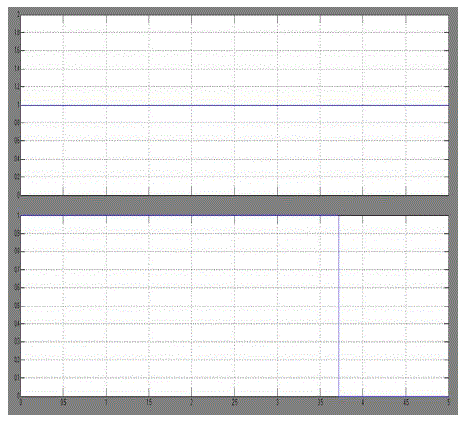
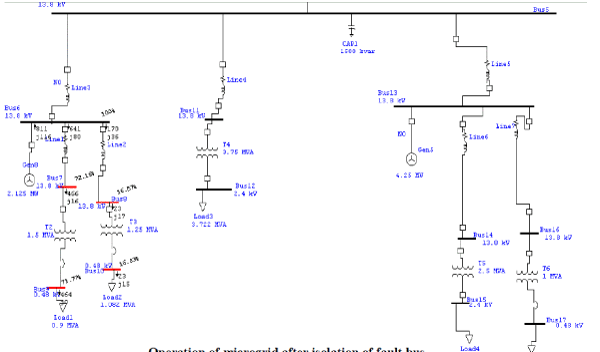
| Operation of microgrid after isolation of fault bus |
CONCLUSION
|
| These models have also been contributed to MATLAB’s resources to strengthen their Power System Tools. The performance of these models was showcased using suitable tutorial examples. It is shown that these models offer effective means for explaining the functionality of OCR and Directional OCR under various operating scenarios. Additionally, the systematic unfolding style of model development and performance analysis means that this paper could also serves as guide to develop similar relay models and benchmark performance. Also relay coordination study is made using ETAP. |
Figures at a glance
|
 |
 |
 |
 |
| Figure 1 |
Figure 2 |
Figure 3 |
Figure 4 |
 |
 |
 |
 |
| Figure 5 |
Figure 6 |
Figure 7 |
Figure 8 |
 |
 |
 |
| Figure 9 |
Figure 10 |
Figure 11 |
|
References
|
- Vahidi, B. and Esmaeeli, E. MATLAB-SIMULINK-Based Simulation For Digital Differential Relay Protection of Power Transformerfor Educational Purpose. In: J ComputApplEngEduc 29 SEP 2010.
- Sidhu, T.S.; Sachdev, M.S.; Wood, H.C. Design of a microprocessor-based overcurrent relay. In: IEEE Western Canada Conference.1991, p. 41 – 46.
- Yalla V.V.S. Murty, a and W.J. Smolinskib. Design and implementation of a versatile digital directional overcurrent relay. In: JElectrPowSyst Res January 1990; 18(1): p. 47-55.
- Benmouyal G, Meisinger M, Burnworth J, Elmore WA, Freirich K, Kotos PA, Leblanc PR, Lerley PJ, McConnell JE, Mizener J, Pintode Sa J, Ramaswami R, Sachdev MS, Strang WM, Waldron JE, Watansiriroch S, Zocholl SE. IEEE standard inverse-time characteristicequations for overcurrent relays. In: J IEEE T Power Syst; 1999 14(3): 868 – 872
- Jhanwar V, Pradhan, AK. Accurate Overcurrent Relay Algorithm using Fundamental Component. In: Power System Technology andIEEE Power India Conference, 2008. POWERCON 2008.
- YG Paithankar, SR Bhide.Fundamentals of Power System Protection.Prentice- Hall of India Pvt.Ltd, 2004.
- Peter Rush. Network Protection & Automation Guide ALSTOM T&D Energy Automation & Information: 2002.
- Stanley H. Horowitz, Arun G. Phadke. Power System Relaying. John Wiley & Sons; June 2008.
|