Keywords
|
| Distributed generation, fuel cell (FC), grid interface, power conditioning unit, power quality, pulse width modulation (PWM) inverter, stand-alone system. |
INTRODUCTION
|
| Rapid growth in energy consumption during the last century on the one hand, and limited resources of energy on the other, has caused many concerns and issues today. Although the conventional sources of energy, such as fossil fuels, are currently available in vast quantities, however they are not unlimited and sooner or later will vanish. Moreover, environmental concerns, such as global warming, are becoming increasingly serious, and require significant attention and planning. Renewable energy sources are the answer to these needs and concerns, since they are available as long as the sun is burning, and because they are sustainable as they have no or little impact on the environment. One technology which can be based upon sustainable sources of energy is fuel cell. |
| Fuel cells are devices that directly convert the chemical energy stored in some fuels into electrical energy and heat. The preferred fuel for many fuel cells is hydrogen, and hydrogen fuel is a renewable source. of energy; hence fuel cell technology has received a considerable attention in recent years. |
| Since the FC delivers dc power, it must be inverted and stepped up to be able to use for household applications as well as for distributed generation. Another serious problem with FC is that its voltage decreases almost linearly with the increase in load current; hence, output voltage must be regulated at a desired level. Therefore, a suitable power electronic interface is required between FC and load/grid, with the capabilities of FC voltage regulation, output voltage matching, and galvanic isolation between FC and load/grid. |
| The aforementioned tasks can be achieved either by connecting a dc–dc converter with voltage gain to the FC followed by a dc/ac inverter or by directly connecting an inverter to the FC followed by a step-up transformer as shown in Fig. 1. Several topologies of switched-mode dc–dc converter followed by inverter are proposed and compared based on their performance [8]–[14]. A switched-mode dc–dc converter is preferred to limit the size and cost of the system followed by a grid-connected inverter [8]. A current-fed dc–dc converter is preferred over a voltage-fed dc–dc converter as the former requires reduced input filtering. A push–pull dc–dc converter is selected with voltage gain [8], [10], [11] to reduce the switch conduction losses. However, its use is restricted to low- and medium-power applications. Full-bridge topology is preferred for high-power applications as push–pull topologies have a serious problem of center tap termination, which tends to cause saturation of the transformer at high-power levels [9]. However, a full-bridge topology requires more switches but of half rating, which is more economical and efficient [9], [12], [13]. |
| All these topologies discussed earlier use multiple-stage conversion to deal with the aforementioned challenges, which results in large component count and, therefore, poor reliability, additional cost, and low efficiency. In addition to this, energy storage devices such as battery and ultra capacitors are also needed at various stages [9], [10] either to supply auxiliaries or to improve the slow transient response of the FC. |
| Direct connection of dc/ac inverter to the FC with ac gain has only one conversion stage [15]. This topology offers the advantages of least component count and low losses. Also, single conversion facilitates reverse power flow from grid particularly during start-up to supply the auxiliaries. The step-up transformer provides the isolation between FC and load as well. Grid interface of renewable power sources like FC is one of the probable area of research particularly during peak loads [16]. However, complete design, mathematical modeling, and implementation of control scheme are some of the issues that need more focused attention. |
| This paper presents modeling and simulation of a single stage power electronic interface between FC and load/grid. A mathematical model of the FC-based power supply system is developed in qd0 reference frame in terms of FC, converter, and power system parameters. This model is used to define the active and reactive power limits, which can be supplied by the system to facilitate grid interface. The model is developed in per unit (p.u.) system which can be further extended for grid connected environment. The topology selected can also be used for bidirectional conversion to supply the auxiliaries from the grid initially for start-up. A Nexa™ proton exchange membrane (PEM) FC of 1.2 kW is considered for the design and study. The I–V characteristics of the FC are obtained considering the effect of temperature and hydrogen pressure. After comparing the simulated characteristics with experimentally obtained I–V characteristics, a simplified model of FC is developed based on its practical characteristic in linear region. The simulation model is developed in MATLAB–Simulink and Sim Power- Systems environment. Control scheme is implemented in qd0 stationary reference frame, and various simulation results are presented in steady state as well as during transients |
FUEL CELL
|
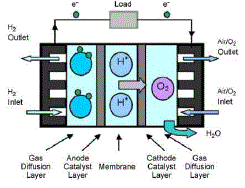
| Proton Exchange Membrane fuel cells (PEMFC) are electrochemical energy conversion devices that convert the chemical energy of supplied reactants (hydrogen and oxygen) into electricity. To summarize the operation simply, reactant gases are supplied to both electrodes of the fuel cell via the channels, the gas diffusion layer facilitates even distribution to the catalyst-coated membrane, and the catalyst accelerates the oxidation and reduction of the reactants, which are the primary reactions desired for fuel cell operation as shown in Figure 1 . |
| The oxidation on the anode side of the membrane releases two electrons, which then traverse the circuit to satisfy the load required of the cell, while the remaining protons (H+) travel through the membrane to the cathode side. The O2 reduction on the cathode side splits the oxygen molecule, which then joins with the electrons completing the circuit and the protons from the membrane to form product water H2O |
| A Reactions in Fuel cell |
| The reactions in a fuel cell are |
| Anode Reaction: |
 |
| Cathode Reaction |
 |
| Overall Reaction |
 |
| B Advantages of fuel cells |
| 1. They transforms the fuel chemical energy into electric power with 60% efficiency which is considered to be twice that of traditional generating stations. |
| 2. The absence of moving parts in fuel cell’s operation, expect for air blowers (for O2) and (for H2) and /or water pumps, result in very low noise levels, relatively higher efficiency and emits lower air pollutants. |
| 3. No combustion is involved in the fuel cell operation that make it environmental friendly generation with approximately negligible emission of CO2. |
| C Disadvantages of fuel cells |
| The main disadvantage of fuel cell is that aging of fuel cell causes the internal impedance to increase slowly and therefore in order to regulate the output voltage a power electronic interface is required, which increases the cost. |
FUEL CELL POWER SUPPLY SYSTEM
|
| The single-line diagram of the proposed single-stage FC based power supply system is shown in Fig. 3.2. A single-stage PWM inverter followed by a low-pass filter is used with a Nexa™ PEM FC. Since FC operates in low voltage range (2θ–48 V) and load/grid voltage is relatively high (415Vrms), a step-up transformer is used to meet the desired voltage level. It also provides the isolation between FC and load. |
SYSTEM DESIGN
|
| A FC Model |
| The performance of the FC is improved by thermodynamics and electrical efficiency of the system. The thermodynamic efficiency depends upon the fuel processing, water management, and temperature control of the system. However, the electrical efficiency depends on the various losses over the FCs like ohmic loss, activation loss, and concentration loss. In reality, the FCs differ in terms of characteristics, material used in construction, and their suitability of applications. Hence, the development of an accurate FC model is very important. PEM FC models are reported in the literature based on the thermodynamic and electrochemical equations . A mathematical approach is presented for building a dynamic model for a PEM fuel-cell stack. To simplify the analysis, the following assumptions are made |
| a)Ideal and uniformly distributed gases, |
| b) Constant pressures in the fuel-cell gas flow channels, |
| c) The fuel is humidified and the oxidant is humidified air. Assume the effective anode water vapour pressure is 50% of the saturated vapour pressure while the effective cathode water pressure is 100%. |
| d) The fuel cell works under 100 0C and the reaction product is in liquid phase. |
| e) Thermodynamic properties are evaluated at the average stack temperature, temperature variations across the stack are neglected, and the overall specific heat capacity of the stack is assumed to be a constant. |
| f) A fuel cell stack is represented by combining parameters for individual cells . |
| The proportional relationship of the flow of gas through a valve with its partial pressure can be expressed as |
 |
 |
| For hydrogen, there are three relevant contributions to the hydrogen molar flow: the input flow, the flow that takes part in the reaction and the output flow. The relationship among these factors can be written as: |
 |
| According to the basic electrochemical relationship between the hydrogen flow and the stack current can be written as : |
 |
| The polarization curve for the PEM fuel cell is obtained from the sum of the Nernst’s voltage, the activation over voltage η act, and the ohmic over voltage ηohmic. Assuming constant temperature and oxygen concentration, the fuel cell output voltage may be expressed as |
 |
| The FC stack voltage under loaded condition (Vdc_stack) is a function of activation loss (Vact), concentration loss (Vcon), and ohmic loss (Vohmic) and is given by Nernst equation: |
 |
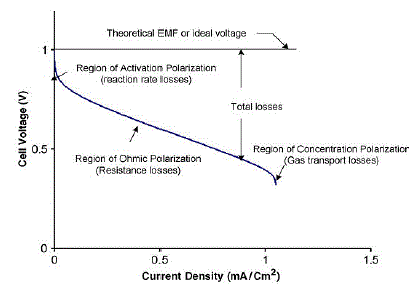
| Based on this, a dynamic model of Ballard 1.2-kW FC is developed in MATLAB/Simulink . It can be seen that, at low current level, the ohmic loss becomes less significant and the increase in output voltage is mainly due to activity of slowness of chemical reactions. At very high current density, the voltage fall down significantly because of the reduction of gas exchange efficiency. This is mainly due to over flooding of water in catalyst. Intermediate between the active region and concentration region, there is a linear slope which is Figure.3 |
| It has been observed that the FC can be operated dramatically within the linear region by changing the internal resistance offered by the FC stack under different loading conditions at different temperatures and hydrogen pressures. The experimentally measured output characteristic of the Nexa™ FC is that the characteristics are almost linear. In general, at the rated power (the net output power is around 1.2 kW), the output voltage ranges from 26 to 29 V at the beginning of life, and the current is around 45A. Therefore, the FC output characteristics can be linearized. The linearized equation is given by |
 |
| where Vfc_lin is the linearized output voltage, V0_lin is the linearized voltage without the load (V0_lin = 39 V), Rin_lin is the linearized internal resistance (Rin_lin = Rfc = 0.24 Ω), and Ifc is the FC current. Therefore, the static equivalent internal resistance might be considered as 0.24 Ω. Based on the linearized FC characteristics, the output voltage range is considered herein as 36–2θ V with an internal resistance of 0.24 Ω, to define the lower and upper power limits with minimum loading of 360 W (10 A) to maximum loading of 1170 W (45 A). |
B Simplified Model
|
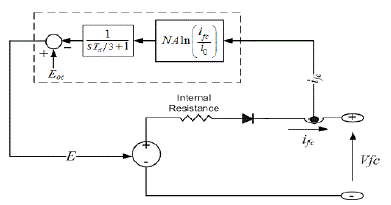
| The simplified model represents a particular fuel cell stack operating at nominal conditions of temperature and pressure. A diode is used to prevent the flow of negative current into the stack. This model is based on the equivalent circuit of a fuel cell stack shown in Figure.4. |
| C Filter Design |
| An LC filter is connected before the step-up transformer to filter out the harmonics present in the inverter output. For a switching frequency around 4860 Hz , the lowest order harmonic available in the inverter output voltage is in the range of 4740 Hz. Therefore, the cutoff frequency of LC filter can be selected as 1200 Hz, which is 20 times greater than the fundamental frequency and almost four times lower than the switching frequency (4860 Hz), so as not to attenuate the fundamental frequency. The resonance frequency can be expressed as |
 |
| Based on the aforementioned expression, different combinations of filter components are taken. Considering a cutoff frequency of 1200 Hz, Q factor of 30, THDV and THDI that are less than 5%, and inductor power loss < 1%. |
| D Mathematical Modelingc |
| An FCPP consists of an FC stack and a power conditioning unit as discussed earlier. Generally, for simplicity of calculation, the transformation of three-phase quantities is done into the two-phase quantities. This gives reduction in sensing circuits in real-time work. Therefore, the three-phase stationary circuit elements fabc are transformed to the arbitrary reference frame fqd0 . Hence, the mathematical model of the FCPP is developed using dq reference frame to study the static and dynamic characteristics. The model is developed in p.u. system to generalize the system for any rating . The single-line diagram of the FCPP representing a three phase, symmetrical, and balanced steady-state system is shown in Fig. 2 . The utility grid is represented by an infinite bus with a constant voltage source (Vs , fs) with short circuit impedance Zs . The FC is represented by a constant voltage source Efc with internal resistance Rfc. The converter is considered to be lossless. ZT and Zf are the impedances of transformer and filter inductor, respectively. Bus T is the FCPP interface bus to the grid. |
| D Selection of P.U. Values |
| AC-Side Base Values |
| The FC nominal power expressed in volt amperes is selected as the base power for the purpose of defining the base p.u. values. RMS values of the rated phase voltage are generally selected as the base voltage for abc variables, whereas peak values are selected for qd variables . However, as the p.u. values remain the same in both systems, the rms value of line-toneutral voltage is preferred here to normalize the voltage, as system variables are generally defined in rms values. The fundamental rated frequency is considered as the base frequency. All other base values are derived from the aforementioned independent base values given hereinafter |
base VA  |
base voltage  |
base current  |
base impedance  |
FC Base Values
|
| The proposed FC base quantities (dc) are derived from the voltage source converter with SPWM modulation. The ac-side line-to-neutral rms voltage is proportional to the dc-side FC voltage as |
 |
| where ma is the amplitude modulation . |
| Assuming a lossless converter, FC base voltage and current can be obtained by equating the powers at ac and dc sides of the inverter, operating at unity power factor (cosθ = 1) and ma = 1, as |
 |
 |
| E Steady-State Model of FCPP |
| Inverter-Side (AC Side) Equations |
| The steady-state model of FCPP is developed in qd reference frame to define the power limits in terms of converter and FC parameters. The symmetrical, balanced, and three-phase voltages at converter, transformer, and utility bus C, T, and S, can be expressed as |
 |
| =Vi[cos(ωit+θi0)cos(ωit+θi0−2π/3)cos(ωit+θi0+2π/3)]T i∈[C,T,S] where VC , VT , and |
 |
| The zero component does not exist in a symmetrical system; thus, (3.20) can be written in converter’s qd reference frame |
 |
 |
 |
| Voltage at bus C can be expressed as a function of the voltage at the bus S, current, and system impedance expressed in the converter’s qd reference frame |
 |
| The current can be expressed in the converter’s qd reference frame as |
| where R = RT + RS , X = XT + XS , Z =√ and γ = π/2− tan −1 X/R |
 |
| Power at the converter bus C can be expressed as |
 |
| On putting iq and id from (3.24), active and reactive powers at converter bus can be expressed |
 |
| If the ratio X/R is large (>10), γ → 0; thus, (3.26) can be simplified to |
 |
| Equation (3.27) is known as power expressions for sending and receiving end nodes interconnected with the impedance Z or reactance X, respectively. |
| FC-Side (DC Side) Equations: |
| As validated above from the approximate linearized equivalent circuit, the FC voltage can be expressed in terms of FC current and resistance as |
 |
| where Efc and Rfc are constant for an operating condition. Equation (3.28) is valid for ifc ∈ [0, ifc,max], for ifc ≥ ifc,max, |
| Vfc → 0. |
| As the converter’s switching frequency is very high as compared to fundamental frequency, the fast average value of the converter voltage ˆvC,abc can be defined as the average value over the switching period, in terms of the modulation index |
| “ma” and dc-side voltage Vfc |
 |
| The fast average converter voltage can be expressed in the converter’s qd reference frame (ω = ωC ) by dropping the superscriptˆfor simplicity |
 |
| Assuming a lossless converter, active power is equal on both sides of the converter |
 |
| or ifc =maiq. |
| Power Equations in Terms of System Parameters: |
| The active and reactive powers at converter bus “C” can be expressed as |
 |
 |
| Active and reactive powers converter bus “C” (PC ,QC , VC ) can be expressed as a function of the system variables—FC (Rfc, Efc), converter (Rfc, Efc), filter and transformer (Zf , ZT ), and utility (VS , ZS ) . Active and reactive powers delivered and voltage regulation of the FC system are dependent on the total system impedance as well as the relative strength of the connected utility grid. The aforementioned equations can be simplified to evaluate the effects of power system parameters neglecting the system resistance . Above said equations can be used to study the effect of power system and FC parameters on power flow. Although the maximum power flow PCmax is a function of both the FC and the power system parameters for grid-connected environment (similar to power–angle characteristics of the system with two active ac sources), in this case, it is limited only by the FC parameters Efc and Rfc |
CONVERTER TOPOLOGY AND CONTROL SCHEME
|
| A Basic Scheme and Power Converter Topology |
| The single-line diagram of the proposed single-stage fuel cell based power supply system is shown in Fig.2. A singlestage PWM inverter followed by a low-pass filter is used with a 1.2-kW 48-V Nexa™ PEM FC. Since FC operates in low voltage range (26–48 V) and load/grid voltage is relatively high a step-up transformer is used to meet the desired voltage level. It also provides the isolation between FC and load. |
| A single-bus six-switch voltage source PWM bridge converter used for dc–ac conversion is preferred here for threephase application suitable for grid interface. The bridge uses six MOSFET switches at low voltage level , which is economical and efficient. The sinusoidal PWM (SPWM) switching is preferred here which minimizes the passive components; however, it requires high speed switching devices and more complex control efforts, which is not a challenge with the availability of high-frequency power semiconductor devices and modern control tools like fast digital signal processors. |
| A low-pass LC filter is used at the PWM inverter output to achieve better harmonic reduction in the phase current and inverter output voltage. Inverter-side placement of filter results in high current rating of the filter inductor, whereas capacitors are rated at a reduced voltage. As the load increases, FC voltage decreases. In order to operate the FC efficiently, the flow rate of hydrogen must be adjusted with the change in load. However, depending on the type of FC system, this flow change is a very slow process and has time constant as large as 30 s Therefore, some type of energy storage is required. |
| Series of batteries can be placed across the FC stack but require additional circuitry for regulated dc bus. Also, numbers of cells in series are not only expensive but have a short life time and require costly battery management system for safe operation [9], [10]. Use of a capacitor/ultra capacitor is a viable alternative to batteries. Capacitors have a wider voltage range and can be placed in parallel across the FC without any additional circuitry. Ultra capacitors have a specific energy density less than that of a battery, but a specific power greater than a battery. Ultra capacitors can hold the charge over extended periods of time. Unlike batteries, ultra capacitors have a short charge time and much longer lifetime. However, availability and cost are considerable issues. |
| B Control Strategy |
| As the FC voltage is usually very small, around 1.2 V, it becomes necessary to stack many cells that need to be connected in cascaded series and parallel form to increase its power capacity. A typical FC polarization characteristic is shown in Fig. 3. It is observed that a linear region exists where FC voltage drops as the current density increases due to its ohmic nature. This region is observed mainly due to internal resistance offered by various components, called ohmic polarization. At low current level, the ohmic loss becomes less significant; the increase in output voltage is mainly due to activity of the chemical reactions (time taken for warm-up period). Thus, this region is also called active polarization. At very high current density, the voltage fall down significantly because of the reduction of gas exchange efficiency; it is mainly due to over flooding of waters in catalyst, and this region is also called concentration polarization . This reduction in the FC voltage with increase in current drawn (output power), keeping constant the hydrogen flow rate, can be regulated by controlling the modulation index (ma) of the PWM inverter as shown by |
 |
| where Vac is the ac output voltage, Vdc is the FC output voltage, ma is the inverter modulation index, and δ is the inverter phase angle . |
| As control of magnitude of the output voltage is not enough to meet the active power requirement of the load, the phase angle of the inverter “δ” should also be controlled. These two variables (ma and δ) are used to control the transient power adjustments. Hydrogen flow rate must be adjusted to control the steady-state power requirement. Output voltage is compared to the reference voltage command to control the modulation index “ma” , which ultimately regulates the inverter output voltage and reactive power flow as well. In order to control the reactive power flow in grid-connected environment, voltage is compared with the reference voltage and processed in proportional–integral (PI) controller,PID and Fuzzy Logic Controller to control the inverter output voltage. |
SIMULATION RESULTS
|
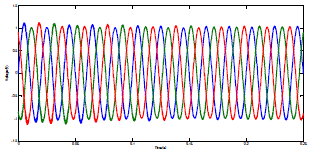
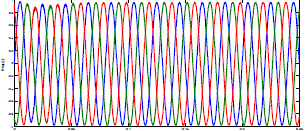
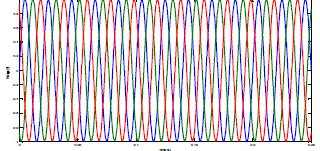
| The simulation model for the control of converter parameters (ma and δ) in closed loop is developed in MATLAB environment. The FC voltage is applied to the MOSFET inverter through a dc link capacitor. The MOSFET inverter is controlled using SPWM at 4.86-kHz carrier frequency. The circuit is discretized at a sample time of 1 μs . The output of PWM inverter is applied to a step-up transformer after filtering. The load voltage is regulated at 1 p.u. (415 Vrms) by PI,PID and fuzzy voltage regulator using abc-to-dq and dq-to-abc transformations. The output of the voltage regulator is multiplied by the reference sine vector to generate the three modulating signals used by the PWM generator to generate the firing pulses. |
COMPARISON BETWEEN THREE CONTROL STRATEGIES
|
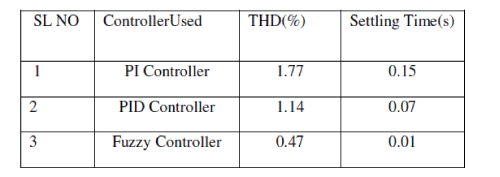
| Results of two control schemes are summarized in the table below. From the table we can conclude that % THD reduces more with Fuzzy logic controller. With PI controller THD is reduced from 83.72% to 1.77% after filtering. With PID controller THD is reduced from 99.88% to 1.14% after filtering . With fuzzy controller THD is reduced from 89.88% to 0.47% after filtering .Settling time is also minimum with Fuzzy logic controller. |
 |
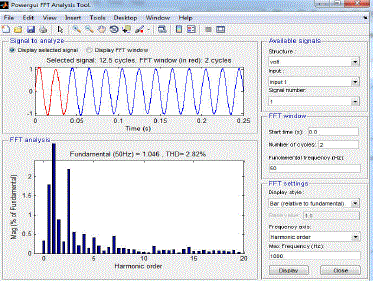 |
| FFT analysis using PI controller |
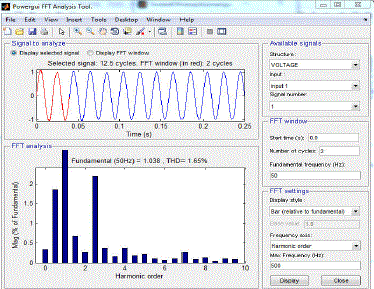 |
| FFT analysis using PID controller |
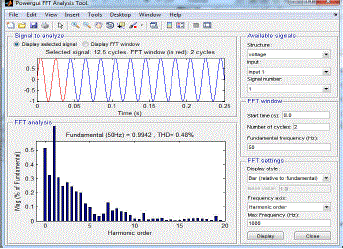 |
| FFT analysis using Fuzzy Logic Controllers |
| Comparision Of Results Using FFT Analysis |
 |
Figures at a glance
|
 |
 |
 |
 |
| Figure 1 |
Figure 2 |
Figure 3 |
Figure 4 |
|
 |
 |
 |
| Figure 5 |
Figure 6 |
Figure 7 |
|
References
|
- Shailendra Jain, Jin Jiang, Xinhong Huang, Member and SrdjanStevandic, “Modeling of Fuel-Cell-Based Power Supply System for GridInterface”Proc. IEEE, vol.48, no.4,pp. 1142- 1153, july/august 2012
- M. Farooque and H. C. Maru, “Fuel cell the clean and efficient power generators,” Proc. IEEE, vol. 89, no. 12, pp. 1819–1829, Dec. 2001..
- M. L. Perry and S. Kotso, “A back-up power solution with no batteries,” in Proc. IEEE IEEETelecommun. Energy Conf., Sep. 19–23, 2004, pp. 210–217.
- M. W. Ellis, M. R. Von Spakovsky, and D. J. Nelson, “Fuel cell systems:Efficient,flexible energy conversion for the 21st century,” Proc. IEEE, vol.89, no. 12, pp. 1808–1818, Dec. 2001.
- M. C. Williams, “Fuel cells and the world energy future,” in Proc. IEEE-PES Summer Meeting, Vancouver, BC, Canada, Jul. 15–19, 2001, pp. 725–730.
- θ J. Anzicek and M. Thompson, “DC–DC boost converter design for Kettering University’s gem fuel cell vehicle,” in Proc. IEEE Elect. Insul. Conf.,2005, pp. 307–316.
- W. Gao, “Performance comparison of a fuel cell-battery hybrid powertrain and a fuel cell-ultracapacitor hybrid powertrain,” IEEE Trans. Veh.Technol., vol. 54, no. 3, pp. 846–855, May 2005.
- K. Rajashekara, “Power conversion and control strategies for fuel cell vehicles,” in Proc. IEEE IECON, Nov. 2–6, 2003, vol. 3, pp. 2865–2870.
- G. K. Andersen, C. Klumpner, S. B. Kjter, and F. Blaabjerg, “A newgreen power inverter for fuel cells,” in Proc. PESC, Jun. 23–27, 2002, pp. 727–733.
- T. A. Nergaard, J. F. Ferrell, L. G. Leslie, and J.-S. Lai, “Design considerations for a 48 V fuel cell to split single phase inverter system withultracapacitor energy storage,” in Proc. IEEE PESC, Jun. 23–27, 2002, vol. 2, pp. 2007–2012.
|