Keywords
|
| Planning, Forecast, Rainfall, Fuzzy logic |
BACKGROUND TO THE STUDY
|
| Despite the fact that rigorous numerical modeling of meteorological processes continue to improve, there will likely continue to be processes that elude explicit analytical solutions (Jim, 2005). Physical processes not yet understood or those beyond the scope of the models still need alternative methods for their analysis and subsequent forecast (Zadeh, 1983). Processes such as fog, stratus and convention have always been difficult to forecast. Rainfall is one of the meteorological process that meteorologist seeks to predict more accurately. Though various kinds of models like statistical model have been used for years in the prediction of rainfall, the models have many drawbacks (Cirstea, et al 2002). The drawback of statistical modeling is dependence, in most cases, upon several tacit assumptions regarding the system (Wilks, 1998). With the rapid evolving technologies in the field of meteorology, it is desirable to merge the experience of many forecasters with algorithms that may aid in difficult forecasting situations (Jim, 2005). Cognitive computing has been an emergent set of problem solving algorithm that attempt to imitate natural problem solving techniques (Jang, 1997). One of such is fuzzy logic. Fuzzy logic is a simple yet powerful problem solving technique with extensive capabilities. It is currently used in the fields of business, systems controls, electronics and traffic engineering (Jim, 2005). The technique can be used to generate solutions to problems based on “vague, ambiguous, qualitative, incomplete or imprecise information.” Fuzzy logic is an extension of fuzzy set theory that was developed approximately 30 years ago. |
| The intent of fuzzy set theory was to alleviate problems associated with traditional binary logic, where statements are exclusively true or false (Cirstea, et at 2005). Fuzzy logic allows something to be partially true and partially false hence taking care of neglected quantities in binary logic. Hence, this project is based on the application of fuzzy logic in one of the meteorological process, which is rainfall in order to get more accurate predictions in the area. |
PROBLEM STATEMENT AND RESEARCH OBJECTIVES
|
| Weather forecasting is one of the most important and demanding operational responsibilities carried out by meteorological services worldwide (Hasan, Tsegaye, Shi, Schaefer and Taylor, 2008). It is a complicated procedure that includes numerous specialized technological fields (Hasan et al., 2008). The task is complicated in the field of meteorology because all decisions are made within a visage of uncertainty associated with the weather system (Hasan et al., 2008). Chaotic features associated with atmospheric phenomenal has also attracted the attention of modern scientist. The drawback of statistical model is dependence, in most cases, upon several tacit assumptions regarding the system (Wilks, 1998). Carrano et al. (2004) compared non-linear regression modeling and fuzzy knowledge-based modeling, and explained that fuzzy models are most appropriate when subjective and qualitative data are utilized and the numbers of empirical observations are small. Fuzzy inference model yield a lower percentage of error when compared to the linear multiple regression model (Hasan et al., 1995). Similar research by Wong et al. (2003) compared the results of fuzzy rule-based rainfall prediction with an established method which uses radial basis function networks and orographic effect. Hasan et al. (2008) concluded that fuzzy rule-based methods could provide similar results from the established method. Therefore the problems associated with the statistical model need to be addressed and the fuzzy rule-based model is the most efficient alternative means. The researchers hereby wish to explore such potential in this domain of study. Based on the problem, the following specific objectives are formulated: |
| 1. To explore the use of fuzzy logic in rainfall prediction. |
| 2. To develop a fuzified model for rainfall prediction. |
THE ALGORITHM FOR PLOTING THE GRAPH
|
| The project is going to have two input variables and one output variable. The inputs variables are the wind speed and the temperature at a particular time and the output will be the amount of the rainfall expected. Temperature and the wind speed are chosen because it was proved that they are the factors that influence the occurrence of rainfall. The input variables values (wind speed and temperature) are grouped into five using the linguistic variable terms which are: |
| Negative large: Very Low |
| Negative small: Low |
| Zero: Normal |
| Positive small: High |
| Positive large: Very High |
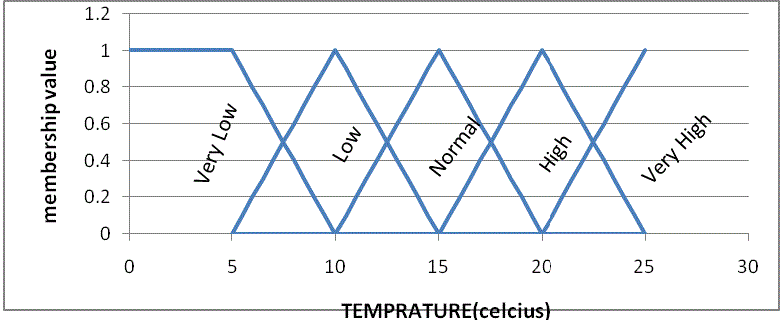
| For a particular input variable the variable will either belong to one of these or at most two of it with a membership value. For example, a temperature of 30 Celsius may be a member of high with 0.3 membership value and normal with 0.6 membership value. For us to know all the membership value for a particular input variable, we will need equations that will map an input value to its corresponding membership value. |
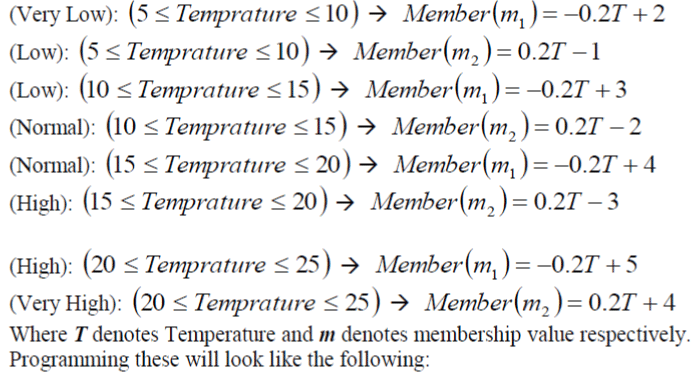
| A. EQUATION FOR TEMPERATURE |
| Note: The temperature ranges from5°C - 25°C. |
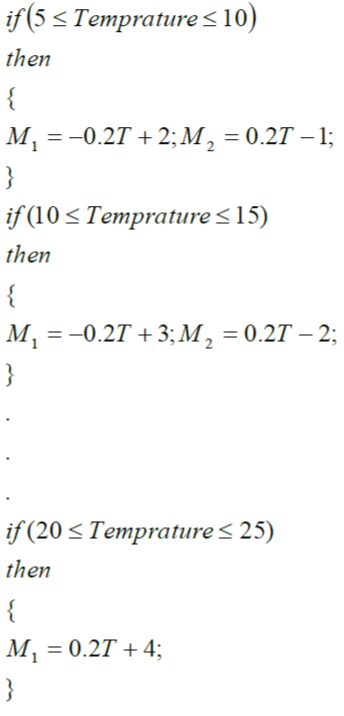
| The equations below produce the values of membership value for any temperature value. It is follow that in the diagram of the graph shown below, we have eight lines in the graph therefore we must formulate eight equations to implement the graph. Some of the linguistic variables (very low, low, normal, high and very high) might have the same temperature range but they will surely have different equations. |
 |
 |
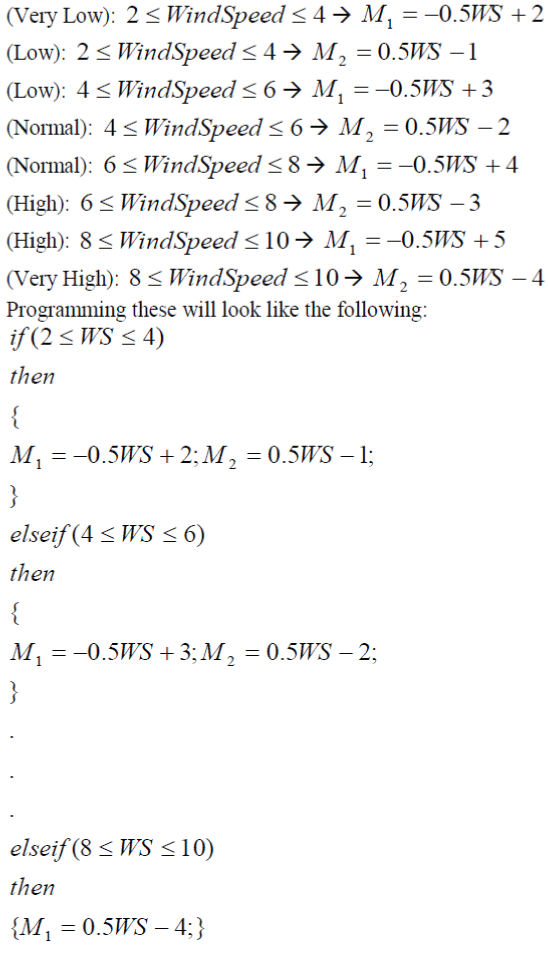
| B. EQUATIONS FOR WIND SPEED |
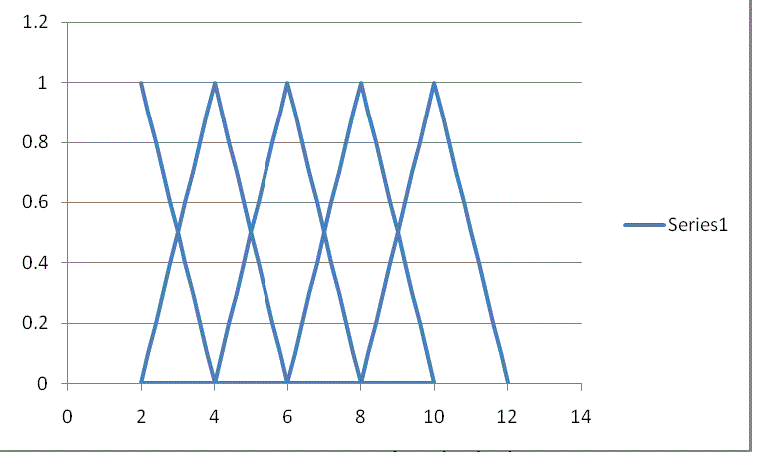
| The wind speed ranges from 2-10 Km/hr. |
| The equations below produce the values of membership value for any temperature value. It is follow that in the diagram of the graph shown below, we have eight lines in the graph therefore we must formulate eight equations to implement the graph. Some of the linguistic variables (very low, low, normal, high and very high) might have the same temperature range but they will surely have different equations. |
 |
THE OUTPUT VARIABLE
|
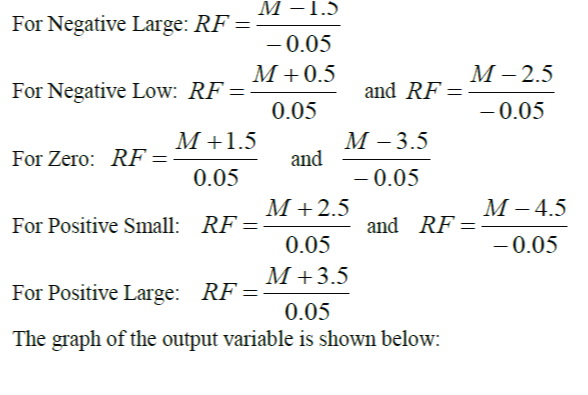
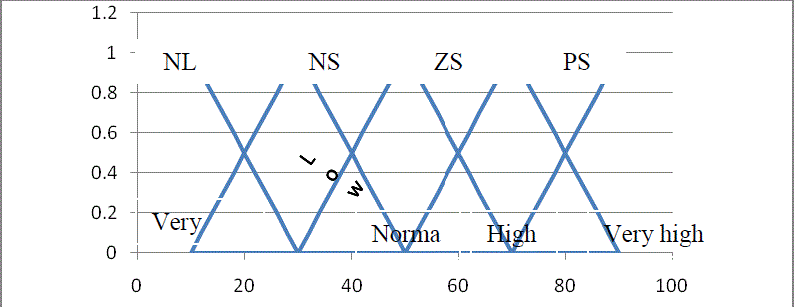
| The output variables depend on the category that the temperature and the wind speed falls in. They can either be of negative-large, negative-small, neutral (Zero), positive-small and positive large. The following equations show how we can get our final output (amount of rainfall) at different category of the output variable. |
 |
APPLICATION OF THE ALGORITHM
|
| Assuming that the temperature and the wind speed readings (which are factor that determines the amount of rainfall) of a day are12.5°C and 4km/hr respectively, the procedure or step that will be taken to know the amount of the rainfall is stated below: |
| 1) We are going to determine the group that each input falls in and their membership value for that group: |
| • For 12.5 °C temperature we can deduce from the graph or by using one of the equations the group that it falls in and the membership value for that group. From the graph the temperature is 0.5 member of low and 0.5 member of normal. From the equation, the temperature of 12.5 °C falls between 10 and 15, therefore the equation to calculate the membership will be -0.2T+3 for low and 0.2T-2 for normal. By putting the value of the temperature in both equations we will get 0.5 for both memberships. |
| • For 4km/hr wind speed we can also deduce from the graph or from one or two of the equations. The membership value will be 1 for normal alone. |
| 2) The next step is to determine how a particular value of temperature and wind speed will produce a particular value of amount of rainfall to be expected. |
| • The table below shows how the two input variable and the output value are related. The table was constructed using a data derive from United States department of Agriculture (USDA). The data consist of documented amount of rainfall for a particular year and the values of the temperature and wind speed. |
| The value of our temperature ? C? ? 12.5 shows that we can categorize our temperature to be normal (0.5) and low (0.5) and our wind speed value (4km/hr) is categorized as normal (1) only. |
| If (Temperature is normal [0.5] and Wind Speed is normal [1]) then Rainfall is normal If (Temperature is low [0.5] and Wind Speed is normal [1] then rainfall is low The if-then knowledge based stated above is derived from the table. We can see that we have two values for our rainfall (low and normal) but there fuzzy value (membership value) is taken from the minimum membership value between their temperature and wind speed. So for normal rainfall the membership value is 0.5 and the membership value for low rainfall too is 0.5 since that is the minimum membership values. |
| The next step is to calculate a quantifiable value of rainfall from the fuzzy set we got earlier. There are several methods for calculating a quantifiable value for fuzzy set but the one to be used in this project is called Centroid |
 |
| Therefore using the result above and our output rainfall graph with the formula given above we can predict the amount of rainfall as follow: |
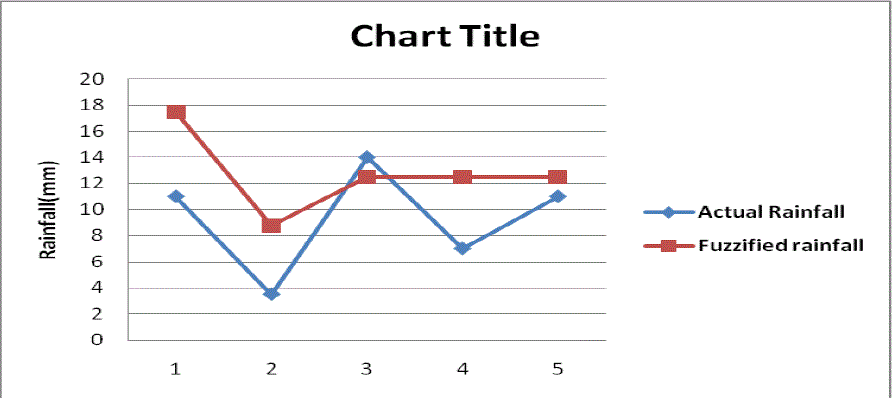
| (30*0.5 + 50*0.5) / 0.5+0.5 = (15+25)/1 = 40mm. Figure describes the visual representation with given data. |
| Note: ? ? k ? V is the membership value of each of the variable (Rainfall and Wind speed) in the deffuzification graph, in this case it is 0.5 for each variable. |
| V is the value of the variable itself in the deffuzification graph |
CONCLUSION
|
| The fact that effective planning leads to high performance does not call for any debate. In this context of study, knowledge of other variables like temperature and wind speed, it is easier to predict likelihood of rainfall and even the volume. This will help to better plan for a better resource utilization and prevention of associated disaster. It is however recommended that application of fuzzy logic is necessary in other domains since the two logic levels cannot solve many of such problems. |
Tables at a glance
|
 |
 |
| Table 1 |
Table 2 |
|
| |
Figures at a glance
|
 |
 |
 |
 |
| Figure 1 |
Figure 2 |
Figure 3 |
Figure 4 |
|
| |
References
|
- Hasan, M.,Tsegaye,T., Shi, X., Schaefer, G. and Taylor, G.,Model for predicting rainfall by fuzzy set theory using USDA scan data, 2008
- Jim, M., Application of fuzzy logic in operational meteorology, Carlifornia: Addison Wesley, Longman Inc., 2005
- Lyons, G., Defuzzification, Materials received on the internet, 1999
- Cirstea, M. N., Dinu, A., Khor, J. G. and McCormink, M., Neural and Fuzzy Logic Control of Daves and Power, 2002
- Jang, J.S.R., Sun, C.T. and Mizutani, E., Neuro-fuzzy and Soft Computing (A Computational Approach to Learning and Machine Intelligence), Prentice Hall, Inc., pp 1- 90, 1997
- Kevin, M. P. and Stephen Y., Fuzzy Control, Carlifornia: Addison Wesley Longman Inc., 1998
- Padhy, N.P., Artificial Intelligence and Intelligent systems, Oxford University Press, 2006
- Zadeh, L. A., A Fuzzy-Set-Theoretic Approach to the Compositionality of Meaning: Propositions, Disposition and Canonical Forms, Journal of Semantic, Vol. 11 , Issue. 3, 1983
- Zadeh, L. A., Fuzzy Sets and Information Granularity, Selected Papers by L.A. Zadeh; Pp 443-448, 1979
- Zadeh, L. A., The Concept of a Linguistic Variable and its Application to Approximate Reasoning-I, Information Science 8, Pp199-249, 1975
- Zadeh, L. A., The Concept of a Linguistic Variable and its Application to Approximate reasoning-II, Information Science 8, Pp 301-357, 1975a
- Zadeh, L. A., The Concept of a Linguistic Variable and its Application to Approximate reasoning-III, Information Science 9, Pp 48-80, 1975b
- Zadeh, L. A., A Computational Theory of Disposition, Information Science 9, 81-120, 1975c Zadeh, L. A., Fuzzy Sets, Information & Control, 8, Pp 338- 353, 1965
|