Keywords
|
| Photovoltaic, Buck-Boost, Maximum Power Point, Direct Current |
INTRODUCTION
|
| The Conventional sources of energy are rapidly depleting. Moreover the cost of energy is rising and therefore photovoltaic system is a promising alternative. They are abundant, pollution free, distributed throughout the earth and recyclable. The hindrance factor is its high installation cost and low conversion efficiency. Therefore our aim is to increase the efficiency and power output of the system. It is also required that constant voltage be supplied to the load irrespective of the variation in solar irradiance and temperature. PV arrays consist of parallel and series combination of PV cells that are used to generate electrical power depending upon the atmospheric conditions ( solar irradiation and temperature). So it is necessary to couple the PV array with a boost converter. Moreover our system is designed in such a way that with variation in load, the change in input voltage and power fed into the converter follows the open circuit characteristics of the PV array. Our system can be used to supply constant stepped up voltage to dc loads. Solar energy has been harnessed by humans since ancient times using a variety of technologies. |
| Solar radiation, along with secondary solar-powered resources such as wave and wind power, hydro-electricity and biomass, account for most of the available non-conventional type of energy on earth. Only a small fraction of the available solar energy is used [13]. Solar powered electrical generation relies on photovoltaic system and heat engines. Solar energy's uses are limited only by human creativity. To harvest the solar energy, the most common way is to use photo voltaic panels which will receive photon energy from sun and convert to electrical energy. Solar technologies are broadly classified as either passive solar or active solar depending on the way they detain, convert and distribute solar energy. Solar energy is abundantly available that has made it possible to harvest it and utilize it properly. Solar energy can be a standalone generating unit or can be a grid connected generating unit depending on the availability of a grid nearby. Thus it can be used to power rural areas where the availability of grids is very low. Another advantage of using solar energy is the portable operation whenever wherever necessary. |
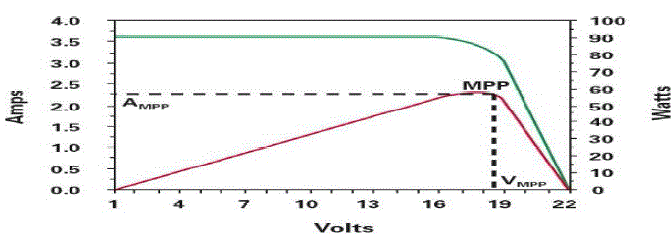
| But there are two major problems with PV generation systems. One is the low conversion efficiency of solar energy into electrical power and the other is the non linear characteristics of PV array which makes the electrical power generated vary with temperature and solar irradiation [2], [3]. In general there is only one point on P-V and V-I curve called the maximum power point. At this point only PV system operates with maximum efficiency and produces maximum output power. But this maximum power point is not known hence calculation models or search algorithms known as maximum power point tracking techniques are used to find the maximum power point. A common MPPT Technique is well known as power feedback method which measures the power of PV array and uses it as feedback variable. Based on power feedback there are three important tracking techniques used in PV systems. They are the Perturbation and Observation (P&O), the hill climbing method, the incremental conductance method. |
BLOCK DIAGRAM OF PV SYSTEM
|
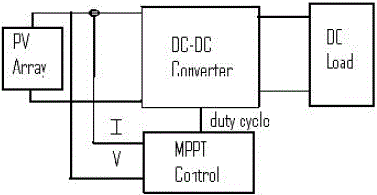
| The Fig. 1 shows PV system block diagram with MPPT Technique. It consists of PV array, Buck-Boost converter, MPPT block, and finally load. Combination of Series and parallel solar cells constitute PV array. Series connection of solar cells boost up the array voltage and parallel connection increases the current. In order to change the input resistance of the panel to match the load resistance (by varying the duty cycle), a DC to DC converter is required [4]. Buck-Boost converter is used to obtain more practical uses from solar panel. The input of buck boost converter is connected to PV array and output is connected to load. MPPT block receives voltage and current signals from PV array. The output of MPPT block is series of pulses. These pulses are given to the converter. Converter works based on these pulses to make the PV system operate at Maximum power point (MPP). |
Equivalent model
|
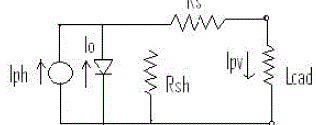
| The PV cell model is represented by equivalent electrical circuit shown in Fig. 2. The model contains a current source , diode, series resistance Rs, shunt resistance and load. The current source produces which depends on radiation. The output current is the difference between photo current and diode current. |
 |
| The equations of PV module are as follows: Current output of PV module is |
 |
| Output voltage of PV cell is |
 |
| The PV cell output voltage is a function of the photocurrent that mainly determined by load current depending on the solar irradiation level during the operation [5]. Module photo current: |
 |
| Module reverse saturation current: |
 |
| Module saturation current: |
 |
| Change of temperature and irradiation changes voltage and current outputs of PV array. Figures shows P-V and V-I characteristics of PV array for different temperature and solar irradiance conditions. |
BUCK-BOOST CONVERTER
|
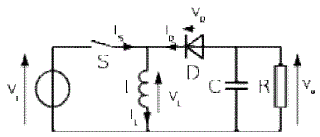
| The buck–boost converter is a type of DC-DC converter that has an output voltage magnitude that is either greater than or less than the input voltage magnitude. Two different topologies are called buck–boost converter. Both of them can produce a range of output voltages, from an output voltage much larger (in absolute magnitude) than the input voltage, down to almost zero. The output voltage is of the opposite polarity than the input. This is a switched-mode power supply with a similar circuit topology to the boost converter and the buck converter. The output voltage is adjustable based on the duty cycle of the switching transistor. One possible drawback of this converter is that the switch does not have a terminal at ground; this complicates the driving circuitry. Neither drawback is of any consequence if the power supply is isolated from the load circuit (if, for example, the supply is a battery) because the supply and diode polarity can simply be reversed. The switch can be on either the ground side or the supply side. The circuit diagram is shown in figure 4. |
| • while in the On-state, the input voltage source is directly connected to the inductor (L). This results in accumulating energy in L. In this stage, the capacitor supplies energy to the output load. |
| • while in the Off-state, the inductor is connected to the output load and capacitor, so energy is transferred from L to C and R. |
SIMULINK MODEL OF PV CELL WITH BUCK – BOOST CONVERTER
|
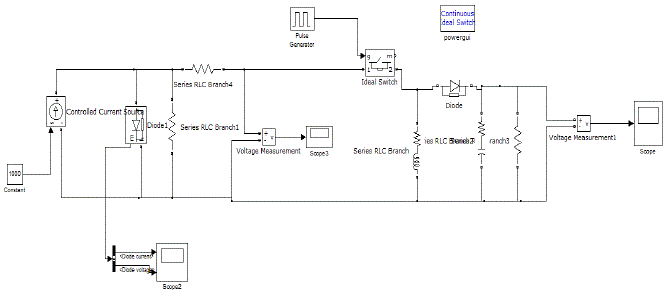
| A DC-DC converter is considered as a DC transformer that provides a loss less transfer of energy between different circuits at different voltage levels. When DC-DC conversion is needed there is also a need for control, need for higher efficiencies, and minimum output ripple voltage, this means increase and decrease voltages with control is needed. So, the switching frequency control, or PWM duty ratio control is required. In the proposed buck-boost converter, the input voltages from (5-20 V) are possible to produce constant (12 V) output which will be use in the design of solar home applications effectively. |
MPPT TECHNIQUE
|
| The efficiency of a solar cell is very low. In order to increase the efficiency, methods are to be undertaken to match the source and load properly. One such method is the Maximum Power Point Tracking (MPPT). This is a technique used to obtain the maximum possible power from a varying source. In photovoltaic systems the I-V curve is non-linear, thereby making it difficult to be used to power a certain load. This is done by utilizing a boost converter whose duty cycle is varied by using a mppt algorithm. Few of the many algorithms are listed below [3], [4], [5] and [8]. |
| A Buck-boost converter is used on the load side and a solar panel is used to power this converter. |
| There are many methods used for maximum power point tracking two are listed below: |
| • Perturb and Observe method |
| • Incremental Conductance method |
Perturb and Observe method
|
| This method is the most common. In this method very less number of sensors are utilized [5] and [6]. The operating voltage is sampled and the algorithm changes the operating voltage in the required direction and samplesdp dv. If dp dv is positive, then the algorithm increases the voltage value towards the MPP untildp dv is negative. This iteration is continued until the algorithm finally reaches the MPP. |
Incremental Conductance method
|
| This method uses the PV array's incremental conductance di dv to compute the sign ofdp dv di dv;. When di dvis equal and opposite to the value of I/V (where dp dvdi dv;=0) the algorithm knows that the maximum power point is reached and thus it terminates and returns the corresponding value of operating voltage for MPP. |
| The First two are the most widely used methods for maximum power point tracking. The advantage of P&O algorithm is simple and easy to be implemented, especially using the low cost micro controller system. However, the main drawback of the algorithm is that it oscillates around the maximum power point, due the perturbing process to find the maximum power point. |
| Flow chart for perturb & observe: The Perturb and Observe (P&O) algorithm operates perturb the PV voltage periodically by varying the duty cycle, and observe the PV power to increase or decrease PV voltage in the next cycle. If the perturbation voltage produces an increase of the power, then the direction or slope of perturbation voltage (duty cycle) is the same as the previous cycle. On the contrary the perturbation voltage produces a decrease of the power, then the direction or slope of perturbation voltage (duty cycle) is the opposite from the previous cycle. |
RESULTS & DISCUSSION
|
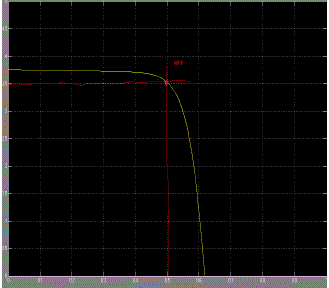
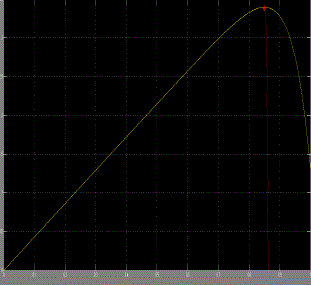
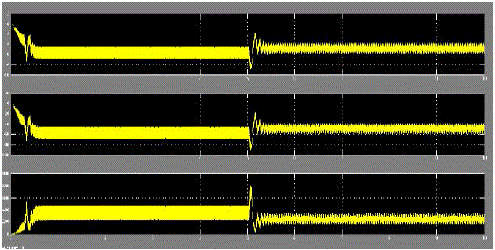
| The current-voltage & power-voltage characteristics of the PV cell obtained are shown in figure 8 & 9 respectively. |
| From Figure 9 it is observed that |
| At T=50 degree and S=400 w/ m² |
| I= 10Ampere, V=76.5 volt and P=712 watt |
| At T=50 degree and S=200 w/ m² |
| I=-3.8 Ampere, V=-38 volt and P= 350 watt |
CONCLUSION
|
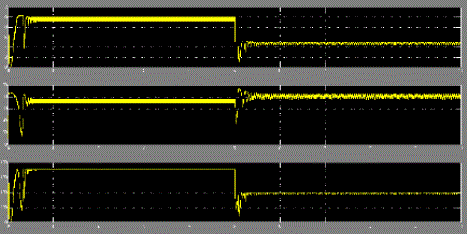
| The buck boost converter is modeled using equation model approach, rather than circuit model approach. By developing model using equation modeling, the model could be modified or entendex easily. To verify the developed equation model, the comparison to the existing circuilt model is done. The experiment result shows that the developed model is usited to the existing one. Moreover, a MPPT control model (P&O algorithm) is modeled and tested using several experiment data. The experiment results show that the overall model behaves like the real situation. Further, the properties of P&O algorithm such as the effect of the step value of perturbing duty cycle and the oscillation problem are well simulated. In future, the different MPPT methods will be evaluated. Furthermore, the MPPT algorithm will be applied to the other renewable energy, such as the wind energy system. The various waveforms were obtained by using the plot mechanism in MATLAB. |
Figures at a glance
|
 |
 |
 |
 |
 |
| Figure 1 |
Figure 2 |
Figure 3 |
Figure 4 |
Figure 5 |
 |
 |
 |
 |
 |
| Figure 6 |
Figure 7 |
Figure 8 |
Figure 9 |
Figure 10 |
|
References
|
- M. G. Villalva, j. R. Gazoli, e. Ruppert f, "comprehensive approach to modeling and simulation of photovoltaic arrays", ieee transactions on power electronics, 2009 vol. 25, no. 5, pp. 1198--1208, issn 0885-8993.
- M. G. Villalva, j. R. Gazoli, e. Ruppert f, "modeling and circuit-based simulation of photovoltaic arrays", brazilian journal of power electronics, 2009 vol. 14, no. 1, pp. 35--45, issn 1414-8862.
- Mummadiveerachary, "control of ti-sepic converter for optimal utilization of pv power", iicpe, 2010 New Delhi.
- R. Sridhar, dr. Jeevananathan, n. Thamizhselvan, saikatbanerjee, “modeling of pv array and performance enhancement by mppt algorithm", international journal of computer applications (0975 – 8887) volume 7– no.5, september 2010.
- Hairulnissahzainudin, saadmekhilef, “comparison study of maximum power point tracker techniques for pv systems”, cairo university, egypt,december 19-21, 2010, paper id 278.
- Katherine a. Kim and philip t. Krein, “photovoltaic converter module configurations for maximum power point operation”, university of Illinois urbana-champaignurbana, il 61801 usa.
- Huan-liangtsai, ci-siangtu, and yi-jiesu, “development of generalized photovoltaic model using matlab/simulink”, proceedings of the worldcongress on engineering and computer science 2008 wcecs 2008, october 22 - 24, 2008, san francisco, usa.
- Elgendy m a, zahawi b, atkinson d j. Assesment of perturb and observe mppt algorithm implementation techniques for pv pumping applications.Ieee transactions on sustainable energy. 2012; 3(1): 21-33.
- Rashid m m, muhida r, alam a h m z, ullah h, kasemi b. Development of economical maximum power point tracking system for solar cell.Australian journal of basic and applied sciences. 2011:5(5): 700-713.
- Wenhao c, hui r. Research on grid-connected photovoltaic system based on improved algorithm. Przegladelektrotechniczny(electrical review).2012; 3b: 22-25.
- Takun p, kaitwanidvilai s, jettanasen c. Maximum power point tracking using fuzzy logic control for photovoltaics systems. Proceedings ofinternational multiconference of engineers and computer scientists.Hongkong. 2011.
- Al nabulsi a, dhaouadi r. Fuzzy logic controller based perturb and observe maximum power point tracking. Proceedings of internationalconference on renewable energies and power quality. Spain. 2012.
- Putri r i, rifai m. Maximum power point tracking control for photovoltaic system using neural fuzzy. International journal of computer andelectrical engineering. 2012; 4(1): 75-81.
- Sedaghati f, nahavandi a, badamchizadeh m a, ghaemi s, fallah m a. Pv maximum power-point tracking by using artificial neural network.Mathematical problems in engineering.2012; vol. 2012, article id 506709: 1-10.
- Kalirasu a, dash s s. Modeling and simulation of closed loop controlled buck converter for solar installation. International journal of computerand electrical engineering. 2011; 3(2): 206-210.
- Pandiarajan n, ramaprabha r, ranganath m. Application of circuit model for photovoltaic energy conversion system. International journal ofphotoenergy.2012; vol. 2012, article id 410401: 1-14.
- Samosira s, sutikno t, yatim a b m. Dynamic evolution control for fuel cell dc-dc converter. Telkomnika. 2011: 9(1): 183-190.
- G r walker. Evaluating mppt converter topologies using a matlabpv model. Journal of electrical & electronics engineerin.Australia. 2001;21(1): 49-56.
- J v gragger, a haumer, m einhorn. Averaged model of a buck converter for efficiency analysis.Engineering letter.2010; 18(1).
- J a jiang, t l huang, y t hsiao, c h chen. Maximum power tracking for photovoltaic power systems.Tamkang journal of science and engineering. 2005; 8(2): 147-153.
|