Keywords
|
| PVT, Solar PV, Solar Cell, Fill Factor |
INTRODUCTION
|
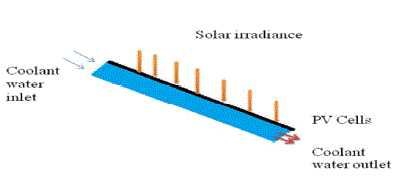
| Various forms of renewable energy depend primarily on incoming solar radiation, which totals about 3.8 million EJ per year. To harness the available solar energy resource effectively, the integrated photovoltaic combined thermal systems (PV/T) are especially attractive because the absorbed solar radiation is converted into electricity and heat which can be utilized simultaneously. |
| The main component of a photovoltaic/thermal (PV/T) system is a Photovoltaic/Thermal (PV/T) module, which is a combination of photovoltaic panel integrated to a solar thermal collector, forming one device that converts solar radiation into electricity and heat concurrently. PV/T modules have the ability to generate more energy per unit surface area than side by side PV panels and solar thermal collectors, at a lower production and installation cost. Because of its high efficiency per unit surface area, PV/T is particularly well suited for applications with both heat and power demand and with limited roof space available. |
| Moreover, PV/T modules share the aesthetic advantage of PV. The incorporation of PV modules as part of the building envelope is a viable way of utilizing PV systems due to the combined provision of electrical power, heated air or hot water for use within the building. Large surfaces in the facade and roof of buildings are available and suitable for incorporating PV modules in them. Such incorporation has been referred as building integrated PV (BIPV) technology and accounts for a significant portion in urban applications of PV systems in buildings. The sun is the ultimate source for most of our renewable energy supplies and the direct use of solar radiation has a deep appeal to engineer and architect alike. Solar thermal collectors are used to convert solar radiation to thermal energy. In a thermal collector, a liquid or gas is heated and pumped, or allowed to flow through thermal convection, around a circuit and used for domestic or industrial heating. Photovoltaic cells are used to direct conversion of sunlight to electricity. The principal function of a PV cell is simple-silicon wafers convert the solar energy falling on them directly into electricity. |
| The most significant difference between solar thermal and photovoltaic system is that solar thermal systems produce heat and photovoltaic systems produce electricity. There are several methods to gather the solar energy and in a PV system most of the solar radiation that is absorbed is not converted into electricity. PV cells utilize a small fraction of the incident solar radiation to produce electricity and the remainder is turned mainly into waste heat in the cells, causing the increase of PV cell temperature hence the efficiency of the module drops. Cooling either by natural or forced circulation can reduce this PV cell temperature. An alternative to the PV cell is to use Photovoltaic thermal system (PV/T), where PV cell is coupled with heat extraction devices. |
| The simultaneous cooling of the PV module maintains electrical efficiency at satisfactory level and thus the PV/T collector offers a better way of utilizing solar energy due to the increased overall efficiency. |
LITERATURE REVIEW
|
| Norton b et al at 1991 suggested that, during some severe cold days in winter, anti-freeze liquid can be used as a coolant in solar pvt. But it cannot be used in summer because the heat transfer rate in liquid is less, so the performance of the anti-freeze liquid is slightly less in summer. |
| Bergene t et al at 1995 is proposed the detailed physical model of a flat-plate pvt/water (pvt/w) collector system for performance evaluation. The fin-width to tube-diameter ratio was investigated and the total efficiency was found in the range of 60-80%. b. J. Huang et al at 2000 suggested that,a commercial polycrystalline pv cells is used for making a pv/t collector. The performance of a pv/t collector can be improved if the heat-collecting plate, the pv cells and the glass cover are directly packed together to form a glazed collector. So by integrating all the parts into the single, the manufacturing cost of the pv/t collector and the system cost of the integrated photovoltaic thermal system (ipvts) can also be reduced. |
| H.a. Zondaga et al at 2003 to obtain a clearer view on the pv/t overall efficiency, nine different designs were evaluated. In that, the channel-below-transparent-pv design gives the best efficiency. k. Touafek et al at 2011 is proposed a new pvt hybrid collector on the basis of a new approach of design, which aim to increase the energy effectiveness of electric and thermal conversion with the lowest cost compared to the already existing conventional hybrid collector |
| B. J. Brinkworth et al 2006 works on building integrated air-cooled photovoltaic include the studies on the multioperational ventilated pv with solar air collectors and the ventilated building pv facades, and the design procedure for cooling air aimed to minimize efficiency loss. Ming-tse kuo address the issues that occur during the prolonged operation of gaas concentrator photovoltaics under sunlight, which results in a continuous increase in surface temperature. This temperature increase reduces photovoltaic power generation efficiency and/or damages the solar cells and other aspects of the power generation system. Therefore, a water circulation system was used to cool the heated surface of the solar cells, and heated water was stored in a storage tank. This approach maintained the power generation efficiency of photovoltaics by cooling the solar cells, which prevented decreases in power generation efficiency caused by rapid temperature increases in photovoltaic systems. The cooling system also reduced the amount of damage to solar cells and the power generation system due to an increase in temperature. Louis-michel collin et al at 2013 a methodology and test platform were developed to measure the thermal performance of a receiver as part of a cooling module for cpv cells or high-power microelectronics. Rajendra singh et al at 2013 analyzed the relative difference in the efficiency of an individual solar cell and the efficiency of a pv module comprising solar cells of the same type.monocrystalline silicon solar cells exhibit the smallest relative difference. Multicrystalline-silicon solar cells also attractive, going by the chosen metric. Tsung-lin chou et al at 2012 suggested to reduce the cost of hcpv module, the lower thermal conductivity material of solder paste and substrate is considered. |
PROBLEM IDENTIFICATION
|
| The issues that occur during the prolonged operation of solar cell concentrator photovoltaics under sunlight, which results in a continuous increase in surface temperature. This temperature increase reduces photovoltaic power generation efficiency and/or damages the solar cells and other aspects of the power generation system. Because of the problem of loss of electricity as a result of heat buildup most installers make sure it is possible for air to flow above and below the solar panels to help keep them cool. Therefore, a water circulation system was used to cool the heated surface of the solar cells, and heated water was stored in a storage tank. This approach maintained the power generation efficiency of photovoltaics by cooling the solar cells, which prevented decreases in power generation efficiency caused by rapid temperature increases in photovoltaic systems. The cooling system also reduced the amount of damage to solar cells and the power generation system due to an increase in temperature. The power loss due to temperature is also dependent on the type of solar panel being used. Typically, solar panels based on monocrystalline and polycrystalline solar cells will have a temperature coefficient in the 0.44% to 50% range. Sun power (Monocrystalline) does the best in this regard with a temperature coefficient of 0.38%. It is also the most efficient commercially available solar panel making it an excellent choice for high temperature areas. |
SIMULATION MODELLING FOR PROPOSED SYSTEM
|
| Short Circuit Current: |
 |
| Open Circuit Voltage: |
 |
| Where, Vt= (mkt/q) |
| T=absolute temperature |
| Maximum Power Point: |
 |
| Maximum Efficiency: |
 |
| Where, Ga is the ambient temperature |
| A is the cell area |
| Fill Factor |
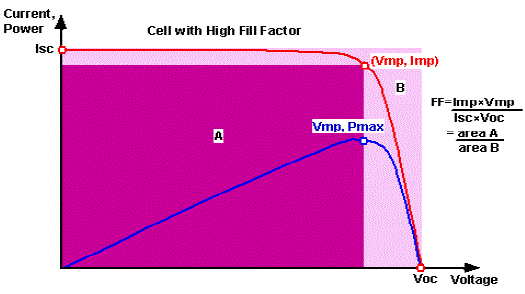
| The short-circuit current and the open-circuit voltage are the maximum current and voltage respectively from a solar cell. However, at both of these operating points, the power from the solar cell is zero. The "fill factor", more commonly known by its abbreviation "FF", is a parameter which, in conjunction with Voc and Isc, determines the maximum power from a solar cell. |
| The FF is defined as the ratio of the maximum power from the solar cell to the product of Voc and Isc. As FF is a measure of the "squareness" of the IV curve, a solar cell with a higher voltage has a larger possible FF since the "rounded" portion of the IV curve takes up less area. The maximum theoretical FF from a solar cell can be determined by differentiating the power from a solar cell with respect to voltage and finding where this is equal to zero. |
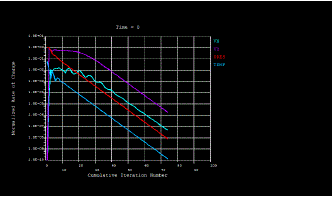
| Figure 5 & 6 indicates the output of the temperature distribution from pv panel to to the working fluid it develops from the ANYSY software and the above figure indicates the iteration the temperature distribution. |
HARDWARE DISCRPTION AND RESULTS AND DISCUSSION
|
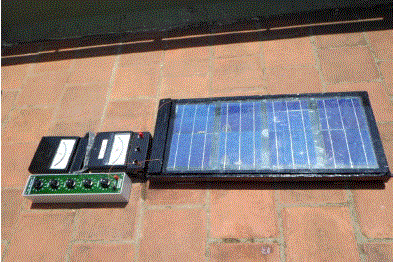
| In this fig 5.9 the solar cells can be arranged in series by connecting all positive and negative terminals. The total number of cells are in this panel is 8. So the output voltage is 3.2 v. The temperature is decreased due to cooling system under the solar cells there by the efficiency also increased. Length of panel= 80.5 cm,Breadth of panel=38 cm, Height of panel=5 cm. |
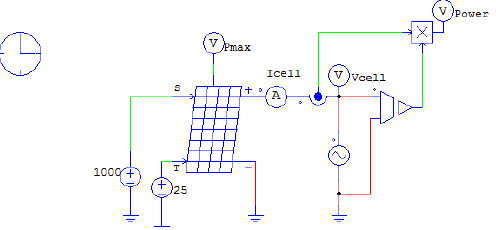
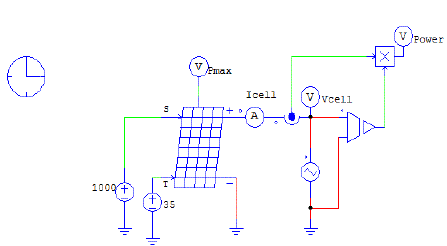
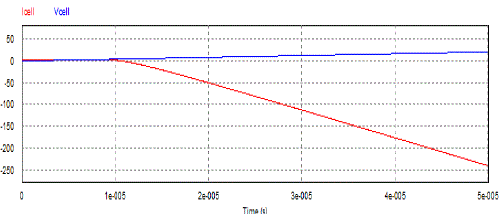
| From this project we analyse that the overall efficiency of PVT is higher than that of PV system. We made regular analysis of both Solar PV and PVT for a time period of one month at various time intervals. From those readings we can calculate the VI Characteristics, Power produced in the cell, Efficiency. Similarly, we have proved the increase in efficiency of solar pvt by using the software PSIM and ANSYS. From the PSIM software we could observe that if the temperature of the cell increases, then the power developed by the cell decreases. In order to overcome this, we are placing a cooling system below the PV cell which helps in decreasing the temperature of the cell and thereby increasing the overall efficiency of the pv system. In ANSYS software, we have shown the heat transfer in the cell from the glass plate i.e. from the upper surface of the Solar cell to the lower surface of the cell. |
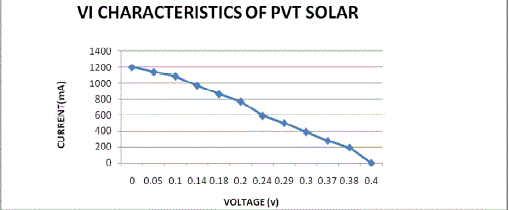
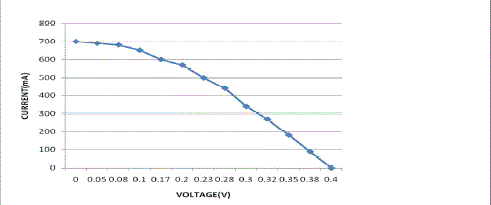
| We are taking reading for both single cell and Solar panel. The output single cell voltage is 0.4V. The solar Panel consists of Eight cell connected in series. so, the Output voltage of Solar panel is 3.2V. Let us discuss the VI characteristics |
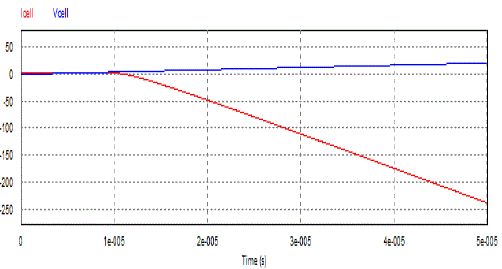
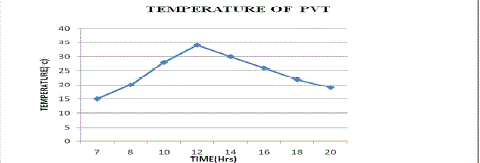
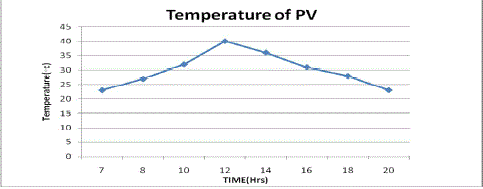
| From the above figure indicates the results and discussion of PVT fig 9 indicates the VI characteristics of the PVT and Figure 10 indicates the VI characteristics of the PV if we verify the two graphs we can understood the maximum power output increased because of the temperature reduction in the solar cell. And the figure 11 & 12 indicates the temperature of the cell for normal pv system and proposed PVT system here it indicates the temperature reduce upto 3degree Celsius which improve the efficiency of the solar cell and the increased in the output of the System. |
CONCLUSION
|
| The combination of the photovoltaic module with a thermal system to form the photovoltaic thermal (PVT) hybrid collector, which will generate electricity and heat, at the same time. By providing cooling system in PVT the efficiency of the entire system is increased by decreasing the temperature of system when compared to that of PV system. Thus the analysis of the proposed photovoltaic-thermal (PV/T) solar panel design was performed using PSIM and ANSYS software. |
Figures at a glance
|
 |
 |
 |
 |
| Figure 1 |
Figure 2 |
Figure 3 |
Figure 4 |
 |
 |
 |
 |
| Figure 5 |
Figure 6 |
Figure 7 |
Figure 8 |
 |
 |
 |
 |
| Figure 9 |
Figure 10 |
Figure 11 |
Figure 12 |
|
References
|
- K.Touafek, M. Haddadi, And A. Malek” Modeling And Experimental Validation Of A New Hybrid Photovoltaic Thermal Collector” IeeeTransactions On Energy Conversion, Vol. 26, No. 1, March 2011.
- Ming-TseKuo,Wen-Yi Lo: “A Combination Of Concentrator Photovoltaics And Water Cooling System To Improve Solar EnergyUtilization”,Ieee Transactions On Industry Applications 2013.
- Louis-Michel Collin, Osvaldo J. Arenas, Richard Arès, And Luc G. Fréchette, Member, Ieee:” Thermal Resistance And Heat SpreadingCharacterization Platform For Concentrated Photovoltaic Cell Receivers” Ieee Transactions On Omponents, Packaging AndManufacturing Technology, Vol. 3, No. 10, October 2013.
- Norton B, Edmonds Jej. Aqueous Propylene–Glycol Concentrations For The Freeze Protection Of Thermosyphon Solar Energy Water Heaters.Sol Energy 1991;47:375–82.
- Bergene T, LovikOm. Model Calculations On A Flat-Plate Solar Heat Collector With Integrated Solar Cells. Sol Energy 1995;55:453–62.
- B. J. Huang, T. H. Lin, W. C. Hung & F. S. Sun, Performance Evaluation Of Solar Photovoltaic /Thermal Systems, Solar Energy, Page:443-449 , 2000
|