Keywords
|
| Voltage control, incremental conductance, constant voltage, maximum power point tracking (MPPT), photovoltaic (PV), three-level inverter. |
INTRODUCTION
|
| One silicon photovoltaic (PV) cell outputs a voltage of approximately 0.5V. To produce a specific output voltage the solar cells are connected in series. They are electrically connected and mechanically mounted in a frame to form a module or panel. When panels are wired in series or/and parallel combinations, they form an array. The solar panel is also equipped with necessary protective devices, such as bypass and blocking diodes, either to protect cells when the temperature rises under shady or sunny conditions or prevent the solar panel from reverse current flowing back during the night. |
| PV solar cells rely on the process known as the “photovoltaic effect” to produce electricity. This phenomenon happens when the energy produced by the photons from sunlight on the exposed solar cell is greater than the bandenergy of the semiconductor. Thus, electron-hole pairs are created by the breakage and loss of the atoms in the material. The existing electric field of p-n junction of solar cells separate the created charge carriers in the depletion region and lead to a forward bias of the p-n junction, so that a voltage potential is built up. This will cause a current proportional to the incident radiation to flow through the load once it is connected to the cell. |
| The electrical characteristics of PV module depends on the intensity of solar radiation and operating temperature. Increased radiation with reduced temperature results in higher module output [12]. The aim of the tracker is to derive maximum power always against the variations in sunlight, atmosphere, local surface reflectivity, and temperature.Since a PV array is an expensive system to build, and the cost of electricity from the PV array systems is more expensive compared to the price of electricity from the utility grid, the user of such an expensive system naturally wants to use all of the available output power. A near sinusoidal current as well as voltage with minimum harmonic distortion under all operating conditions [2], [3]. |
II .SYSTEM CONFIGURATION
|
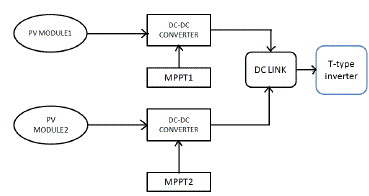
| The system configuration for the topic is as shown figure 2. Here the PV array is a combination of series and parallel solar cells. This array develops the power from the solar energy directly and it will be changes by depending up on the temperature and solar irradiances. [1], [2]. |
| So we are controlling this to maintain maximum power at output side we are boosting the voltage by controlling the current of array with the use of PI controller. By depending upon the boost converter output voltage this AC voltage may be changes and finally it connects to T-type three level inverter(Converts DC to AC). |
III.PV CELL MODULE
|
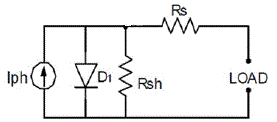
| The single exponential equation (1) which models a PV cell is derived from the physics of the PN junction and is generally accepted as the characteristic behavior of the cell. |
 |
| Where, |
| Iph is the short circuit current |
| Is is the reverse saturation current of diode (A), |
| q is the electron charge (1.602×10 -19 C), |
| V is the voltage across the diode (V), |
| K is the Boltzmann’s constant (1.381×10 -23 J/K), |
| T is the junction temperature in Kelvin (K). |
| N Ideality factor of the diode |
| Rs is the series resistance of diode, |
| Rsh is the shunt resistance of diode. |
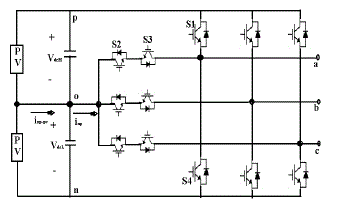
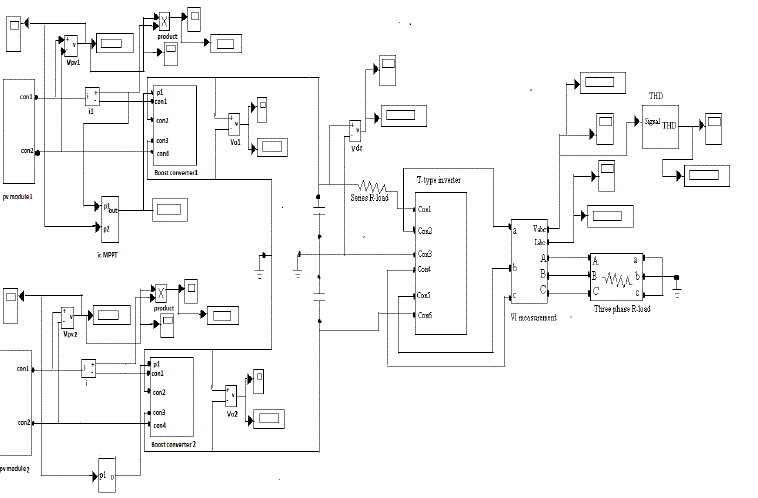
| Recently, three-level inverters have been discussed for implementing a mid point PV inverter, as the conversion efficiency can be increased by reducing switching losses and the output harmonic property can be improved. In particular, the T-type three-level inverter shown in Fig. 2. It is preferred because conduction losses are further minimized by reducing the average number of switch modules on the current paths. The connection in Fig. 2, separate MPPTs on the PV modules become possible without an increment in the conversion stage. |
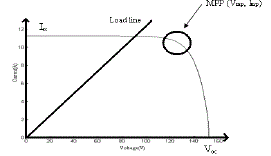
| The amount of power generated by a PV generator depends on the operating voltage of the PV array. The maximum power operating point changes with irradiation level and temperature. The PV system operates at its highest efficiency at the maximum power point. In order to increase the efficiency, MPPT controllers are used. |
III. MPPT TECHNIQUES
|
| MPPT techniques are commonly used to find out the voltage and current at which maximum power point of a PV module occurs. Maximum power point of a particular solar photovoltaic module lies about 0.75 times which is greater than its open circuit voltage. Maximum amount of power that can be extracted from a panel which depends on certain factors like SOLAR. |
| IRRADINCE: It is the measure of how much solar power that we have obtained from a particular area and also it depends on certain natural factors[8]. |
| TEMPERATURE: It mainly depends on panel operating point at which maximum power is obtained. |
| There are different techniques used to track the maximum power point. The choice of the algorithm depends on the time complexity of the algorithm to track the Maximum power[9],[10]. Implementation cost, Simplicity, Ability to track maximum power under varying atmospheric conditions. Some techniques are useful. Among these the most commonly used MPPT algorithms are |
| A.Incremental conductance algorithm |
| B.Constant voltage control algorithm |
A. INCREMENTAL CONDUCTANCE METHOD
|
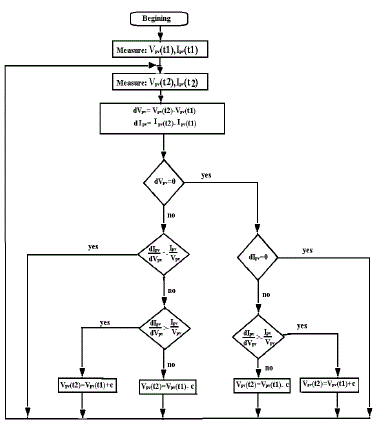
| Incremental conductance method generally uses voltage and current sensors to detect the output voltage and current of the PV array hence the complexity of the algorithm increases. The slope of the PV curve is zero at Maximum Power Point. The left hand side which represents the instantaneous conductance of the solar panel. When this instantaneous conductance equals the conductance of the solar PV module then MPP is reached. Here we are sensing both the voltage and current simultaneously. Hence the error due to change in irradiance is eliminated completely so there is no multiple local points at MPP. |
B.CONSTANT VOLTAGE METHOD
|
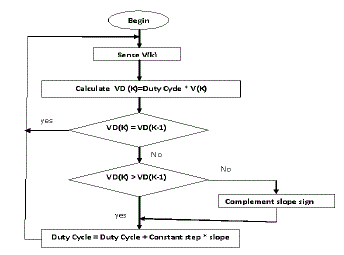
| This method makes use of the fact that the ratio of maximum power point voltage to the open circuit voltage is often close to a constant value, with 0.76 being a common estimate. One problem with this method arises from the fact that it requires momentarily setting the PV array current to 0 to measure the array's open circuit voltage. The array's operating voltage is then set to (for example) 76% of this measured value. But during the time the array is disconnected, the available energy is wasted. It has also been found that while 76% of the open circuit voltage is often a very good approximation, it does not always coincide with the maximum power point. Its main advantage is that it is relatively simple to implement and thus usually less expensive. |
IV.T- TYPE INVERTER
|
| The DC-link voltage of a three- level inverter is divided by capacitors in series. Therefore, the neutral-point voltage may be unbalanced, which can lead to failure of the switching devices and an increase in the total harmonic distortion (THD) of the output current because low- order harmonics will appear in the output voltage of a grid connected system. For maximize the performance of a three-level inverter the neutral-point potential of the DC-link capacitors should be kept balanced. |
V.SIMULATION RESULTS
|
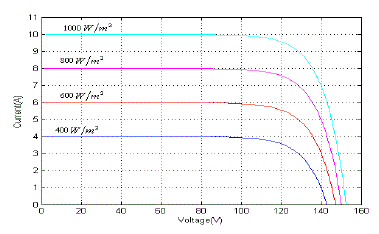
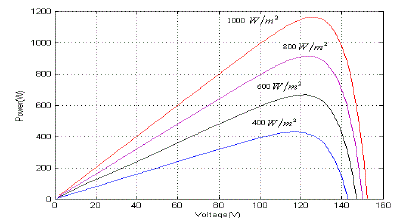
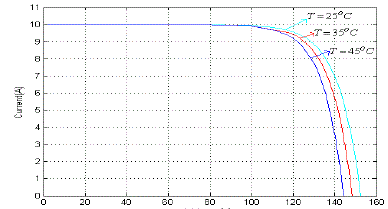
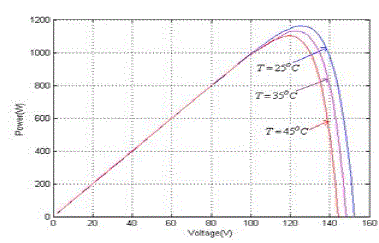
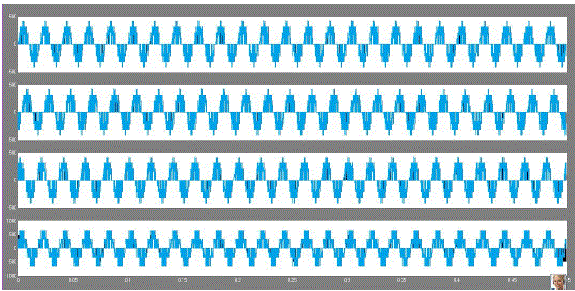
| The converter circuit topology is designed to be compatible with a given load to achieve maximum power transfer from the solar arrays. The boost converter output which is giving to input to five-level H-bridge multilevel inverter. We observed that the designed Five-level H-Bridge cascade multilevel inverter successfully followed the variations of solar irradiation and temperatures. Here the power is maintaining maximum value and similarly the boost converter boosting the voltage under the control of the MPPT. By this, PV array, boost converter output voltages are converted to AC voltages which are supplied to T-type inverter.Photovoltaic array V-I and P-V characteristics are obtained by considering the varying temperature and the varying irradiance conditions shown in Fig. 7,8, 9 and 10. |
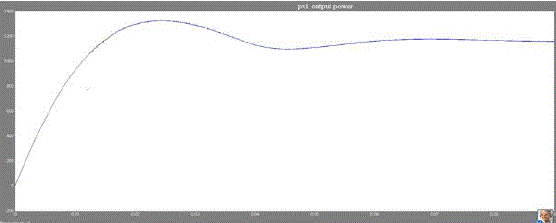
| To better assess the overall performance of the current PV Simulation System, the combined PV model is subjected to rapid and slow changes in solar irradiance successively. Using two different MPPT algorithms, the PV system is firstly subjected to abrupt or rapid irradiance changes to display the behaviour of both MPPT algorithms used in the Simulink model of the PV system during the passing of clouds. The resulting boost output voltage and power waveforms can be seen in the subsequent figures. |
| The flowchart of the incremental conductance and constant voltage MPPT algorithm has been implemented in Matlab/ Simulink. The modelling diagram of figure represents the whole PV system with MPPT along with the boost converter has been implemented in the Matlab/ simulink. |
VI. CONCLUSION
|
| In this paper, two MPPT control algorithms, constant voltage ‘CV’ and incremental conductance ‘ Inccond ’, are discussed. Based on the results presented, the following conclusions may be stated: |
| i)The ‘CV’ algorithm is easy to implement and sometime combined together with other MPPT techniques. |
| ii)In low solar irradiance conditions, the ‘CV’ algorithm is used. |
| iii)The ‘ Inccond ’ algorithm requires two measurements: a measurement of the voltage and a measurement of the current. |
| iv)Under rapidly changing atmospheric conditions, the ‘ Inccond ’ is adopted. |
| v)The two model MPPT control algorithm combines ‘CV’ and Inccond method is presented. |
| The three-level inverter has some advantages as a grid connected PV inverter because it has one more voltage level than the two-level inverter. In combination with this advantage, the control method can contribute to the enhancement of the power generation from PV modules under given shading conditions, as separate MPPTs are possible in the proposed control system. |
Tables at a glance
|
 |
 |
| Table 1 |
Table 2 |
|
| |
Figures at a glance
|
 |
 |
 |
 |
 |
| Figure 1 |
Figure 2 |
Figure 3 |
Figure 4 |
Figure 5 |
 |
 |
 |
 |
 |
| Figure 6 |
Figure 7 |
Figure 8 |
Figure 9 |
Figure 10 |
 |
 |
 |
 |
| Figure 11 |
Figure 12 |
Figure 13 |
Figure 14 |
|
| |
References
|
- M. Garcia, J. A. Vera, L. Marroyo, E. Lorenzo, and M. Perez, “Solartracking PV plants in navarra: A 10 mw assessment,” ProgPhotovoltaics:Res. Appl., vol. 17, no. 5, pp. 337–346, Aug. 2009.
- T. Ito, H. Miyata, M. Taniguchi, T. Aihara, N. Uchiyama, and H. Konish, “Harmonic current reduction control for grid-connected PV generation systems,” in Proc. Int. Power Electron. Conf., Jun. 21– 24, 2010, pp. 1695– 1700.
- R. Inzunza, T. Sumiya, Y. Fujii, and E. Ikawa, “Parallel connection of grid-connected LCL inverters for MW-scaled photovoltaic systems,” in Proc. Int. Power Electron. Conf., Jun. 21–24, 2010, pp. 1988–1993.
- S. B. Kjaer, J. K. Pedersen, and F. Blaabjerg, “A review of single- phase grid-connected inverters for photovoltaic modules,” IEEE Trans. Ind. Appl., vol. 41, no. 5, pp. 1292–1306, Sep./Oct. 2005.
- M. Garcia, J. M. Maruri, L. Marroyo, E. Lorenzo, and M. Perez, “Partial shadowing, MPPT performance and inverter configurations: Observations at tracking PV plants,” Prog. Photovoltaics: Res. Appl., vol. 16, no. 6, pp. 529–536, Sep. 2008.
- S.Kouro, K. Asfaw, R. Goldman, R. Snow,B.Wu, and J.Rodriguez,“NPCmultilevelmultistring topology for large scale grid connected photovoltaic systems,” in Proc. IEEE Int. Symp. Power Electron, Distrib. Gener. Syst., Jun. 16–18, 2010, pp. 400–405.
- M. Schweizer and J. W. Kolar, “High efficiency drive system with 3- level t-type inverter,” in Proc. Eur. Conf. Power Electron. Appl., Aug. 30–Sep.1, 2011, pp. 1–10.
- N. Celanovic and D. Boroyevich, “A comprehensive study of neutralpoint voltage balancing problem in three-level neutral-point- clampedvoltage source pwm inverters,” IEEE Trans. Power Electron., vol. 15, no. 2, pp. 242–249, Mar. 2000.
- J. Pou, R. Pindado, and D. Boroyevich, “Voltage-balance limits in fourlevel diode-clamped converters with passive front ends,” IEEE Trans. Ind. Electron., vol. 52, no. 1, pp. 190–196, Feb. 2005.
- J. Pou, J. Zaragoza, S. Ceballos, M. Saeedifard, and D. Boroyevich, “A carrier-based PWM strategy with zero-sequence voltage injection for a three-level neutral-point-clamped converter,” IEEE Trans. Power Electron., vol. 27, no. 2, pp. 642–651, Feb. 2012.
|