INTRODUCTION
|
| In Deregulated electricity markets, market power and imbalances in the supply demand associated with the marginal cost of the last unit dispatched have resulted in large of the fluctuations in wholesale electricity prices [1]. In many of the existing electricity markets, only generation companies (GenCos) can respond to the price signals through supply-side offers to the independent system and/or market operator (ISO). The majority of consumers in deregulated markets have contracts with load aggregators or load serving entities who, in turn, submit demand bids to the market operator. If the contract is a pass through contract, there is no incentive for the load aggregator to provide a mechanism for consumers to respond to prices. On the other hand, if it is a fixed price contract, consumers do not see the market prices and will not respond to price signals. Moreover, because most consumers do not have access to hourly or daily electricity price information, their responses to price changes may lag behind[8]. |
| Ant Colony Optimization (ACO) is one of metaheuristic and evolutionary approaches to find the optimal solutions of the combinatorial or binary search problems. ACO was first developed by Dorigo et al. In ACO, artificial ants search for good solutions in a cooperative way. Artificial ants move randomly along paths and deposit chemical substance trails, called pheromone, on the ground when they move, then collect and store information in pheromone trails. This pheromone trails motivates them to follow the path and can choose the shortest path in their movement. The ACO method has been researched in various aspects and successfully applied to the various optimization problems. |
| There has been considerable research on consumer response to electricity prices. In addition, efforts have been under taken recently to model and simulate the price elasticity in electricity markets. Such studies have shown that reductions in electricity consumption in response to prices, particularly by residential customers, are relatively inelastic in the short term; even high price increases produce fairly small changes in electricity usage. Large consumers, on the other hand, are relatively price sensitive [11]. |
| Recently, AMI and smart grid have become widely accepted as promising technologies to provide increased awareness of electricity usage and cost to consumers. As a result, those technologies could enable consumers to overcome the technical and market barriers to participating in electricity markets through improved price elasticity. |
| In this paper, we have set up a model for exploring consumer s’ price elasticity of demand by Ant Colony Optimization that simulates the deregulated markets [14]. |
| The remainder of this paper presents demand side response modeling with price elasticity in Section II. The Section III describes the experimental investigation and provides results and discussion. Section IV offers a results and discussion on electricity price markets. Section V presents our conclusions. |
II. DEMAND-SIDE RESPONSE MODELING WITH PRICE ELASTICITY
|
| In economics literature, price elasticity is defined as the percentage change in demand or load result in percentage change in price, for mathematically it can be expressed as: |
 |
| where Ãâ°Ã⺠is the consumer’s price elasticity of the demand, δL is the consumer’s change in load, δP is the price change, p is the forecasted energy price ($/MWh). |
| The equation indicates that: a) a price elasticity of it |
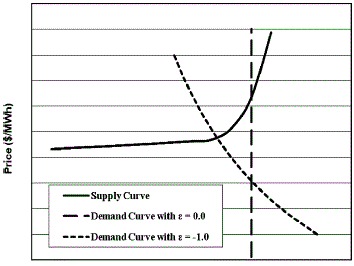
| $ means that a 1 percent increase in price will result in a 1 percent decrease in load, b) that zero price elasticity means that the consumers are insensitive to the price of electricity and that the load is unaffected by the price. In the latter case, the demand curve is a vertical line, as shown in Fig. 1. However, in electricity markets, the supply curve is more like a hockey stick, in which prices increase moderately for most of the supply curve except at the end, where prices increase dramatically with a steep slope. The demand responsiveness provides the greatest benefit in this region [4]. |
| B. Estimate Price Elasticity of Demand for Electricity |
| In general, measuring price elasticity is a complex task, and estimated elasticity coefficients usually have a wide range of un- certainty attached to them. It is common to differentiate between short- and long-run elasticity. Short-run elasticity |
| describes the price response from the system with its current infrastructure and equipment; long run elasticity takes into account the investments that can be made (e.g., in energy conservation or alternative energy supply) in response to higher prices. Table I lists examples of ranges of estimates for short-run and long-run elasticity based on several studies [10]. However, because the studies were carried out in regulated systems, they might have limited validity for restructured markets. In general, one would expect the price elasticity of demand to increase with implementation of AMI and smart grid [9]. |
| B. Demand-Side Bidding and Market Clearing in the Day-Ahead Market |
 |
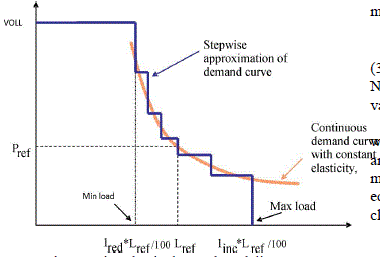
| Where the elasticity are constants, is a user input, and can easily be calculated for each hour from L and P are the Equation (2) is used to represent the demand-side bidding in the model. However, the continuous curve in Fig. 2 cannot be bid directly into the market; a stepwise approximation is necessary to calculate the market clearing as a linear (LP) Problem. |
| The degree of match between the continuous curve and the stepwise approximation depends on the number of steps on the demand curve, as defined for each of the consumers. Step size is constant for all the load reduction steps and also for all the load-increase steps. The corresponding prices are calculated for the load at the midpoint of each step by using the following formula [2]. |
 |
| Note that a maximum demand bid price is equal to the value of lost load (VOLL). |
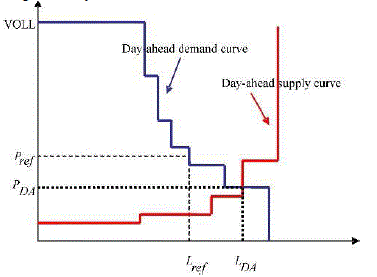
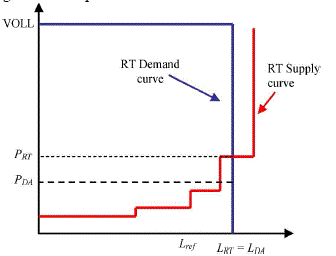
| The market clears where the supply curve intersects with the demand curve, and the resulting price and load are set accordingly. The actual load in the day ahead market can therefore be higher than, lower than, or equal to the reference load. The resulting load from the clearing of the day ahead market, P ref is used as an inelastic load in the realtime market. This is illustrated in Fig. 3, where the demand curve is represented as a vertical line with a price equal to VOLL. |
| Note that in Fig. 4, we assume that of the generators are on forced outage, causing the real-time price, to be higher than the day-ahead price [3]. |
III. EXPERIMENTAL STUDY
|
| A .Ant Colony Optimization Algorithm . |
| The agents (i.e. ants) are guided by the intensity of pheromone trails. The path rich in pheromone becomes the best tour with time. This concept inspired the ACO algorithm. Initially, each agent is positioned on a starting node. Agents move to feasible neighbour node following state trasition rule. During the transfer path ant modify the pheromone level by applying the local updating rule. If the pheromone level on the chosen paths is lowered, these paths become less attractive to other agents. This property gives agents a higher probability to explore different paths and find an improved solution [5]. |
| The number of combinations of 0-1 variables grows exponentially as the number of units grows. Over the past decades, many salient methods have been developed for solving the UC problems. The exact solution to the problem can be obtained by complete enumeration, which cannot be applied to the real power systems due to its computational burden [15]. |
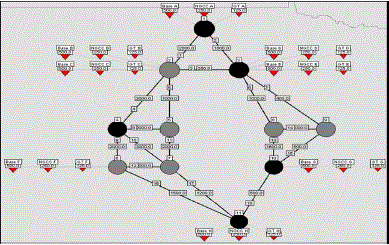
| In the experimental simulations, we use an 11-node trans- mission network configuration; this approach is based on the method. The technical specifications and the topology for the transmission lines are listed in Table II. There are eight GenCos in the system, located at various nodes in the grid (Fig. 5). All of the GenCos have the same set of generating units: one base load coal plant (CO), one combined-cycle plant (CC) to cover intermediary load, and one gas turbine (GT) peaking unit. For each GenCo, all three generating units (CO, CC, and GT) are connected to the same node. From one node to another node circuit reactance and Line capacity are given in the per unit value. |
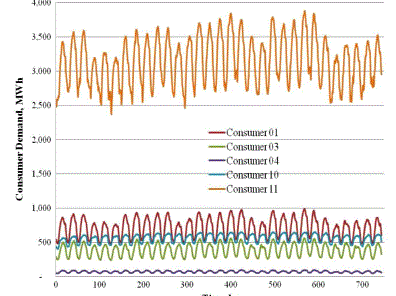
| We use an aggregate representation of the demand side of the market. Five aggregate consumers are included, representing total demand in the node where they are connected. The loads are connected to nodes 1, 3, 4, 10, and 11. We are simulating the month of July, which is assumed to be the peak load month of the year. The five hourly load series are shown in Fig. 6. The highest load is clearly in node 11. |
| B. Scenarios and Price Elasticity Parameters |
| For the sake of simplicity, we assumed that all five consumers exhibited price elasticity. A number of scenarios were run to analyze the impact of price elasticity and the reference price of consumers. |
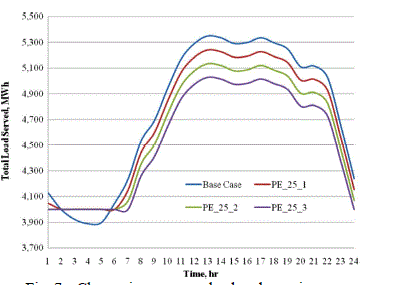
| In all of these scenarios, we assumed that the GenCos bid the Incremental production cost of their units (as listed in Table IV). In demand-side bidding, the consumers had a reference price of various price of electric coefficient. In addition, the lower and upper load decrease and increase limits were set at 90% and 105% of the base load, respectively. These scenarios are summarized in Table V. The loads served in the base case and in other scenarios for a typical day are shown in Fig. 7, which shows that consumers increase their load when prices are lower and decrease their load when prices are higher [6]. |
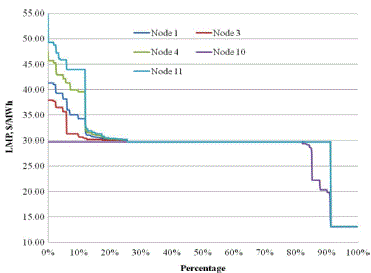
| Tables VI and VII, respectively, present the reductions in peak load, total load served, and total energy cost under var- ious scenarios. The overall peak load reduction is in the rangeof 5% to 8%. However, the peak load reduction for Consumer 10 is only in the range of 1% to 5%. The lower peak load reduction for Consumer 10 can be attributed to the LMPs at node10. The LMPs at node 10 exceed the consumers’ reference price 85% of the time; at other nodes, it exceeds the reference price 91% of the time (Fig. 8). Therefore, the peak load reduction for Consumer 10 is much less than of the other consumers [7]. |
| However, other consumers benefit from a reduction in both load and prices. Table V presents the impact of the consumers’ price elasticity on GenCos and TransCos. When consumers exhibit price elasticities in the range of to, the GenCos’ profits are reduced by 3.50% to 6.87% and the TransCo’s congestion revenues are almost eliminated. |
| Here the Table III is represents the consumers 1, 3,4,10,and 11 are shows the different base cases and the total of these base cases are calculated from this five consumers. The maximum of the base case is consumer 11 and the minimum base case is consumer 4. |
| This Table presents the impact of the consumers’ price elasticity on GenCos and TransCos. When consumers exhibit price elasticities in the range of to, the GenCos’ profits are reduced by 3.50% to 6.87% and the TransCo’s congestion revenues are almost eliminated [13]. |
| Increase in the GenCos’ profits, because even though they are generating less energy compared with the base case, the startup costs decrease; where as there is a significant reduction in the congestion charges. The table presents the profits of each GenCos, individual consumers load served and total cost respectively, when consumers have a higher reference price. When the price response is reduced because of a higher reference price, the total cost for consumers at nodes 3 and 10 increases compared with the base case. This shows that all consumers do not benefit equally, and some of them may actually face a higher cost. The level of the customers served the maximum and minimum power [14]. |
| We assumed that all consumers exhibit price elasticity. A number of scenarios were run to analyze the impact of price elasticity and the reference price of consumers. In all of these scenarios, GenCos bid the incremental production cost of their units. In demand-side bidding, the consumers had a reference price of 50 kWon/MWh or 55 kWon/MWh (1 kWon is approx- imately equivalent to U.S. $1) and various price elastic coefficients. In addition, the lowerand upper-load decrease and increase limits were set at 90% and 110% of base load, respectively [12]. |
| Because there are several consumers in the system, the r e s u l t s are presented here at the zonal level. There is a 2% to 4% reduction in the peak load in all zones as the consumers increase similarly; there is a 1% to 2.5% reduction in the total load. By exhibiting price elasticity consumers were also able to reduce their total cost in the range of 2.0% to 4.0%. |
IV. RESULTS AND DISCUSSION
|
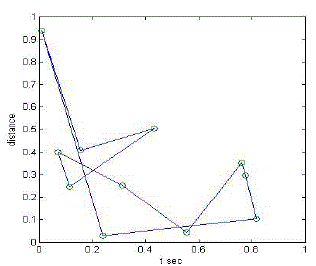
| The range of the 11 number of the distribution loads are served from minimum to maximum from the priority of power ranges. The number of combinations of 0-11 variables grows exponentially as the number of units grows. Over the past decades, many salient methods have been developed for solving the economic dispatch problems. |
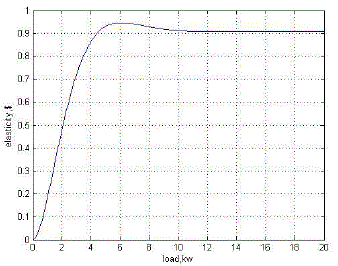
| The minimum load served is no.5 and the maximum load served is no.11. The number of agent and maximum count are chosen same as those in the referred the value of pheromone quantity is obtained through a parameter tuning. When the pheromone quantity is more than 0.05, the cost is observed to increase. In otherwords, the solution’s quality becomes worse with higher pheromone quantity. |
V. CONCLUSION
|
| This paper describes a study in which Ant Colony Optimization technique was used to demonstrate quantify the economic impact of price elasticity of demand in electricity markets when consumers are well equipped with smart grid technologies to increase their awareness of responsiveness of demand. While the impact depends on the price level at which consumers exhibit the price responsiveness, price-elastic consumers could benefit by a reduction in energy usages and prices. And also they could significantly reduce congestion charges and, potentially, reduce the market power of GenCos. The conventional ACO algorithm is known to have problems such as big memory requirement and long execution time. The proposed ACO algorithm is applied to test power systems of up to 100-unit along with 24-hour. The simulation results reveal that the proposed ACO algorithm may provide better solution for UC problems than the conventional optimization methods in a reasonable time period. The customer use the concept of elastic demand, when they are exposed and aware of the price energy and arrange their affairs in such a fashion at reduce their demands as the price of the next available offers exceeds in a certain level. The main theme of reduce energy consumption by Consumers are well equipped with smart grid technologies to increase their awareness of responsiveness of demand, and benefit by a reduction in energy usages and prices. |
ACKNOWLEDGMENT
|
| The author would like to thank to their family of their support. The author would also like to thank Mr. S. Rajan Babu (Assistant Professor) for their comments on how to make their work practical, useful, and theoretically sound. |
Tables at a glance
|
 |
 |
 |
 |
 |
| Table 1 |
Table 2 |
Table 3 |
Table 4 |
|
| |
Figures at a glance
|
 |
 |
 |
 |
 |
| Figure 1 |
Figure 2 |
Figure 3 |
Figure 4 |
Figure 5 |
 |
 |
 |
 |
 |
| Figure 6 |
Figure 7 |
Figure 8 |
Figure 9 |
Figure 10 |
|
| |
References
|
- Faruqui, S. Sergici, and A. Sharif, “The impact of informational feedback on energy consumption—A survey of the experimental evidence,” in Social Sciences Research Network Working Paper, May 21,
- E. Bompard, Y. Ma, R. Napoli, and G. Abrate, “The demand elasticity impacts on the strategic bidding behavior of the electricity producers,” IEEE Trans. Power Syst., vol. 22, no. 1,pp. 188–197, Feb. 2007.
- H. Oh and R. Thomas, “Demand-side bidding agents: Modeling and simulation,” IEEE Trans. Power Syst., vol. 23, no. 3, pp.1050–1056, Aug. 2008.
- Stevens and L. Lerner, “Testimony on the effect of restructuring on price elasticities of demand and supply,” California Energy Commission Jul. 1996 Online]. Available:http://www.energy.ca.gov/ER96/documents/staff_document
- S. Jang, J. Roh, W. Kim, T. Sharpa, J. Kim, and J. Park, “A novel binary ant colony optimization application to the unit commitment problem of power systems,” J. Electr. Eng..
- R. Earle, “Demand elasticity in the California power exchange day- ahead market,” Electr. J., vol. 13, no. 8, pp.
- V. Koritarov, “Real-world market representation with agents: Modeling the electricity market as a complex adaptive system with an agent-based approach,” IEEE Power Energy Mag. vol. 2, no. 4, pp. 39–46, Jul. /Aug. 2004 Online]. Available: http://www.dis.anl.gov/pubs/61120.pdf
- R. Cirillo, T. Veselka, G. Conzelmann, C. Macal, and M. North, “Evaluating the potential impact of transmission constraints on the operation of a competitive electricity markets in Illinois,” ANL Rep. ANL-06/16, Apr. 2006.
- R.D.Christie, B.F.Wollenberg, and I.Wangensteen, “Transmission management in the deregulated environment,” Proc. IEEE, vol. 88, no.2, pp. 170–195, Feb. 2000.
- Y. H. Hou, Y.W. Wu, L.J.Lu and X.Y. Xiong, “Generlized Ant Colony Optimization for Economic Dispatch of Power Systems”, IEEE, 2002.
- M. Dorigo and L.M. Gambardella, “Ant colony system: a cooperative learning approach to the traveling salesman problem,” IEEE Trans. on Evol. Compiut, Vol. 1, pp. 53-66, Apr. 1997.
- D. N. Simopoulos, S. D. Kavatza, and C. D. Vournas, “Unit commitment by an enhanced simulated annealing of the algorithm,” IEEE Trans. on Power Systems, Vol.21, No. 1, Pp.68-76, Feb. 2006.
- A.I.Cohen, M.Yoshimura, “A branch-and-bound algorithm for Unit commitment,” IEEE Trans. On Power from Apparatus and Systems, Vol. PAS-102, pp.
- J. A. Muckstadt, R. C. Wilson, “An application of the mixedinteger programming duality to scheduling thermal generating systems,” IEEE Trans. on Power Apparatus and Systems, pp. 1968-1978, 1968.
- B. Sheble, “Solution of the unit commitment problem by the method of unit periods,” IEEE Trans. on Power Systems, Vol. 5, No. 1, pp. 257-260, Feb. 1990.
|