Research & Reviews: Journal of Botanical Sciences
ISSN: 2320-0189
ISSN: 2320-0189
Anup Vibhute1*, SK Bodhe2, and BM More3
1Department of Electronics and Telecommunication Engineering, BMIT, Solapur, India
2Director, Bosh Technology, Pune, India
3Department of Physics at BMIT, Solapur, India
Received date: 03 December 2013 Accepted date: 26 December 2013
Visit for more related articles at Research & Reviews: Journal of Botanical Sciences
Invasive methods such as petiole/leaf analysis are laborious and time consuming. The methods were proposed by many researchers that obtain nutrient analysis by non invasive method. This paper proposes RGB color image processing based method for nitrogen estimation in veraison. The Green index Igreen shows strong positive correlation with coefficient of 0.90 and other index Ikaw shows strong negative correlation with coefficient factor -0.88. The correlation between chlorophyll and nitrogen showed positive correlation. The method proposed on the basis of Igreen index is cost effective and less time consuming.
Image Processing, veraison, Igreen index, Kjeldahl digestion
Plants need a certain amount of macronutrients (nitrogen, phosphorus, etc.) and micronutrients (Zinc, Boron, etc.) to grow and stay healthy. These Nutrients alter and regulate the functioning of plant and produce qualitative and quantitative changes in plant yield. Nutrient deficiency may result in weaker plants. Nutrient deficiencies make plant more susceptible to diseases. Fertilizers are the supplements for the plants to grow healthier. In case of grapevines, the deficiencies or over doses are observed by visual inspections by experts which is an issue cost and availability. Nitrogen application to grapevine in excess form results, in excessive growth of shoots at the cost of fruit set. This will also results in delay in maturity and poor bud formation in following season [1,2]. The Proper application of fertilizers and pesticides can save cost of production.
In most of the cases, deficiencies are observed by change in color of leaves in which Chlorophyll is an important ingredient. Chlorophyll is a molecule in a leaf which is responsible for photosynthesis action. The carbohydrates produced in photosynthesis are used as food for growth of plant and fruit [3]. Various methods are proposed to analyze the nutrients based on chemical analysis such as leaf analysis, petiole analysis [2, 4], etc. The previously cited methods are destructive methods. But many researchers suggested non destructive and competitive methods based on hand held meters or image processing. Chlorophyll estimation was done using a video camera using different R, G, and B functions [5]. Chlorophyll by RGB image analysis by calculating mean brightness ratio and correlated with results of chlorophyll meter. Results had significant correlation with the ratio [6]. Changes in the color of the first three leaves of Faba bean (Vicia Faba L.), Pea (Pisum sativum L.) and yellow lupine (Lupinus luteus L.) plants were analyzed under conditions of macronutrient deficiencies by digital color image analysis [7]. The objective of this experiment is to propose easy and non invasive method to estimate Nitrogen. We have proposed the technique to evaluate Nitrogen estimation and compared with index proposed by Kawashima. It can be proved in this experiment that Image processing can be effectively utilized for estimation of Nitrogen with an acceptable accuracy.
Image acquisition
For the purpose of experiment different field and plots are selected to cover different soil and environmental conditions. The collections of samples of leaves are taken at different growth levels. Additionally we have collected samples under different stress condition and were in veraison states. Before sending sampled petioles for chemical analysis, images were taken onsite during the morning period between 8 am to 9 am and in the evening before 2 hours of sunset without flash (under natural light condition).
To capture the images a CCD camera having a resolution of 12 megapixels is used (Nikon S570). For the purpose of image analysis, the resolution was selected 3 megapixels (2048* 1536). While capturing images the distance between camera and a sample was 7.5 inches. To reduce reflection black background is selected. To reduce the computational burden and to remove leaf blade area, images are pre processed by cropping it to about 700* 500 pixels.
Chemical analysis
The petiole is the plant part that is to be assayed rather than the leaf blade. Petioles are the major conductive tissues and are having normally higher nutrient elements. Fresh plant tissue is perishable and, therefore, must be kept cool and in a dry atmosphere prior to delivery to the laboratory. It is best to transport plant tissue in clean paper or cloth bags. In the laboratory, decontamination or washing is carried out to remove external dust particles and chemicals. Then petioles are air dried at 80°C to remove moisture without any thermal decomposition. To ensure a greater degree of uniformity in composition samples are grinded to small particles. Then organic matter destruction can be accomplished either by high temperature thermal oxidation or by wet-acid digestion. Nitrogen analysis can be done by two methods: Kjeldahl digestion method [8] and Dumas technique. In India, generally Kjeldahl digestion method is adopted for Nitrogen analysis.
Indices calculation
Images acquired are 24 bit color images with R, G, B planes. These planes are processed through the algorithm to calculate Green index Igreen and other index proposed by Kawashima Ikaw. The Index Igreen is computed by comparing every pixel in RGB plane to calculate the percentage of green. The threshold values selected for selection of green pixel [9] are as following
Igreen = f(R<170,ðº>150,ðµ<170) --(1)
and other index are calculated as
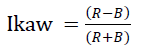 --(2)
--(2)
Where the values of R and B are average values in the plane.
Since, the chemical method is an averaging method of samples, we also proposed mean values and median for calculation. These values are taken from the computed values of a number of samples collected from particular plot. Finally the values obtained from chemical analysis and index calculated are compared and used in fitting curves to develop the regression equation. From this equation the next samples are tested.
Nitrogen and chlorophyll are related with the color of the leaves. Fully matured and healthy leaves shows greater percentage of green and young and old leaves shows less percentage of green. The older leaves are yellow and show the nitrogen deficiencies. But many times the visual estimation may be unreliable and ambiguous. Table 1 shows the percentage of green as Igreen and Ikaw. These values show high correlation with chemically analyzed nitrogen values. Igreen shows strong positive correlation where as Ikaw show strong negative correlation as shown in figure 1 and figure 2 respectively. These indices and laboratory values are curve fitted in matlab to find best fitted curve. For Igreen and Ni Lab values the equation obtained by linear model 5th polynomial as
Y= P1x5+ P2x4+ P3x3+ P4x2+ P5x+ P6 --(3)

Table 1

Figure 1: Graph between Igreen and Nitrogen lab values

Figure 2: Graph between Ikaw and Nitrogen lab values.
with values (-15.74, 49.62,-57.63,30.54, -6.061,0.6131 respectively for P1 to P6) and R2 of 0.89. For Ikaw and Ni lab values the equation obtained is
Y= P1x4+ P2x3+ P3x2+ P4x+ P5 --(4)
with values(2.838,3.042,0.0705,-0.8911,0.3867 for P1 to P5 respectively )with R2 0.81. The values are predicted from these equations are compared in percentage error as shown in table 1.
Greenness of leaf can be effectively correlated to Nitrogen. Igreen and nitrogen analyzed shows strong positive correlation with correlation factor 0.90 and with Ikaw it shows strong negative correlation with factor -0.88. Chlorophyll and nitrogen shows strong positive correlation with coefficient factor 0.84. The values predicted with equations obtained can predict the values of nitrogen with average accuracy of 96.28% in case of Igreen and about 94% in case of Ikaw. Greenness index can be effectively used for estimation of nitrogen and comparable with index Ikaw. The results can be obtained within few minutes as compared to lengthy and time consuming chemical process.
Nitrogen and chlorophyll contents are closely related to greenness of the leaf. The greenness of the leaf can be effectively used for nitrogen estimation using image processing technique. The proposed technique of estimating nitrogen by image processing method can be time and cost effective. The changes in correlation may occur according to different soil conditions and plant varieties.