Recently,the mobile phone has emerged as a leading icon of the convergence of consumer electronics. A wide variety of mobile phone applications such as DMB (digital multimedia broadcasting), digital photography, video telephony, and full internet browsing are now available to consumers. To meet the demands of these applications, image quality has become increasingly important. Furthermore, touch windowsare popular on mobile display panels,but they cause contrast loss because ofthe low transmittance of ITO film. This paper presents an image contrast enhancement algorithm to be embedded on aSoC.A clipped histogram stretching (CHS) method is proposed here to enable the algorithm to adapt to the input images, while an Sshaped curve algorithm and a gain/offset method are proposed for static applications. Finally, the performance of the proposed algorithm is evaluated using histograms, RGB pixel distributions, entropy values, and dynamic range values of the resulting images.
Keywords |
| Mobile display,Contrast Enhancement,Histogram Stretching, SoC, FPGA |
INTRODUCTION |
| In recent years, numerous new applications such as DMB (Digital Multimedia Broadcasting), video telephony, and full
Internet browsing have been playing very attractive roles in mobile phone services. For this reason, image enhancement of
small mobile displayshas become a demanding issue for mobile users. |
| Theimage enhancement technologies which have been studied for large-screen TVs could also be useful for small mobile
displays. Among these, image contrast enhancement is one of the most important methods.The resolution of a mobile display is
considered high when it is greater than WVGA(800×480), but the resolution of source images is even less. That is why source
images need to be upgraded. Image scaling also causes a blurring effect [1, 2],which degrades image contrast by pixel
interpolation processing. Furthermore, touch-screen phonesare very popular, but the transmittance of ITO is relatively low
(approximately 75–79%), and deposition of ITO (indium-tin oxide, In2O3/SnO2) film on the touch-screen glass causes a loss of
contrast ratio in the display. The most widely used method of image enhancement is intensity transformation to enhance the
image contrast ratio. In this method,a linear, logarithmic, or power function is used to transform the input image intensity.
Those functions are classified as gain/offset control and gamma correction methodsdepending on the display characteristics of
each device. Recently,an adaptive histogram stretching method has been widely used. In this method, a histogram of the input
image is analyzed and then transformed into the desired shape. Compared with all other methods, theresults reported here show
that the proposed algorithm is the most effective for a variety of images. |
| This paper reports on the development of a novel CE (contrast enhancement) algorithm to be embedded in aSoC (system on
chip) for mobile display which is implemented on anFPGA(flexible programmable gate array). The algorithms investigated are
CHS (clipped histogram stretching), S-shape curve, and gain control.The performance of the FPGA with each proposed
algorithm is evaluated and compared with others in the section on simulation results.This paper is organized as follows: Section
I gives the introduction of image enhancement technologies. Section II describes the proposed contrast enhancement algorithm.
Section III shows the experimental results to validate the proposed algorithm. The last section IV concludes the paper followed
by the references |
PROPOSED CE ALGORITHM |
| The block diagram of the display controller for the SoC under development is shown in Fig. 1.The capture block is used to
transform the input image format and color matrix to replace RGB with YUV. The SoC has a frame memory (SDRAM, 16MB)
which is used for prevention of tearing and for frame-rate conversion. Real-time input pixel data are stored into frame memory.
The image enhancement block receives the pixel data from the scaling block. In this block, image enhancement is performed,
and then a LUT (look-up table) is positioned to provide necessary functions for the image display. The user can upload the gammacorrection list arbitrarily using an I2C(inter-integrated circuit) serial port. In the image enhancement block, CHS(clipped
histogram stretching) can process RGB or YUV. This component prevents color distortion effectively by using only the Ycomponent.
The image enhancement circuit is placed after the frame memory. A detailed image enhancement block diagram is
shown in Fig. 2. CHS, the S-shaped curve, and gain control are used for contrast enhancement. Each block will be explained in
detail in the next section. |
| CHS |
| CHS is an adaptive contrast-enhancement technique which can extend the histogram of moving input images dynamically [3].
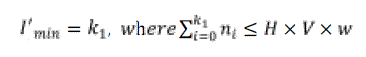
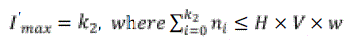
Figure 3 shows a demonstration result from the CHS method. New minimum (I´min) and maximum (I´max) intensity values are
provided from the input images. When equations (1) and (2) are satisfied, I´minand I´maxare obtained. Next, the histogram is
stretched according to equation (3). The CHS block requiresamemory device togenerate histogram information. For this
purpose,a 15.36-KB SRAM is allocated (because each pixel can have only one intensity value). This means that the available
resolution is VGA and that the system can process R, G, and B separately. Figure 4 shows the H/W (hardware) structure of the
CHS. |
| Histogram generation is performed before the histogram stretching block to generate the new intensity values I'min and I'max.
These new minimum and maximum intensity values are chosen usingwvalues (weighting factors) from the input image pixel
data which are stored sequentially in SRAM. Next, histogram stretching is performed while reading the pixel data from frame
memory. As shown in Fig. 4, the histogram generation block is located in parallel with the frame memory. This is why the
histogram stretching block receives the new intensity values and the frame data of the same frame simultaneously. The
following equations are used to search for new minimum and maximum intensity values: |
 (1) (1) |
 (2) (2) |
| whereH and V are the horizontal and vertical resolution, respectively of the input image, and wis a selectable weighting factor
that represents the clipping ratio of the whole histogram energy from 0.1% to 0.9%. In equations (1) and (2), ni is the number of
pixels at intensity value Iin the input image, and k1and k2 are pixel intensity values ranging from 0 to 255. The histogram is
stretched according to equation (3). |
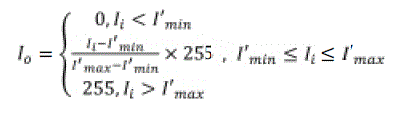 (3) (3) |
| B. S-shapedCurve |
| The S-shaped curve method is a static contrast enhancement technique which can be used for still images. This method is
indifferent to the histogram of the input image, but simply transforms input pixelsinto output pixelsby means ofan arbitrary
mapping process. Unlike CHS, it does not require any memory.In this research, only the luminance component(Y) was
considered. Figure 5 shows a block diagram of the S-shaped curve generation algorithm. |
| The following equation is used to generate the S-shape curve: |
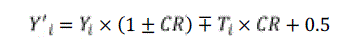 |
| whereYiis the luminance component of the input image, Yi´ is the new luminance component generated byequation (4),CR isthe
ratio of curvature, and Ti is a constant value which is embedded in the register table block. The Ti register table block is
implemented using power pads and ground pads forsimplicity and compact block size. A plot of Ti versus Yi is shown in Fig. 6. |
| Ti is determined byYi and has 171 constant values at 256 gray levels.Figure 7 shows the relation between the luminance value
of the input image (Yi) and the new luminance value (Yi´). The shape of the S-curve is determined by whether the CR is positive
or negative. |
| C. Gain/Offset Control |
| The offset control method increases the brightness of an image by simply adding an arbitrary value to the input pixel value.
Similarly, the gain control method enhancesthe contrast of an image by multiplying each input pixel value by an arbitrary value.
This method is depicted in Fig. 8: |
EXPERIMENTAL RESULTS |
| The results of the simulationsperformed in this researchare shown inFig. 9. The source image has 640×480 resolution and is
in 24-bit RGB format. Figure 9(a) showsthe source image;in Fig. 9(b),the CHS method has beenused to obtain the luminance Y.
Figure 9(c) shows the source image as processed by the S-shaped curve algorithm, and the output of the gain control method is
shown in Fig. 9(d). It can be seen that Figs.9(b) to 9(d) have clearer contrast than Fig. 9(a) in the areasrepresenting sky with
clouds, the roof of the lighthouse, the pole of the lighthouse, and the grass in front of the fence. |
| Figure 10 shows histograms of theoutput images. It is clear that the histograms of the output imageshave a wider extent than
that of the source image. Even thoughthe dynamic range is extended to the maximum level, there are still discontinuities in the
histograms of each image.Figure 11 shows the distributions of the RGB pixel values of the output images after contrast
enhancement. |
| Compared to the source image,Figs. 11(b) to 11(d) exhibit a greater range of RGB pixel values.In particular, the blue pixel
valuesexhibit a broader range than the other R and G pixel values,which may make the simulated imagefeel colder than the
source image. Contrast enhancement was investigated quantitatively using the entropy and Hsu et al. methods [4]. Entropy
provides randomness that can be used to measure the degree of uniformity of the distribution of probability variables. In image
processing, a pixel value is equivalent to a probability variable, and higher entropy means higher contrast ratio [5]. Hsu et al.
proposed a simple method fordetermining by how much contrast has been enhanced [4]. Using the cumulative distribution function (CDF) of the histogramsof the source and processed images, an intensity value ratio between 25% and 75% was
determined.Figure 12showsthe plotobtained usingthe Hsu et al. method, and Table 1 shows a summary of the results. |
| From table 1, we can seethe results of the entropy and Hsu et al. methods. In particular, the S-curve control method provides
the highest contrast enhancement compared tothe other methods.The algorithms proposed in this paper, CHS, S-curve control,
and gain control,were embedded on an FPGA(Field Programmable Gate Array) board to evaluate their performance.
TheXC4VLX200-F1513CFPGA, one of the Vertex series manufactured by Xilinx with 200,000 gates, was used in this
experiment.The system clock rate was 125MHz.The display panel wasa TFT-LCD made by LG Philips (LB070WV1)with a
resolution of800×480. Figure 13 shows a photograph of the FPGA evaluation board. |
| In Figure 14, the leftportionshows the source image, while the right portion shows the enhanced image on a real LCD panel.
The same CHS algorithm was used to generateFigs. 14(a) and 14(b), but Fig.14(a) was processed using onlythe luminance
component, whileFig. 14(b) wasprocessed using the RGB components. The result using the RGB componentsshows a more highly enhanced color effect than the image produced using luminance only. When choosing RGB or luminance components,
the gamma characteristics of the display panel must be considered. In Fig. 14(c), S-curve controlwas used, andit is apparent
thatthe white color is too highly saturated in the cloudsof the sky and the pole of the lighthouse. |
CONCLUSION |
| This paper has reported on the development ofa novel method of contrast enhancement for anSoCof a small mobile display.
The contrast enhancement algorithmsdeveloped are CHS(clipped histogram stretching), S-shaped curve, and gain control. To
evaluate the performance of these algorithms, hardware blocks were embedded on an FPGA board. According to the simulation
results, the S-shaped curve and CHS gave much higher enhancement ratios than gain control. However,one side effect was
apparentin the transformation of the “feel” of the image because the distribution of RGB pixel valueswas distorted. The
experimental resultsreported here have proven that a user-friendly image enhancement algorithm for SoChas beensuccessfully
developed. Moreover, this algorithm can be simply embeddedto implement ahardware systemand has potential for application
to real-time image contrast enhancement. |
Tables at a glance |
 |
| Table 1 |
|
Figures at a glance |
 |
 |
 |
 |
 |
| Figure 1 |
Figure 2 |
Figure 3 |
Figure 4 |
Figure 5 |
 |
 |
 |
 |
 |
| Figure 6 |
Figure 7 |
Figure 8 |
Figure 9 |
Figure 10 |
 |
 |
 |
 |
| Figure 11 |
Figure 12 |
Figure 13 |
Figure 14 |
|
References |
- R. C. Gonzales and R. E. Woods, Digital Image Processing, Prentice Hall, 2002.
- Q. Wang, R. Ward, and J. Zou, “Contrast enhancement for enlarged images based on edge sharpening,”IEEE International Conference on Image Processing,pp. 11-14, 2005.
- R. Crane,A Simplified Approach to Image Processing, Prentice-Hall, 1997.
- C.F.Hsu, C. C. Lai, and J. S. Li, “Backlight power reduction and image contrast enhancement using adaptive dimming for global backlight applications,” SID’08 Symposium Digest, pp. 776–779,Los Angeles, 2008.
- N. BassiouandandC.Kotropoulos, “Color image histogram equalization by absolute discounting back-off,” Computer Vision and Image Understanding, 108–122, 2007.
|