Research & Reviews: Journal of Engineering and Technology
ISSN: 2319-9873
ISSN: 2319-9873
1Department of Civil Engineering, Eslamshahr Branch, Islamic Azad University (IAU), Eslamshahr, Iran
2Ph.D. Student, Dept. of Civil Engineering, Science and Research Branch, Islamic Azad University, Tehran, Iran
Received Date: 12/07/2016; Accepted Date: 10/09/2016; Published Date: 17/09/2016
Visit for more related articles at Research & Reviews: Journal of Engineering and Technology
Embankment dam break, Empirical equations, Taleghan dam, Flow-3D numerical model
Immunization of dams against abrupt floods and possible break necessitates exact evaluation and prediction of their behavior. Different factors cause embankment dam break such as overtopping, piping, internal leak, sliding, overturning and earthquake. In many dams in the world, overtopping occurs due to inappropriate outlet or spillway capacity [1]. According to studies, in the past 75 years, thirty percent of dam breaks in USA occurred due to overtopping, fourteen breaks occurred due to internal erosion and three breaks occurred due to earthquake [2]. So, dam break problem and effects of horrible wave’s dispersion in downstream have been significant for experts. Embankment dam break is a time-consuming process and usually occurs due to internal erosion, piping and overtopping. One of the main goals of dam break analysis is evaluation of break result and water discharge of reservoir. Therefore, the amount of reservoir storage is important in break analysis. In dam break analysis, reservoir level is normal [3].
David, et al. [4] studied effective parameters in embankment dam break and their uncertainties. In their study, dimensional analysis was conducted on different parameters and 74 embankment dam breaks were investigated and a model was presented to estimate critical values of each effective parameter in embankment dam break. In this model, which has been presented based on monte - carlo method, overtopping critical values and time of flood overtopping up to break time can be predicted [4]. Study of Saqib Ehsan and Walter Marx [5] was based on large embankment dams break simulation. This study was performed on Mangla dam using Mike11 numerical model. Based on inflow, outflow hydrograph values of dam break were modeled. In their study, simulations were made at two different water levels and the results were compared and evaluated. Lariyah, et al [6] 2013 studied dam break and its related parameters in Kahang dam using a numerical model. Besides investigation of peak discharge and outflow hydrograph determination in overtopping, different gap parameters in dam body have been studied. In their numerical model, depth of gap in embankment dam was determined by changes in dam lateral slope. Robin F, et al. [7] 2003 studied the effect of seepage and erosion on embankment dam break. They studied some embankment dams and classified break time according to core, foundation, filter and other material characteristics. Shamsai and Mousavi [8] studied the estimation of embankment dam break parameters and its flood routing in 1383. They used 142 broken embankment dams data to present new equations to estimate embankment dam break parameters such as maximum discharge and break time [9].
Case Study
Taleghan dam is located in 135 Km of northwest of Tehran province on Taleghan river in the vicinity of Roshanabdar village. Its longitude is 50° 37' to 51° 10' and its latitude is 36° 5' to 36° 25'. The height and crest length of the dam with clay core are 103 and 111 meters, respectively. Normal and minimum level of the reservoir are 1780 and 1742 m.a.s.l, respectively. Useful and total volume of reservoir is 320 and 420 MCM, respectively. Figure 1 shows cross section of Taleghan dam [10].

Figure 1: Cross section of taleghan embankment dam [9].
Flow-3D Model
Flow-3D (ver.10.1) has been used in this paper to study Taleghan embankment dam break. Numerical simulation has been done based on geometric characteristics of Taleghan dam. It has been tried to simulate all effective parameters of dam break based on real conditions.
Geometric simulation of taleghan embankment dam body: Solid geometry of dam body should be built by Flow-3D to simulate dam break resulting from overtopping. Solid works 2011 software is selected to build solid geometry. After simulating location geometry and Taleghan embankment dam bed by solid work and building solid geometry of the body as well as combining differentn components of the dam such as core, filter, bed and shell, final model of Taleghan dam geometry is presented. See Figure 2 and Table 1.

Figure 2: Solid geometry of taleghan embankment dam in solidwork.
| Geometric characteristics of dam | Values |
|---|---|
| Dam Height (meter) | 103 |
| Dam Length (meter) | 650 |
| Dam Width in Bed (meter) | 1,000 |
| Total Model Length | 3,000 |
| Total Number of Meshes | 1,200,000 |
Table 1: Geometry characteristics of taleghan dam in numerical model.
Then, solid geometry is imported in Flow-3D numerical model. Calculation cells have been shown in Figure 3. Also, defined boundary conditions based on dam characteristics have been presented in Table 2 and Figure 4.

Figure 3: Calculation cells and dam body in flow-3D model.
| Applied boundary condition to numerical model | Boundary location in numerical model | |
|---|---|---|
| Inflow discharge | Q | Xmin |
| Symmetry boundary condition for free surface flow | S | Zmax |
| Outflow | O | Xmax |
| Wall | W | Ymin |
| Wall | W | Ymax |
| Wall | W | Zmin |
Table 2: Applied boundary conditions in dam break simulation.

Figure 4: Applied boundary conditions in taleghan dam break simulation.
In this modeling, 3D flow field is solved by RNG turbulence model. Based on the comparison made between turbulence models in Flow-3D software in studied performed by Rostami [11], the results of RNG turbulence model are more accurate than other turbulence models in spillway flows.
Empirical Equations Method
Values of the mentioned data have been investigated using three empirical equations to analyze dam break modeling results due to overtopping. First equation, based on Froehlich [12] studies has calibrated, compared and evaluated 22 different dams. This equation gives peak discharge resulting from dam break due to overtopping.
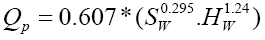 (1)
(1)
Second equation (multiple regressions) has been calibrated by studying 87 different dams to determine peak discharge resulting from dam break due to overtopping [13].
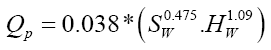 (2)
(2)
Third equation was presented by Mac-Donald [14] in 1984 to estimate peak discharge resulting from dam break. This equation was presented by studying 23 embankment dams. The general form of the equation is:
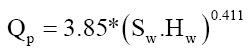 (3)
(3)
In these equations,  is peak discharge resulting from dam break due to overtopping,
  is water level in dam reservoir before break and during overtopping,
 is total volume of reservoir (MCM).
Five scenarios are defined to investigate embankment dam break resulting from overtopping. Inflow volume to reservoir is different in each scenario. Based on the reviews, minimum flood volume that overtops and damages dam body is about 5 MCM. Also, minimum flood volume that fully destroys the dam body is about 25 MCM. In the range of 5 to 25 MCM, flood volumes of 7.5, 9 and 13 MCM have been considered. Notably, in this paper it is assumed that flood discharge system is unable to discharge inflow to reservoir. Contents of scenarios have been presented in Table 3 and in the following, scenario results have been presented.
| Scenario | Water Height in Reservoir (m) | Storage (MCM) | Flood Volume (m3) |
|---|---|---|---|
| 1 | 82 | 420 | 5.0 |
| 2 | 82 | 420 | 7.5 |
| 3 | 82 | 420 | 9.0 |
| 4 | 82 | 420 | 13.0 |
| 5 | 82 | 420 | 25.0 |
Table 3. Flow modeling conditions for 5 states of overtopping in taleghan dam.
Scenario 1
In the first scenario, minimum flood volume that can overtop is determined and a 5 MCM flood enters Taleghan dam reservoir. According to Figure 5, overtopping occurs in this condition and causes break and erosion in dam body. Overtopping causes fracture in the central axis of the dam. Based on the model results, maximum depth of fracture is about 19.6 meters. The main part of dam body is stable in this condition and a serious damage is observed in dam heel and toe. Outflow hydrograph is shown in Figure 5. As can be seen, peak discharge is about 54269 cubic meters per second.

Figure 5: Results of numerical modeling and taleghan dam break hydrograph due to overtopping in scenario1.
Scenario 2
In the second scenario, overtopping causes break and erosion in some parts of the crest. Also, it causes a fracture in the central axis of the dam. In this condition, dam break and erosion intensity is more evident in the core. It should be noted that maximum depth of fracture is about 20.8 meters. According to Figure 6, the main part of dam body is stable and no serious damage is seen in dam heel and toe. Outflow hydrograph is shown in Figure 6. As can be seen, peak discharge is about 59390 cubic meters per second.

Figure 6: Results numerical modeling and taleghan dam break hydrograph due to overtopping in scenario 2.
Scenario 3
In the third scenario, overtopping causes break and erosion in most parts of the crest. Also, it causes a partly deep fracture about one third of dam height. In this condition, dam break and erosion intensity is evident in the core as well as the upper part of crust and filter. It should be noted that maximum depth of fracture is about 33.4 meters. According to Figure 7, the main part of dam body is affected by erosion and downstream part of dam has erosion with maximum depth of 13 meters. Outflow hydrograph is shown in Figure 7. As can be seen, peak discharge is about 78913 cubic meters per second.

Figure 7: Results of numerical modeling and taleghan dam break hydrograph due to overtopping in scenario 3.
Scenario 4
In the fourth scenario, overtopping causes erosion in the entire crest and half of dam body. Also, it causes a partly deep fracture about half of dam height. Dam core is extremely affected by erosion. In this condition, dam break and erosion intensity is evident in the core, the upper part of crust and filter. It should be noted that maximum depth of fracture is about 51.5 meters. According to Figure 8, the main part of dam body is affected by erosion and downstream part of dam has erosion with depth of 23 meters. Outflow hydrograph is shown in Figure 8. As the Figure shows, peak discharge is about 89129 cubic meters per second.

Figure 8: Results of Numerical modeling and taleghan dam break hydrograph due to overtopping in scenario 4.
Scenario 5
In the fifth scenario, overtopping causes erosion and break in the entire crest and core and most parts of the toe. In this condition, dam totally breaks. Erosion in the whole core and filter and most parts of crust is evident in Figure 9. It should be noted that maximum depth of fracture is about 71 meters. Outflow hydrograph is shown in Figure 9. As it shows, peak discharge is about 97054 cubic meters per second.

Figure 9: Results of numerical modeling and taleghan dam break hydrograph due to overtopping in scenario 5.
Comparison of numerical model results and empirical equations
Numerical model results for different scenarios have been compared with empirical equations presented by Froehlich, MacDonald and statistical method (multiple regressions). The comparison results are shown in Table 4.
| Scenario | Flow-3D | Froehlich | Multiple Regression | MacDonald | |||
|---|---|---|---|---|---|---|---|
| Qp (m3/s) | Relative Error (%) |
Qp (m3/s) | Qp (m3/s) | Relative Error (%) |
Qp (m3/s) | Relative Error (%) |
|
| 1 | 54269 | 20.6 | 68356 | 76869 | 29.4 | 94341 | 74 |
| 2 | 59390 | 16.2 | 70919 | 78688 | 24.5 | 95318 | 60 |
| 3 | 78913 | -9.2 | 72217 | 80013 | 1.3 | 96000 | 22 |
| 4 | 89129 | -21 | 73647 | 81567 | -9.2 | 96910 | 9 |
| 5 | 97054 | -19.9 | 80934 | 89145 | -8.8 | 106685 | 4 |
Table 4. Comparison of peak discharge values based on empirical equations and numerical modeling.
Also, in the above Table 4, error values have been calculated.
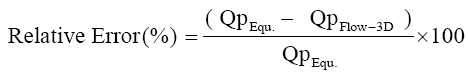 (4)
(4)
According to Table 4, maximum error value of simulation based on Froehlich equation is about 20%. Considering different geometric and hydraulic conditions that affect overtopping and dam break, this error value is acceptable. Some factors causing the Relative Error (%) include material type of core, filter and crust and geometric conditions of dam location such as height, crest length etc. The difference of numerical results with the mentioned equation for maximum and minimum discharge is about 20% and for average discharge is about 10%. The reason should be checked in the first equation. One of the reasons for difference is associated with different hydraulic conditions in the first equation. In other words, this equation has been presented for average discharges. So, the error is minimum for the third scenario discharge.
Considering multiple regressions, results show that numerical model results for average and maximum discharge are close to the equation results. Minimum error of numerical model is 1.3% that is related to scenario 3.
Regarding MacDonald [14] equation, a dam factor coefficient has been defined that is equal to  As this coefficient
or inflow and dam reservoir height increases, the accuracy of defined equation increases. Based on the comparison of numerical
model outputs and equation 3 results in Table 4, for maximum inflow volume to reservoir, numerical modeling error is about 4%.
This error value shows high accuracy of numerical model in calculation of dam break peak discharge.
As this coefficient
or inflow and dam reservoir height increases, the accuracy of defined equation increases. Based on the comparison of numerical
model outputs and equation 3 results in Table 4, for maximum inflow volume to reservoir, numerical modeling error is about 4%.
This error value shows high accuracy of numerical model in calculation of dam break peak discharge.
Based on numerical model results, Flow-3D estimates maximum discharge of embankment dam break with high accuracy. Maximum discharge values of dam break resulting from overtopping of sudden floods can be predicted using Flow-3D model. Results show that maximum and minimum error values of the comparison between peak discharge of dam break in model and empirical equations for different scenarios are about 74% and 4%, respectively. Considering different conditions and parameters in the model, these error values are acceptable.
• Based on Flow-3D model results, this model estimates maximum discharge of dam break with high accuracy. In simulation of embankment dam break by Flow-3D model and according to appropriate boundary conditions, peak discharge of dam break based on time (hydrograph) can be estimated.
• According to this study, in different flood discharges that cause overtopping, different damages can affect dam body. For this reason, five different scenarios were applied to simulate the effect of each discharge value.
• All three empirical equations results are close to numerical model results in massive inflows to reservoir. MacDonald equation is difference from numerical model results by 40% in a 25 MCM inflow.
• For less inflow to the reservoir, there is a high difference between empirical equation results and numerical model results. Froehlich equation has a better operation than other equations.