A new model to remove ocular artifacts (OA) from electroencephalograms (EEGs) is presented. The model is based on discrete wavelet transformation (DWT) and adaptive noise cancellation (ANC). Using simulated and measured data, the accuracy of the model is compared with the accuracy of other existing methods based on stationary wavelet transforms and our previous work based on wavelet packet transform and independent component analysis. A particularly novel feature of the new model is the use of DWTs to construct an OA reference signal, using the three lowest frequency wavelet coefficients of the EEGs. The results show that the new model demonstrates an improved performance with respect to the recovery of true EEG signals and also has a better tracking performance. Because the new model requires only single channel sources, it is well suited for use in portable environments.
Keywords |
| Adaptive noise cancellation (ANC), electroencephalogram (EEG), ocular artifacts (OAs), signal
processing. |
INTRODUCTION |
| Every day we are exposed to several solicitations for purchasing products, voting or supporting particular
politicians and even improving our life style. Such pressure has become usual, being mediated by the entire current
media available, video, audio, and even internet. How and to what extent these messages could be detected and
recognized by our brain is still not well understood. In fact, the study of brain responses to commercial and political
announcements has been measured mainly by thermodynamic responses of the different brain areas, by using the
functional Magnetic Resonance Imaging devices. However, both the stimuli and the relative brain responses have
rapidly shifting characteristics that are not tracked by the evolution of the hemodynamic blood flow, which usually
lasts 4–6 seconds. Different brain imaging tools, mainly EEG[1,8] and Magneto encephalography, exhibit a sufficient
time resolution to follow the brain activity at an expense of a coarse level of spatial resolution with respect to the MRI.
In fact, during those last ten years, the use of the high resolution EEG techniques has retrieved an increased amount of
information related to the brain during activities related to complex cognitive tasks, such as memory, visual attention,
short-term memory, and so forth. |
| Starting from the interesting characteristic of the high resolution EEG techniques for the tracking of brain
activity, the present work would like to describe neuro electric based methodology for the assessment of the efficacy of
commercial, politic, and Public Service Announcements (PSAs). The aim of the brain imaging techniques applied to
the fruition of commercial advertising is to understand mechanisms underlying customer’s engagement with brand or
company advertised. In particular, the issue is to explain how the exposure of subsequent film segments is able to
trigger in the consumer mind persisting stimuli leading to interest, preference, purchase, and repurchase of a given
product. |
WORKING OF PROJECT |
COMPONENT ANALYSIS |
| In recent years, many traditional approaches have been proposed to remove or attenuate such OAs from
recorded EEG. Widely used methods for attenuating OAs are mostly based on time domain or frequency domain
techniques. Principal component analysis (PCA) has also been used to remove artifacts from EEG[2] . However, PCA
cannot remove the artifacts from EEG completely, because sometimes the waveforms of the OAs are smaller in
amplitude with respect to the ongoing EEG. Later, independent component analysis (ICA) was proposed. ICA is
developed with respect to blind source separation, where the aim is to obtain components that are approximately
independent . However, to remove OAs, ICA needs a reference signal that requires tedious visual classification of the
components . |
| Some research methods have used the modelling of OAs components based on improved support vector
machine techniques to isolate them from the EEG. Discrete wavelet transform (DWT) is a method that neither relies
upon the reference OAs nor visual inspection. As frequency precision is also improved, researchers have often used
DWT to detect the OAs region and then selected the correct threshold to remove the interference. |
ARTIFACTS |
| During the measurement EEG signals, other kinds of signals, such as ECG, EMG, 50Hzelectric interference,
so called artifacts, are also captured by electrodes. These signals mixwith EEG signal and EEG signal are therefore
contaminated. Artifacts are undesired signals that can introduce significant changes in neurological signalsand
ultimately affect the neurological phenomenon . Some types of artifacts will increase or decrease alpha power which
leads to mistakes in the alpha wave measurement. In the application of relaxation state detection, we will have wrong
detections caused by artifacts. |
Characteristics of Artifacts |
| There are many types of artifacts. Some of them will not influence the frequency band ofalpha waves. For
instance, we see a sharp peak around 50 Hz.This is not a feature of EEG signals; however, it is caused by the artifacts of 50Hz electric interference. Luckily this peak is located far from the alpha frequency bands. Therefore,it does not
influence the power change of the alpha waves. Artifacts that have relatively considerable influence on the alpha wave
can be categorized as follows. |
Ocular artifacts (OA) |
| Ocular artifacts are caused by eye movements, such as blinking eyes and rolling eyeballs. It shows a segment
of EEG signals contaminated by eyes blinking. Here we showsa segment of EEG [3] signals contaminated by eyeballs
rolling. In the frequency domain, ocular artifacts increase the power of EEG signals from 2Hz to 20 Hz.
Unluckily,alpha waves locate between 8Hz and 12Hz. Hence, the presence of ocular artifacts in EEG signals will cause
unreliable detection of alpha power. |
COMBINATION OF DWT AND ANC |
| We applied a model based on WPTand ICA to remove the OAs in a contaminated EEG signal. Although the
model employed existing methods to compensatefor ICA’s uncertainties, the tracking performance of signals wasnot
good and compensation for the uncertainties [10,11] of the ICAalgorithm had to be estimated, producing a distorted
signal after denoising. Therefore, in this paper, we have applied a new modelbased on DWT and adaptive noise
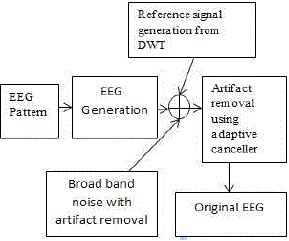
cancellation (ANC) to removethe OAs. The first and most important step of our new methodis the construction of a
reference signal using DWT. With thisreferencesignal, a new model was established based on ANC; hence, a
combination of DWT and ANC is employed. ANC isoften used to remove power line interference in EEG signals. |
| However, it does require a reference signal that has proveddifficult to obtain in biological systems. In this
paper, we applyDWT to the contaminated EEG to derive a reference signalthat is used in a further stage of ANC
processing. This allowsus to lever the biggest advantage of ANC: that it can followthe changes and automatically
adjust its parameters to achieveoptimal performance of the filter when the statistical propertiesof the input signal are
changing. This is a novel approach thatwe demonstrate to be effective even when the EEG signal hasonly one channel
and is hence particularly suitable for portableapplications. |
METHODOLOGY |
| The recorded EEG signals are contaminated by OAs, thiscontamination is considered to be an additive noise
within theEEG signal. So, we can write the following expression |
 |
Operations Involved |
| The first is the construction of the reference signal; the second isthe removal the OAs from the recorded EEG
signal by applyingANC, based on a recursive least-squares (RLS) algorithm.OAs is mainly concentrated in the low frequency band, soDWT is used to construct the OAs in the frequency domain.DWT is a multi resolution
representation of signals and images.It can be used to decompose signals into multiscale representations . |
| It is a commonly used tool for analyzing non stationary signals. The wavelets used in DWT are effectivein
constructing both time- and frequency-domain information from time-varying and non stable EEG signals. There has
been much research on the use of DWT to remove the artifacts in EEG signals. Researchers combine ICA and DWT to
remove artifacts from EEG signals, employing the DWT to improve the contrast of the output after ICA. In DWT is
used to detect the OA region and thenselect the correct threshold to remove interference. |
INTERFERENCE CANCELLATION |
| As for the mathematical notation used throughout this section, all quantities are assumed to be real-valued.
Scalar and vector quantities shall be indicated by lowercase (e.g., x) [4,5] and uppercase-bold (e.g., X) letters,
respectively. We represent scalar and vector sequences or signals as x(n) and X(n), respectively, where n denotes the
discrete time or discrete spatial index, depending on the application. |
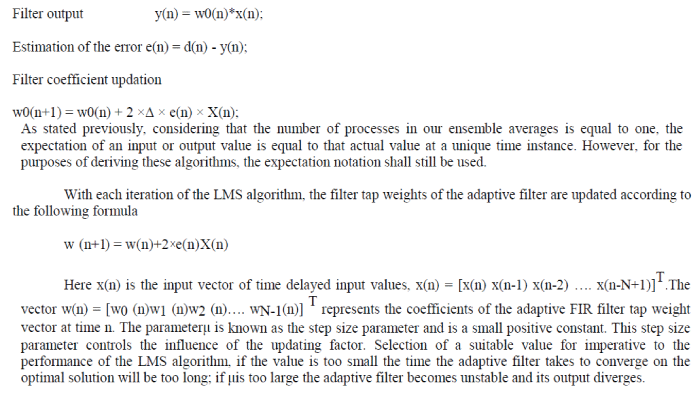
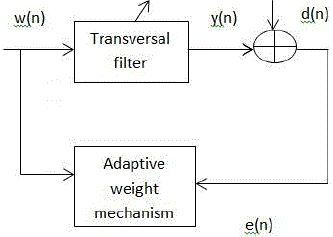
| Herew represents the coefficients of the FIR filter tap weight vector, x(n) is the input vector samples, z
-1
is
a delay of one sample periods, y(n) is the adaptive filter output, d(n) is the desired echoed signal and e(n)is the
estimation error. |
Adaptive filter |
| The aim of an adaptive filter is to calculate the difference between the desired signal and the adaptive filter
output, e(n).[6,9] This error signal is fed back into the adaptive filter and its coefficients are changed algorithmically
in order to minimize a function of this difference, known as the cost function. In the case of acoustic echo
cancellation, the optimal output of the adaptive filter is equal in value to the unwanted echoed signal. When the
adaptive filter output is equal to desired signal the error signal goes to zero. In this situation the echoed signal would
be completely cancelled and the far user would not hear any of their original speech returned to them. |
| This section examines adaptive filters and various algorithms utilized. The various methods used in this thesis
can be dividedinto two groups based on their cost functions. The first class are known as Mean Square Error (MSE) adaptive filters, they aim to minimize a cost function equal to the expectation of the square of the difference between
the desired signal d(n), and the actual output of the adaptive filter y(n) . |
 |
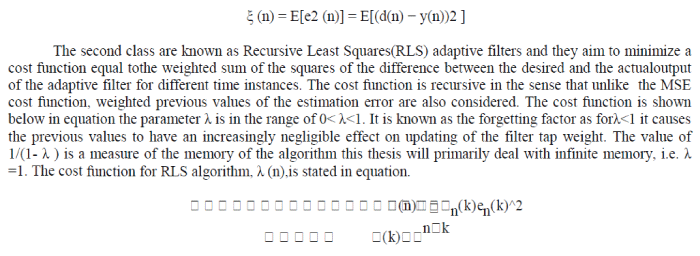
| Where k=1, 2, 3…n., k=1 corresponds to the time at which the RLS algorithm commences. Later we will see
that in practice no tall previous values are considered; rather only the previous N (corresponding to the filter order)
error signals are considered. |
 |
RESULTS |
| In this paper, we have introduced a new model that combines DWT and ANC techniques to remove the OAs
in contaminated EEG signals. We have demonstrated the effectiveness of our new model by using the model to process
simulated and standard EEG data. Our new model is able to eliminate OAs in the low-frequency band even when their
frequency is overlap-ping with that of the EEG signal.Fig 3 shows the original EEG signal. Fig 4 shows the EEG signal
with artifacts. After wavelet decomposition and adaptive noise cancellation the coefficient table is updated based on
the noise present in the EEG signal its shown in Fig 5. Finally the denoised EEG signal is extracted plotted in Fig 6.
SNR value for the noisy EEG signal is 1.5935 and SNR for denoised EEG signal is 1.6265 is achieved. |
DISCUSSION |
| In fig EEG signal was generated and the ocular artifacts were added to the EEG signal. Depends upon the
noise or ocular artifacts the coefficient updation graph is obtained. Finally the noiseless EEG signal was extracted
through MATLAB.Finally the SNR values for respected output is obtained. SNR value changes based on the noise
level. |
Figures at a glance |
 |
 |
 |
| Figure 1 |
Figure 2 |
Figure 3 |
 |
 |
 |
| Figure 4 |
Figure 5 |
Figure 6 |
|
| |
References |
- J. C. Woestengurg, M. N. Verbaten, and J. L. Slangen, “The removal ofthe eye movement artifact from the EEG by regression analysis in thefrequency domain,”Biological Psychol., vol. 16, pp. 127–147, Feb./Mar.1983.
- G Gratton, M. G. Coles, and E. Donchin, “A new method for off-line removal of ocular artifact,”Electroencephalogr. Clin. Neurophysiol., vol. 55,no. 4, pp. 468–484, Apr. 1983.
- T. P. Jung, S. Makeig, C. Humphries, T. W. Lee, M. J. McKeown, V. Iragui,and T. J. Sejnowski, “Removing electroencephalographic artifacts by blindsource separation,”Psychophysiology, vol. 37, pp. 163–178, Sep. 2000.
- T. D. Lagerlund, F. W. Sharbrough, and N. E. Busacker, “Spatial filtering of multichannel electroencephalographic recordings through principalcomponent analysis by singular value decomposition,”Clin. Neurophysiol., vol. 14, no. 1, pp. 73–82, 1997.
- I. T. Joliffe, Principal Component Analysis. New York, NY, USA:Springer-Verlag, 1986.
- R. N. Vigario, “Extraction of ocular artifacts from EEG using independentcomponent analysis,”Electroencephalogr. Clin. Neurophysiol., vol. 103,pp. 395–404, 1997.
- S. Hu, M. Stead, and G. A Worrell, “Automatic identification and removalof scalp reference signal for intracranial EEGs based on independentcomponent analysis,”IEEE Trans. Biomed. Eng., vol. 54, no. 9, pp. 1560–1572, Sep. 2007.
- R. Vigario, J. Sarela, V. Jousmaki, M. Hamalainen, and E. Oja, “Independent component approach to the analysis of EEG and MEG recordings,”IEEE Trans. Biomed. Eng., vol. 47, no. 5, pp. 589–593, May 2000.
- W. Lu and J. C. Rajapakse, “ICA with reference,” inProc. 3rd Int. Conf.Independent Component Analysis Blind Signal Separa tion, 2001, pp. 120–125.
- A. Hyv¨ arinen and E. Oja, “A fast fixed-point algorithm for independentcomponent analysis,”Neural Comput., vol. 9, no. 7, pp. 1483–1492, 1997.
- S.-Y. Hao, K.-Q. Shen, C. J. Ong, E. P. V. Wilder-Smith, and X.-P. Li,“Automatic EEG artifact removal: A weighted support vector machineapproach with error correction,”IEEE Trans. Biomed. Eng., vol. 56, no. 2,pp. 336–344, Feb. 2009.
|