Millions of gallons of oil restfully end up in the seas every year. The early detection and identification of oil spills are critical prerequisites for performing cost effective maritime salvage operations. To overcome this illicit pollution, an oil spill detection method is proposed by Satellite Image Processing Technology. This paper presents a new approach for distinguishing oil spills that are produced by stationary offshore sources, during their early phase of occurrence. The result was reached after analyzing over acquired data that were produced by passive optical sensors like the Moderate Resolution Imaging Spectroradiometer (MODIS). The developed processing scheme involves optimal thresholding of the MODIS images by three algorithms namely Thresholding – By Index, By Value and By Function followed by the integration of all algorithms for detection of possible oil spills. Then segmentation is performed for the separation of look- alikes and oil spill features for the oil spill extraction. The validity of this new empirical algorithm, Thresholding - By Index, By Value, By Function depends upon the difference of RGB color and threshold value of an image. It can also be shown that unique texture differences can be revealed between oil spill and other features by applying Edge Detection Methodology and therefore the reduction of false positives is achieved. The developed algorithm’s efficiency for real time oil spill detection and monitoring was also tested for 93% accuracy and experimentally evaluated by the generation of reports.
Keywords |
| MODIS Images, Image Thresholding, Edge Detection. |
I. INTRODUCTION |
| Oil Spill hits hard to the Marine eco-environment pollution, it is a rapid pollution, which spreads with dispatch in the water
bodies. Crude oil from natural seeps on the ocean’s floor represents an important source of oil to the sea. Natural seepage accounts
for 47% of the crude oil entering the marine environment, but these numbers have large uncertainties. Timely and accurate detection
of surface slicks can improve estimates of seepage rate and helps to monitor oil spills and manage coastal resources. Assessment of
the distribution and fate of oil slicks on the ocean’s surface is often accomplished with use of remote sensing techniques. This
application only used data from airborne visible (VIS) and infrared (IR) sensors but these sensors suffer a lot of disadvantages
including the failure in discriminating feature between oil spills and the surrounding sea surface and the unavailability of data during
the night (VIS) or in bad weather conditions [14]. They also may not be the best approach to give more accurate estimations of
natural oil seepage rates which typically include visible, infrared, micro-wave, and radar sensors [6]. However, most of these
estimates, as well as detection of oil spills from other sources, have relied on Synthetic Aperture Radar (SAR) data which are limited
by coverage, revisit frequency, and cost [1][3][11]. High-resolution visible images from airborne photographs or from Landsat
TM/ETM+ sensors have been used as proof of concept but these also have similar limitations. Hu et al [2003] first used operational
satellite data from MODIS (Moderate Resolution Imaging Spectroradiometer) to detect and monitor oil spills in a turbid estuary,
where MODIS demonstrates the advantages of several images per week at no cost [1][5]. MODIS is a key instrument aboard the
Terra (EOS AM) and Aqua (EOS PM) satellites [5][6]. The first MODIS Flight Instrument, Proto Flight Model or PFM, is
integrated on the Terra (EOS AM-1) spacecraft. Terra successfully launched on December 18, 1999. The second MODIS flight
instrument, Flight Model 1 or FM1, is integrated on the Aqua (EOS PM-1) spacecraft; it was successfully launched on May 4, 2002.
These MODIS instruments will offer an unprecedented look at terrestrial, atmospheric, and ocean phenomenology for a wide and diverse community of users throughout the world. Terra's orbit around the Earth is timed so that it passes from north to south across
the equator in the morning, while Aqua passes south to north over the equator in the afternoon. Terra MODIS and Aqua MODIS [6]
are viewing the entire Earth's surface every 1 to 2 days, acquiring data in 36 spectral bands, ranging in wavelength from 0.4 μm to
14.4 μm and at varying spatial resolutions (2 bands at 250 m, 5 bands at 500 m and 29 bands at 1 km). These data will improve our
understanding of global dynamics and processes occurring on the land, in the oceans, and in the lower atmosphere. They are
designed to provide measurements in large-scale global dynamics including changes in Earth's cloud cover, radiation budget and
processes occurring in the oceans, on land, and in the lower atmosphere. Three on-board calibrators (a solar diffuser combined with
a solar diffuser stability monitor, a spectral radiometric calibration assembly, and a black body) provide in-flight calibration. MODIS
has used the Marine Optical Buoy for vicarious calibration. Oil spills like the one in the Gulf of Mexico are not uncommon and
many other oil spills have occurred in the world's oceans and other water ways in the past [2][3]. The Gulf of Mexico oil spill was
not fully contained until late July 2010 and throughout the duration of the spill, it was estimated that 53,000 barrels of oil per day
were leaked into the Gulf of Mexico. In total almost 5 million barrels of oil were released which makes it the largest accidental oil
spill in the world's history. MODIS is playing a vital role in the development of validated, global, interactive Earth system models
able to predict global changes accurately enough to assist policy makers in making sound decisions concerning the protection of our
environment. However, similar applications in the open ocean environment could not be found in the peer-reviewed literature. The
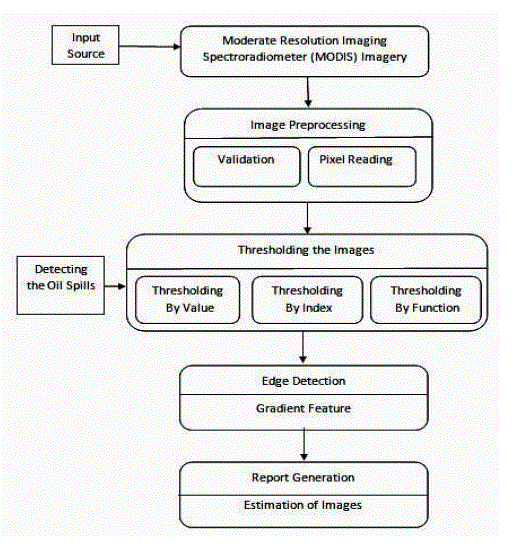
various stages involved in processing of the MODIS images are shown in Fig.1. In this paper Threshold analysis is applied in the
region of oil spill to arrive at optimal composite band of false colors based on MODIS (Moderate Resolution Imaging
Spectroradiometer) data [10]. Then it is processed which may be either a set of characteristics or parameters related to that image.
The Image segmentation launches two methodologies [2][5][9] consisting (i) Adaptive Thresholding and (ii) Edge detection. The
different algorithms are adapted to find the oil spill region; (i) Thresholding By Value, (ii) Thresholding By Index and (iii)
Thresholding By Function. The algorithm validates a huge dataset comprising of images and reports of detected oil spill areas. The
experimental results with a set of statistical feature parameters for the oil spill regions are extracted in report analysis. This design of
image processing algorithms is to locate and map the oil spills on MODIS satellite images by implementing the respective
algorithms. |
II. METHODOLOGY |
| A. Availability |
| Raw MODIS data stream could be received in real-time using a tracking antenna, thanks to the instrument's direct broadcast
capability and also from MODIS website. Alternatively, the scientific data is made available to the public via several World Wide
Web sites and FTP archives, such as ECHO Reverb, the next generation metadata and service discovery tool, which has replaced the
former Warehouse Inventory and Search Tool (WIST). |
| B. Overview |
| The samples of MODIS images are pre-processed and validated for required bmp format. From this, the features of oil spill are
identified by applying various thresholding algorithms and estimating the total oil spill pixel count and area. Oil spill can be very
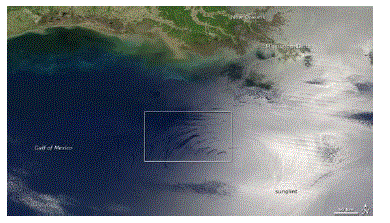
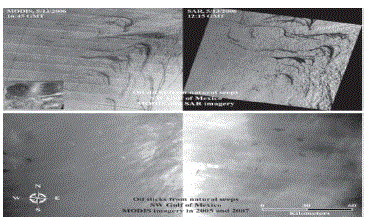
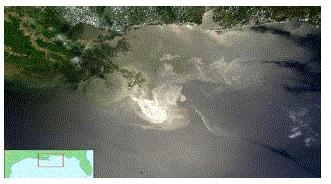
difficult to control and predict. In Fig.2 the Gulf of Mexico oil spill in 2010 was the largest offshore spill in U.S. history [2][3]. |
| C. Image Preprocessing |
| Before designing an algorithm to identify oil spill, the preprocessing [2][3] is done to find what makes the oil spills to look
different. Our intuition tells that ocean water appears in blue, cloud in white; land covered by vegetation in green under the natural
light. When inspecting the images, the color varies accordingly for oil, water and the land. The color of an image is represented by
three values for red, green and blue components. Color images can also be thresholded. One approach is to designate a separate
threshold for each of the RGB components of the image and then combine them with an AND operation. This reflects the way the
camera works and how the data is stored in the computer, but it does not correspond to the way that people recognize color.
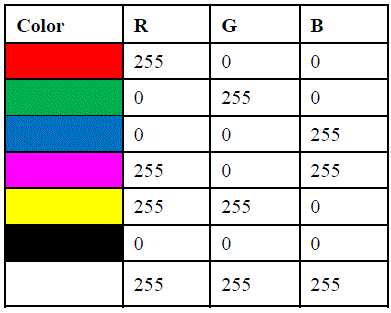
Therefore, the HSL and HSV color models are more often used. It is also possible to use the CMYK color model. Each pixel of a
color image is composed of different RGB values in Fig.4. Then validation of the image by bmp format, size is done and reads the pixel value. The collected MODIS images are analyzed for its pixel value using a “pixel sampler”. The use of mouse listener allows
the user to click on image to sample out the oil, water and land, etc. |
| D. Adaptive Thresholding |
| The image segmentation employs Adaptive Thresholding [2][13][7] where the detection threshold for a given pixel is set to a
fixed value. This technique has proven to be both robust and simple to implement. The optimal threshold separation is dependent on
wind speed. In this previous study [2], as wind speed data was unavailable, the threshold was set to 50 to give an optimal result.
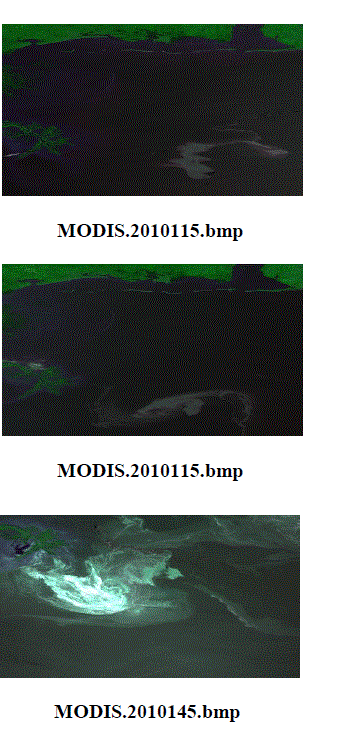
Here, MODIS images have been processed primarily and saved in bitmap format (BMP). Each image must be in 400x450 pixel
resolution and threshold value of 42 is optimised manually including the wind speed data. The date of image acquisition is also
included along with details of an image for report analysis. The examples of MODIS images in bmp format are shown in Fig.5. |
| Thresholding Algorithms – The use of scatter plots, different threshold values/functions, a band rationing technique, in redesigning
the algorithm, reduces the number of mislabeled oil pixels. Alternatively three algorithms are implemented to judge the relative
performance to establish the processed MODIS image. In Thresholding by Value algorithm, the image was inspected to realize the
RGB value of red (R) pixel color, if it was less than 40 then oil spill is recognized. To represent an image accurately with oil spill,
the second algorithm Thresholding by Index is applied. The Band rationing technique divides the pixels in one spectral band by the
corresponding pixel value in the second band. The differences between the spectral reflectance curves of surface types can be
brought out [4][5][8]. Band Rationing Technique (BRT) was named as Thresholding by Index, comparing the red and blue RGB
values and gets the difference value [(blue-red) / (blue + red)]. BRT value will be arbitrarily traced with the colors of water, land, oil
spill regions. Finally, the index value will be measured and it concludes the oil spill regions. Major areas of oil spill will be shown as
boundary and the minor areas as dotted one. Still the detection of oil spill was not fully accomplished by any methodologies or
algorithms. The accuracy is obtained by integrating the third algorithm, Thresholding by Function, which works by investigating the
RGB values of green (G) and red (R). If the green value is less than 3 comparing to (red - 20) i.e. if green < 3 * (red - 20) pixels,
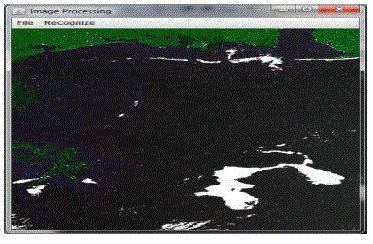
then the oil is detected. It gives the mislabeled oil spills by the integration of all the three Thresholding algorithms shown in Fig.8. In
real-world applications, algorithm can never be perfect. The processed images still equipped with (i) Land (keys) labeled as oil
spills (ii) Undetected oil spill pixels. Apparently, we can sample the mislabeled pixels and add them to the scatter plots. Fig.7 shows
the perfect comparison of all the algorithms and edge detection clearly. The window is developed to load the MODIS imagery in its
format by developing a file menu using Java/JFrame. Adding the Recognize file menu, the menu items of all the three algorithms
and edge detection method is listed. |
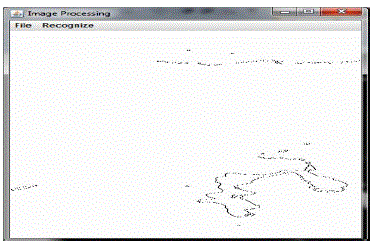
| Edge Detection – This method assists image thresholding by giving out the variance and implementing the dark spotted boundary
around the major affected area [2][3] as shown in Fig.9. The dissimilarities between the neighboring pixels show the color value
differences indicating the spills. In the overblown oil spill areas, the RGB ratio will differ from the non-affected areas, gets
highlighted and surrounded with black spots. The edge detection may not be applied for minor affected areas and misidentified as
water region [9]. In SAR imagery the shadow of the waves and other obstacles will be shown as oil slicks, which are omitted in
MODIS imagery [2][3], so there exist an ease in finding the oil spills with maximum accuracy. |
| Edge Detection constructs a highlighting effect of representing the major oil spill regions by defining them in dark spots [2], and the
remaining area as blank which means water, land and sea grass [7][12]. The pixel reader reads the image from left to right using
RGB ratio analysis, it stops reading if there is a change in the red (R), green (G) and blue (B) values on the basis of oil spill pixels
and it is marked as dark spot, so a boundary appears indicating the major affected area. Eventually, integration of all algorithms is
achieved and addition of the recognize file menu provides the result of each algorithm by a simple click. |
III. RESULTS AND DISCUSSION |
| The unique capability of the MODIS instruments in detecting oil slicks has been demonstrated by thresholding. The sample
image from concurrent MODIS proves the ability to examine large areas of oil slicks by expanding the coverage and revisit
frequency. Our results suggest that seepage rates in Gulf of Mexico may have been misunderstood in past studies, but a detailed
study is required to assess annual oil seepage rates. The new preprocessing and segmentation technique was implemented and
applied to the collected images. In addition, the segmentation techniques including adaptive thresholding and edge detection were
also implemented. The neural network approach, while not generating a perfect classification, does appear to be relatively robust
against noise [2][5]. The overall segmentation accuracies using edge detection, adaptive thresholding were validated against the
manually examined MODIS imagery. Exclusion of complexity in feature extraction has been excluded which improves the accuracy
and robustness of the MODIS imagery [5]. Finally, the images for generating the report were uploaded in the process. To improvise
the understandable inquiry, another file menu is created in the same window page. The menu items include the history of various
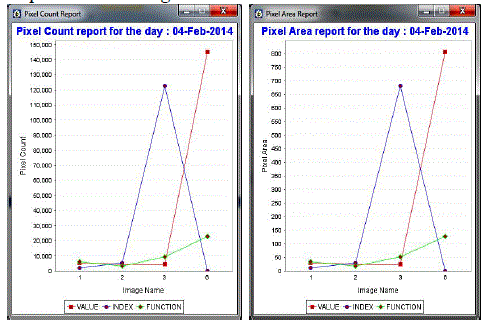
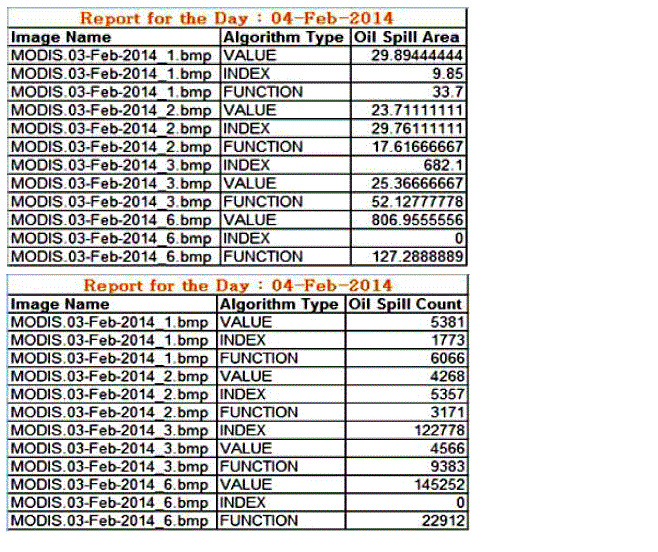
reports generated previously as shown in the Fig.10. Reports are also represented in excel sheets reporting the detected oil spill
areas in square feet along with the total pixel count in Fig.11. |
IV. CONCLUSION |
| This paper exhibited the oil spill detection for MODIS images using three different thresholding techniques Thresholding – By
Value, By Index, By Function. The real time MODIS images were used for monitoring and tracking the oil spills in the affected
ocean regions. Segmentation was performed for the separation of sea grass, water, land and oil spills by the RGB value analysis.
Obtained results confirmed that the robustness and reliability of the MODIS imagery in detecting the oil spills was brought out
successfully. Our main contribution concentrates on providing integrated and timely information about the rapidly spreading oil
spills in the ocean water. It provides fast visualization of current information and the human interpretation will be less. Applying
Edge Detection algorithm on the oil spills captured by the satellite data (MODIS) will characterize the spill edges with uniform
brightness and continuity similar to the surrounding sea water surface. Results achieved seem to be in good agreement even if the
extent of the spilled areas appears underestimated by MODIS, due to the differences in the collected sample images. If these results
are further confirmed by analyzing more images, the full integration of thresholding algorithms with MODIS sensors will allow us to
have more frequent observations. This will improve the possibility to effectively monitor the near real time oil slick evolution. |
Figures at a glance |
 |
 |
 |
 |
| Figure 1 |
Figure 2 |
Figure 3 |
Figure 4 |
 |
 |
 |
 |
| Figure 5 |
Figure 6 |
Figure 7 |
Figure 8 |
 |
 |
 |
| Figure 9 |
Figure 10 |
Figure 11 |
|
| |
References |
- Giacomo De Carolis, Maria Adamo, and Guido Pasquariello,“On the Estimation of Thickness of Marine Oil SlicksFrom Sun-Glittered, Near-Infrared MERIS andMODIS Imagery: The Lebanon Oil Spill Case Study”,IEEE Transactions on Geoscience and Remote Sensing Vol. 52, No. 1, Jan 2014.
- SumanSingha, Tim J. Bellerby, and Olaf Trieschmann,“Satellite Oil Spill Detection Using Artificial Neural Networks”, IEEE Journal of Selected Topics in applied Earth Observations and Remote Sensing, Vol. 6, No. 6, Dec 2013.
- Singha, S. Dept. of Geogr., Univ. of Hull, Kingston upon Hull, UK Bellerby, T.J.;Trieschmann, O.“Detection and classification of oil spill and look-alike spots from SAR imagery using an Artificial Neural Network”, Geosciences and Remote Sensing Symposium (IGARSS), 2012 IEEE International, July 2012.
- Bulgarelli, B. Joint Res. Centre of the Eur. Comm., Ispra, Italy Djavidnia, S.“On MODIS Retrieval of Oil Spill Spectral Properties in the Marine Environment”, Geoscience and Remote Sensing Letters, IEEE (Volume:9 , Issue: 3 ), May 2012.
- De Carolis, G. Inst. for Electromagn. Sensing of the Environ., Milan, Italy Adamo, M. ; Pasquariello, G.“Thickness estimation of marine oil slicks with near-infrared MERIS and MODIS imagery” The Lebanon oil spill case study, Geoscience and Remote Sensing Symposium (IGARSS), 2012 IEEE International, July 2012.
- Solberg, A.H.S. Dept. of Inf., Univ. of Oslo, Oslo, Norway,“Remote Sensing of Ocean Oil-Spill Pollution”, Proceedings of the IEEE (Volume: 100, Issue: 10), Oct. 2012.
- R. R. Ganta, S. Zaheeruddin, N. Baddiri, and R. R. Rao, “Segmentation of oil spill images with illumination-reflectance based adaptive level set model,”IEEE J. Sel. Topics Appl. Earth Observ. Remote Sens., vol. 5, no. 5, pp. 1394–1402, 2012.
- Hua Bo Dept. of Electr. &Comput. Eng., Shanghai Maritime Univ., Shanghai, China Jun Zhang ;Xiaofeng Wang,”Improving Spectral Clustering Algorithm Based SAR Spill Oil Image Segmentation”, Network Computing and Information Security (NCIS), 2011 International Conference on (Volume:2 ), May 2011.
- Zhang Yongzhi Li Hujun ; Xiao, Wang ; Wu Dan,“Edge Extraction of Marine Oil Spill in SAR Images”,Challenges in Environmental Science and Computer Engineering (CESCE), 2010 International Conference on (Volume:1 ), March 2010.
- Kang Xiao State Key Lab. of Marine Geol., Tongji Univ., Shanghai, China HuipingXu,”Detection of Oil Spill in Mexico Gulf Based on MODIS Data”, Multimedia Technology (ICMT), 2010 International Conference, Oct. 2010.
- Del Frate, F. Dipt. diInformaticaSistemi e Produzione, Tor Vergata Univ., Rome, Italy Salvatori, L.,“Oil spill detection by means of neural networks algorithms: a sensitivity analysis, Geoscience and Remote Sensing Symposium”, IEEE International (Volume:2 ), Sept. 2004.
- M. Pathegama and Ö. Göl, “Edge-end pixel extraction for edge-based image segmentation”,Trans.onEngg., Computing and Technology, Vol. 2, pp. 213- 216, 2004.
- Solberg, G. Storvik, R. Solberg, and E. Volden, “Automatic detection of oil spills in ERS SAR images,”IEEE Trans. Geosci. Remote Sens., vol. 4, pp. 1916–1924., 1999.
- M. F. Fingas and C. E. Brown, “Review of oil spill remote sensing”, Spill Sci. Technol. Bull., vol. 4, no. 4, pp. 199–208, 1997.
|