Increased interest in application of green technology and shortage of distributed current carrying capabilities has led to use of Distributed Generation (DG) Systems. The estimated use of DG in the future requires the distribution system engineers to properly take into account its impact in the system planning. Hence, optimal location and sizing of DG in distribution networks is drawing much attention in electric power utilities. Optimal allocation of different types of renewable DG units in the distribution system is used to minimize energy loss. Proper location of DG units in power systems is used to maximize the potential benefits and reduce impact on the power system. Heuristic optimization techniques like Particle Swarm Optimization (PSO), is used as a solver tool to minimize the power loss by changing sitting and varying sizes of DG. The simulation will be carried out on standard rural distribution networks viz, 15-bus and 69-bus distribution systems.
Keywords |
| Particle Swarm Optimization(PSO), Distributed generation(DG), Optimum Location, Optimum Size,
Power loss. |
INTRODUCTION |
| The rapid growth in electricity demand is to encourage the widespread service of Distributed Generation(DG) as there
continues interest in operating it in parallel with a utility distribution system[1].The newly introduced distributed or
decentralized generation units connected to local distribution systems are not dispatchable by central operator, but they
can have a significant impact on the power flow, voltage profile, stability, continuity, short circuit level and quality of
power supply for customers and electricity suppliers. It is widely accepted that renewable energy sources are the key to
a sustainable energy supply infrastructure since they are both inexhaustible and non-polluting. DG has a lot of features
which makes it attractive and offer good immediate solution to the ever growing power demand [2-3]. Many research
outputs have shown that improper allocation and sizing can result in high power losses and can jeopardise the system
performance or results in instability [4]. The effect of power loss has become a major problem because it reduces the
efficiency of power transfer and deteriorates the voltage profile. The minimization of power loss in the distribution
network is gaining much significance when compared to the transmission system. The optimal placement and sizing of
DG units in the existing grid system attempt to reduce the power loss to a considerable extent. Various optimization
techniques should be employed for allowing the best allocation of the DG. |
LITERATURE REVIEW |
| A “2/3 rule” is presented in [5] to place DG on a radial feeder with uniformly distributed load, and it is recommended
to install DG of approximately 2/3 capacity of the incoming generation at approximately 2/3 of the length of line from
the sending end. This rule is simple and easy to use, but it cannot be useful directly to a feeder with other types of load
distribution. In [6] the authors for the case of multiple DG allocation with the aim of minimizing active power losses in
radial Distribution network using Genetic algorithm. The technological benefits from consumer point were assessed
however, in the analysis only active power supply was considered. In the same way [7] proposes sizing using a new
optimization technique called Artificial Bee Colony (ABC) algorithm to optimally size and allocate the DG for real
power minimization. Even though the method has the advantage of controlled parameters, but it involves random
process during initialization of the population and can give inconsistent results many times. Use of loss formula was
employed by [8] to optimally size and allocate single DG by calculating the bus admittance. Such technique lack
robustness as system complexity increases. In the same direction, the authors in [9] formulated a multi-objective
function that consists of positive impacts of DG such as voltage profile improvements as well as the negative ones such
as increased system loss and short-circuit level. This phenomenon can arise due to the wrong sited of DG locations. |
| The use of continuation power flow was proposed by [10] so as to determine the most sensitive buses to voltage
collapse and used as the applicant for DG placement. Many other methods uses heuristic techniques for DG placement
in Distribution networks among which one of the approach is Tabu search [11], for optimizing the problem which is
based on the concept of Pareto Optimality. In [12], optimal DG placement and reclosures based on reliability of the
network was done by using Ant Colony Search (ACS) algorithm. |
| In this paper, the optimal placement problem has been solved using PSO by taking the objective function as exact loss
formula. This paper presents a simple PSO for optimal placement of DG in power systems using loss reduction
criterion. The placement of DG is analysed and the optimal location of bus for adding DG in distributed load patterns is
chosen. The Extensive simulations s carried out to show the effectiveness of the proposed methodology in determining
the optimal bus for the placement of DG and reducing the power losses in the system. The proposed method is tested in
standard IEEE distribution networks. After identifying the optimal design of DG, the voltage improvement and power
loss reduction of the distribution network is analysed. |
DISTRIBUTED GENERATION |
| Distributed generation is an electric power source connected directly to the distribution network or customer side of the
meter. The definition of distributed generation takes different forms in different markets and countries and is defined
differently by different agencies. International Energy Agency (IEA) defines Distributed generation as generating plant
serving a customer on-site or providing support to a distribution network, connected to the grid at distribution level
voltages. CIGRE defines DG as the generation, which has the following characteristics: It is not centrally planned; It is
not centrally dispatched at present; It is usually connected to the distribution network; It is smaller than50–100MW.
Distributed generation also called On-site generation, dispersed generation, embedded generation, decentralized
generation, decentralized energy or distribution energy. The major benefits of distributed generation can be divided into
two categories: economic and operational[17]. In general DG means small scale generation. |
| Many DG technologies are accessible but few are still in research and enlargement stage. The major relevance of DG in
deregulated environment lies in the form of ancillary services. DG also benefits like plummeting energy costs and less
exposure to price volatility. In this study, DGs capable of supplying both real and reactive power are considered.
Different types of the DG’s can be characterized as [13]: |
| Type I: DG capable of injecting real power only, like photovoltaic, fuel cells etc. is the good examples of type-I DG.
Type II: DG capable of injecting reactive power only to improve the voltage profile e.g. kvar compensator,
synchronous compensator, capacitors etc. Type III: DG capable of injecting both real and reactive power, e.g.
synchronous machines. Type IV: DG capable of injecting real but consuming reactive power, e.g. induction generators
used in the wind farms. Most of the approaches presented so far to formulate the optimal placement problem of DG are
considering only the type-I DGs. In the present work type-I, type-II and type-III DG’s are considered for optimal
placement and sizing problem. Optimal placement problem has been solved using PSO algorithm with the exact loss
formula as objective function. |
PROBLEM FORMULATION |
| The optimal sizing and placement of DG results in minimum loss in the distribution system[15]. The majority of the
DGP objectives is to minimize MVA loss in the distribution system is given by equation(1). |
 |
| considering N bus distribution systems, the total real and reactive power loss minimization may be formulated as given
below equations(2) and (3): |
 |
 |
| where |
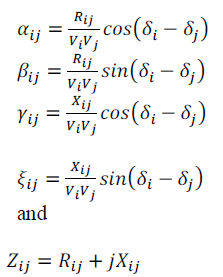 |
| where |
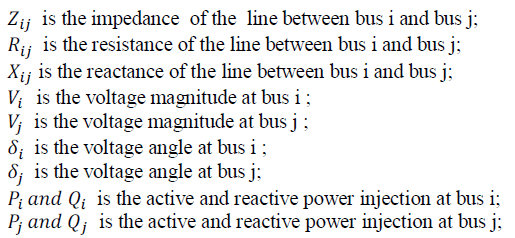 |
Constraints: |
| Another significant part of the optimization model that needs to be defined is the constraints. There are two types of
constraints they are |
| 1. Equality Constraints |
| 2. Inequality Constraints |
| 1) Equality Constraints |
| These constraints are related to the nonlinear power flow equations. |
 |
 |
| where |
| PDGI QDGI are real and reactive power injection from DG is placed at node i . |
| PDI QDI are the load demand at node i. |
| 2).Inequality constraint: |
| The Inequality constraints are those associated with bus voltages and DG to be installed. |
| (a)Bus Voltage Limit: |
| The bus voltage magnitudes are to be kept within acceptable operating limits throughout the optimization process. |
 |
| where |
 |
PARTICLE SWARM OPTIMIZATION |
A. OVERVIEW OF PSO |
| Particle swarm optimization is a stochastic, population-based evolutionary computer algorithm for problem solving. It
is a kind of swarm intelligence that is based on social-psychological principles and provides insights into social
behaviour, as well as contributing to engineering applications. The particle swarm optimization algorithm was first
described in 1995 by JAMES KENNEDY and RUSSELL C.EBERHART. For a given problem, to evaluate a proposed
solution to it exists in the form of a fitness function. A communication structure or social network is also defined;
assigning neighbours for each individual defined as random guesses at the problem solutions is initialized. These
individuals are candidate solutions. They are also known as the particles, hence the name particle swarm. An iterative
process to improve these candidate solutions is set in motion. PSO is one of the most recent developments in the
category of combinatorial met heuristic optimizations. [14]The particles iteratively evaluate the fitness of the candidate
solutions and remember the location where they had their best success. The individuals bet solution is called the
particle best or local best. Each particle makes this information available to their neighbours. The particle velocity and
position update equations in the simplest form that govern the PSO are given by equations (7) and (8) |
 |
 |
| Where |
| N represents number of particle in the swarm, |
| i denotes the ith particle in the swarm, |
| Sik is the ith particle position in iteration k, |
| Vik+1 is the velocity of the particle j in k +1th iteration, |
| Pbesti is the best position of ith particle, |
| Gbest is the best position among all particles in the swarm, |
| w is the inertia weight, |
| 1 C and 2 C are cognitive parameter and social parameter, |
| 1 R and 2 R are the random numbers, |
| k is an iteration number, |
| kmax is the maximum iteration . |
| Acceleration constant 1 C pulls each particle towards local best position whereas constant 2 C pulls the particle towards
global best position. Suitable selection of weight factor w helps in quick convergence. In this study, linearly decreasing
weight w is considered instead of constant weight and it is represented by the following equation (9). |
 |
| Each of the three terms of the velocity update equation have different roles in the PSO algorithm and each particle
maintains its position, composed of the candidate solution and its evaluated fitness, and its velocity. The best fitness
value it has achieved thus far during the operation of algorithm, referred to as the individual best fitness, and the
candidate solution that achieved this fitness, referred to as the individual best position. Finally, the PSO algorithm
maintains the best fitness value achieved among all particles in the swarm, called the global best fitness, and the
candidate solution that achieved this fitness, called the global best position or global best candidate solution. |
| The PSO algorithm consists of just three steps, which are repeated until some stopping condition is met: |
| 1. Evaluate the fitness of each particle |
| 2. Update individual and global best fitness and positions |
| 3. Update velocity and position of each particle. |
B. BASIC MODEL OF PSO |
| In a PSO method, all particles are initiated randomly and evaluated to compute fitness together with finding the
personal best (best value of each particle) and global best (best value of particle in the entire swarm). After that a loop
starts to find an optimum solution. In the loop, first the particle's velocity is updated by the personal and global bests,
and then each particle’s position is updated by the current velocity. The loop is ended with a stopping criterion
predetermined in advance. |
 |
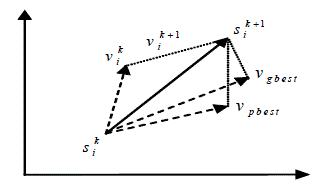
| PSO consists of a group (swarm) of individuals (particles) moving in the search space looking for the best solution.
Each particle is represented by a vector s of length n indicating the position and has velocity vector v used to update the
current position which adjusts its flying according to its own flying experience as well as the flying experience of other
particles. Each particle keeps track of its coordinates in the solution space which are associated with the best solution
(fitness) that has achieved so far by that particle. This value is called personal best, pbest. Another best value that is
tracked by the PSO is the best value obtained so far by any particle in the neighbourhood of that particle. This value is
called gbest. The basic concept of PSO lies in accelerating each particle toward its pbest and the gbest locations, with a
random weighted acceleration at each time step as shown in Fig.5.1. |
C. PSO ALGORITHM |
| The PSO based approach for solving optimal placement of DG for total power loss takes the following steps: |
| Step 1 Input system line, bus data and bus voltage limits, DG real and reactive power generation limits. |
| Step 2 Calculate the bus voltage and MVA loss using base case load flow . |
| Step 3 Define the control variables(real power sizing, reactive power sizing and location of DG) within their
permissible range and randomly initialize a population of particles with position Si and velocities Vi of
the ith particle. |
| step 4 Set the parameters of PSO, C1 = C2 = 2, Wmax = 0.9, Wmin = 0.4. |
| Step 5 For each particle, run load flow program and obtain bus voltage magnitude and angle. |
| Step 6 Calculate fitness function of each particle using equation(1). |
| Step 7 Compare the current position with particle’s previous best experience, pbest, in terms of fitness value
and hence update pbest for each particle in the population. |
| Step 8 After updating the pbest, choose the best value among all the particles in pbest and call it as Global
best, gbest. |
| Step 9 Set iteration =iteration+1. |
| Step 10 Calculate velocity of each particle and update if constraints limit get violated. |
| Step 11 Then calculate new position of each particle. |
| Step 12 For each particle run load flow program and calculate the fitness function. |
| Step 13 Then go to step 6 until the stopping criterion or maximum iterations is reached. |
| Step 14 Finally the optimal DG sizing & placement can be evaluated by tracing the gbest particle and optimized
(minimized) value of MVA loss is obtained using fitness function. |
TEST SYSTEMS AND RESULTS |
| The program code for the optimal placement and sizing of DG units using PSO is developed in MATLAB
environment. The proposed methods have been developed and simulated in MATLAB environment using Matlab 7.9
version. The suitable solution techniques for optimal placing of DG units and real power loss minimization is designed
on PC with 2.6GHz core i5 CPU and 6 GB RAM. |
A. TEST SYSTEM |
| The proposed methodology was tested on a distribution system consisting of 15 bus and 69 bus distribution systems. In
this simulation two different test systems are used to legalize the result for optimal sizing, placement and power loss
reduction. The first test system is 15 bus system with total load of 1.23 MW and 1.25 MVAr. The second test system is
69 bus system with total load of 3.80 MW and 2.69 MVAr[16]. |
A.1. Test system-15 bus distribution system |
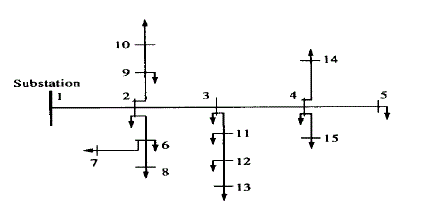
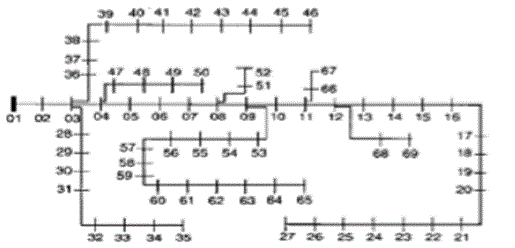
| The first test system is 15 bus distribution system with total load of 1.23 MW and 1.25 MVAr. The one line diagram
for the 15-bus distribution system is shown in Figure 6.1. The bus data and line data for 15 bus system is given in [18]. |
A.2. Test system-69 bus distribution system |
| The second test system is 69 bus distribution system with total load of 3.80 MW and 2.69 MVAr. The one line diagram
for the 69-bus distribution system is shown in Figure 6.2 and the bus data and line data for 69 bus system is given in
[19]. |
B. RESULTS AND DISCUSSIONS |
| By applying PSO, the algorithm discussed in section 5.3 , the total MVA loss can be minimized and optimal sizes of
DG units are calculated at each and every bus. The proposed methods have been developed to calculate the optimum
sizes of DG at various buses and MVA losses with DG at different locations to identify the best locations. Thus, power
loss is found to be minimized by the optimal placement of DG. The system voltage profile is also studied after
identifying the optimal DG placement. |
B.1. Results of 15 bus distribution system |
| The sized DG units are placed at each bus location and the corresponding average MVA loss and average voltage of the
system are calculated. After the placement of DG unit at optimally selected bus, the real power loss in per unit value
are calculated as shown in Table 6.1 below. It is observed from Table 6.1 that by installing the DG unit of appropraite
size gives minimum real power loss, that is before placement of DG average Ploss is found to be 0.0597 (p.u) and after
placement of DG it is found to be 0.0257 (p.u). By using PSO, the average real power loss reduction for 15 bus system
is reduced to 56.95%. The percentage of real power loss reduction is calculated by comparing the results of average
Ploss of with DG and without DG placement. |
| And after the placement of DG unit at optimally selected bus, the reactive power loss in per unit value are calculated
and it is shown in Table 6.2 below. Before placement of DG the average reactive power loss is 0.0553 (p.u) and after the placement of DG average reactive power loss is 0.0215 (p.u). The reactive power loss reduction for 15 bus system
is 61.12%. The percentage of reactive power loss reduction is calculated by comparing the results of average Qloss of
with DG and without DG placement. |
| With DG the total losses can be drastically reduced while satisfying the voltage constraints. Table 6.3 shows average
voltage magnitude before and after the placement of DG that is without DG placement average voltage is found to be
0.9581 (p.u) and after placement of DG average voltage for 15 bus system is 0.9772 (p.u). It is also seen that DG
installation at the optimal locations improves voltage profile and at the same time reduces total MVA losses of the
network. After the placement of DG unit at selected optimal bus, the average voltage in per unit value is calculated
based on the voltage magnitude at each bus and is shown in Table.6.3 below.The voltage improvement after the
placement of DG is found to be 1.9935 percentage. |
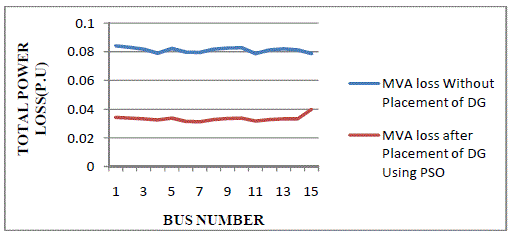
| Figure.6.3. shows the per unit value of MVA loss at each bus with and without placement of DG using PSO for IEEE
15 bus system. Without DG Placement the total Power loss is 122.99 MVA and after placement of DG total MVA loss
is found to be 50.29 MVA. |
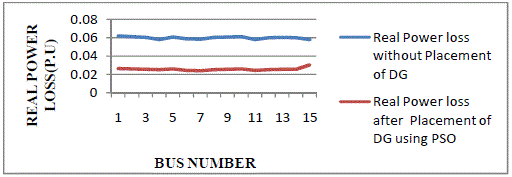
| The total real power loss with the optimal DG placement at various buses is shown in Fig 6.4. Without DG Placement
the total real loss is 544.9 MW and after placement of DG real power loss is 38.12 MW. |
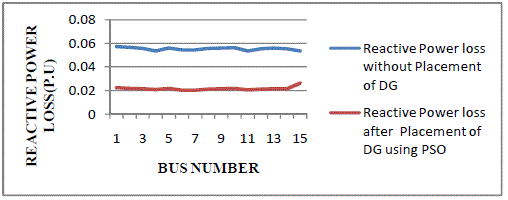
| The total reactive power losses with the optimal DG placement at various buses is shown in Fig 6.5. Without DG
Placement the reactive power loss is 48.84 MVAr and after placement of DG reactive power loss is 32.30 MVAr. |
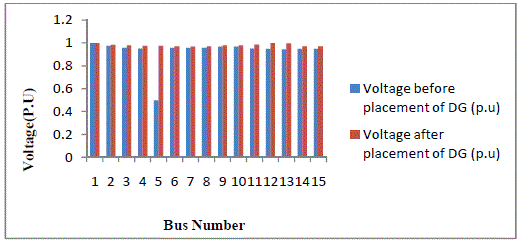
| The optimization method can also be used to determine the locations and sizes of the DG units, so as to achieve the
target of improving voltage profile in the distribution systems. The bus voltage magnitude at each bus by placing DG
unit is compared with the case of without DG placement as shown in Figure 6.6. It is seen that the bus voltage profile is
improved while placing DG unit at optimal location . Further, it has been observed that optimal DG placement also helps to avoid the violation of the bus voltage limits on the system. Thus, by reducing the power losses, the overall
voltage can be improved on the system after the placement of DG. |
B.2. Results of 69 bus distribution system |
| An optimal sizing of DG unit at each bus except reference bus is calculated and after the placement of DG unit at
optimally selected bus, the real power loss in per unit value are calculated is shown in below Table.6.4. It is observed
from Table 6.4 that by installing the DG unit of appropraite size gives minimum real power loss that is before
placement of DG average real power loss is found to be 0.3162 (p.u) and after placement of DG the average real power
loss is 0.2244 (p.u). By using PSO the percentage of average real power loss reduction for 69 bus system is 29.032. The
percentage of real power loss reduction is calculated by comparing the results of average Ploss of with DG and without
DG placement. |
| And after the placement of DG unit at optimally selected bus, the avearge reactive power loss in per unit value are
calculated and it is shown in below Table.6.5. Before placement of DG the average reactive power loss is found to be
0.1431 (p.u) and after the placement of DG the average reactive power loss is 0.1040 (p.u). The average reactive power
loss reduction for 69 bus system is 27.32% . The percentage of reactive power loss reduction is calculated by
comparing the results of average Qloss of with DG and without DG placement. |
| DG installation at the optimal locations improves voltage profile and at the same time reduces total MVA losses of the
network. The average Voltage without DG placement is 0.9637 (p.u) and after placement of DG, the average voltage
for 69 bus system is 0.9681(p.u). The sized DG units are placed at each bus location and the corresponding average
MVA loss and average voltage of the system are calculated. After the placement of DG unit at each bus, the average
voltage in per unit value are calculated as shown in Table.6.6. below. The percentage of voltage improvement after the
placement of DG is found to be 0.4544. |
| Figure.6.7 shows the representation of MVA loss with and without placement of DG using PSO for IEEE 69 bus
system. Without DG Placement the total power loss is 2394.83 MVA and after placement of DG total MVA loss is
1706.44 MVA. |
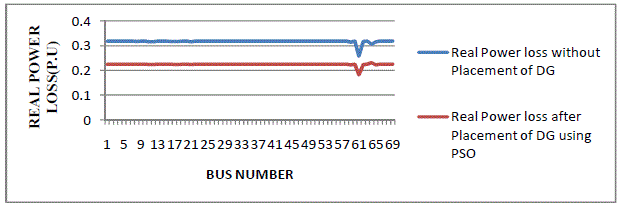
| The total real power losses with the optimal DG placement at various buses for 69 bus system is shown in Fig 6.8 .Thus
with the placement of DG the total real power losses can be drastically reduced while satisfying the constraints. |
| The total reactive power losses with the optimal DG placement for 69 bus system is shown Fig 6.9 and it is observed
that losses are reduced drastically for 69 bus system as seen in 15 bus system. The optimum placement of DG is bus 64
where is the minimum reactive power losses. It is seen that the total reactive power losses reduces significantly by
adding the DG in the distribution networks. |
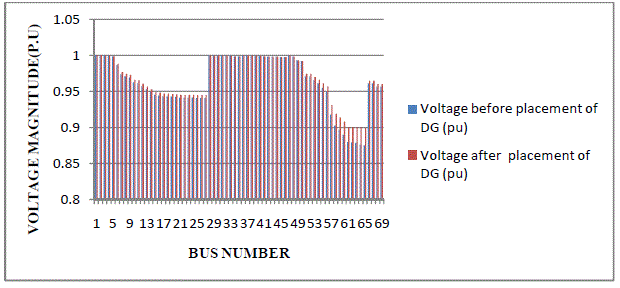
| The bus voltage magnitude at each bus by placing DG unit is compared with the case of without DG placement as
shown in Figure 6.10. and it illustrates that, adding DG to distribution system improves the profile of voltages in all
buses. The average voltage before placement of DG is 0.9637 (p.u) and after placement of DG the average voltage is
0.9681 (p.u) for 69 bus distribution system. |
CONCLUSIONS |
| The improvement on the system depends largely on where the DG is located. The effect of power loss has become a
major problem because it reduces the efficiency of power transfer and deteriorates the voltage profile. The
minimization of power loss in the distribution network is gaining much significance when compared to the transmission
system. The optimal placement and sizing of DG units using PSO algorithm in the existing system attempt to reduce
the real and reactive power loss to a considerable extent. The methodology has been tested on standard IEEE rural
distribution systems viz., 15 and 69 bus test systems. Installing DG resources at critical bus has proved to improve the
system performance most effectively. Results shows that the locations and sizing of distributed generations are decisive
factors in reducing MVA losses in the system.` Further work will focus on cost minimization of DG units along with
loss minimization subject to system operating constraints. |
Tables at a glance |
 |
 |
 |
| Table 1 |
Table 2 |
Table 3 |
 |
 |
 |
| Table 4 |
Table 5 |
Table 6 |
|
Figures at a glance |
 |
 |
 |
 |
| Figure 1 |
Figure 2 |
Figure 3 |
Figure 4 |
 |
 |
 |
 |
| Figure 5 |
Figure 6 |
Figure 7 |
Figure 8 |
 |
 |
 |
| Figure 9 |
Figure 10 |
Figure 11 |
|
References |
- Momoh J., Yan Xia, Boswell G. D. "An approach to determine Distributed Generation (DG) benefits in power networks," Power Symposium , 2008. NAPS, pp 1-7, Sept. (2008).
- Akorede, M.K.,Himaz, H.,Ari, I.,Abkadir, M.Z.A., "Effetive method for optimal allocation of distributed generation units in meshed electric power systems" Generation, Transmission & Distribution IET Vol.5, Issue:2 pp.276-287 Feb.(2011).
- Chiradeja, Pathomthat and Ramakumar, R "An Aproach to Quantify the technical Benefits of Distributed Generation", IEEE Transaction on Energy Conversion, Vol.19,NO.4, pp.764-773,(2004).
- Wang Caisheng, and Hashem, M, “Analytical Approaches for Optimal Placement of Distributed Generation Sources in Power System”, IEEE Transaction on Power System, Vol. 19 , No. 4, pp. 2068 – 2076, (2004).
- H. L. Willis, “Analytical methods and rules of thumb for modeling- distribution Interaction,” in Proc. 2000 IEEE Power Engineering Society Summer Meeting, vol.3, Seattle, A, July 2000, pp.1643– 1644.
- Quezada,Victor H. Mendez Juan River Abbad and Toma‘s Gomez San Roman “Assessment of Energy Distribution Losses for Increasing, Penetration of Distributed generation”, IEEE Transaction on Power System , Vol. 21 , No. 2, pp. 533 -540, (2006).
- Mithulananthan, Than Oo and Le Van Phu, “Distributed Generator Placement in Power Distribution System Using Genetic Algorithm to Reduce Losses”, Thammasat Int. J. Sc. Tech. , Vol. 9, pp. 55 -62, (2004).
- Mrs.A. Lakshmi Devi and Prof B. Subramanyam, “A New Hybrid Method For Loss Reduction And Voltage Improvement In Radial Distribution System- A Case Study”, i- manager’s journal on Electrical Engineering , Vol.1, No.3, pp. 64 - 68,January-March (2008).
- Capitanescu, F.; Rosehart, W.; Wehenkel, L.;"Optimal power flow computations with constraints limiting the number of control actions," PowerTech, IEEE, Bucharest , Vol., no., pp. 1-8, June 28 2009-July 2 2009. DOI: 10.1109/PTC.2009.528215, (2009).
- Feng Dong; Chowdhury, B.H.; Crow, M.L.; Acar, L.; "Improving voltage stability by reactive power reserve management," Power Systems, IEEE Transactions on , Vol. 20 , no.1, pp. 338 - 345. DOI: 10.1109/TPWRS.2004.841241, Feb. (2005).
- Rafael Cossent *, Luis Olmos Tomás Gómez, Carlos Mateo Pablo Frías” Distribution network costs under different penetration levels of distributed generation” European Transactions on Electrical Power Volume 21, Issue 6, pages 1869 –1888. : 7 OCT 2010, DOI: 10.1002/etep.503, September (2011).
- G.P. Harrison, A Piccolo., P Siano., A.R Wallace., (2008) “Hybrid GA and OPF for distribution generation connections,” Electr. Power Energy Syst., Vol.78, pp. 392–398.
- Hung DQ, Mithulananthan N, Bansal RC. "Analytical Expressions for DG allocation in Primary distribution networks" IEEE Trans Energy Converts 2010; 25(3); 814-20.
- Gaing Z (2003). "Particle swarm optimization to solving the economic dispatch considering the generator constraints", IEEE Trans. PWRS. 18(3):1187-1195.
- Acharya N. Mahat p, Mithulananthan N. "An analytical approach for DG allocation in primary distribution network". Elect power Energy Syst 2006:28(10):669-78.
- Baran ME, Wu FF. "Optimum sizing of capacitor placed on radial distribution systems" .IEEE Trans PWRD 1989;4:735-743.
- El-khattam, W. and Salama, M. M. A., "Distributed Generation Technologies, definitions and benefits", Electric Power Systems Research, vol. 71, 2004, pp. 119–12.
- O. Amanifar M.E. HamedaniGolshan , "Optimal Distributed Generation Placement and Sizing for Loss and the Reduction and Voltage Profile Improvement in Distribution Systems using Particle Swarm Optimization and Sensitivity Analysis" International Journal on “Technical and Physical Problems of Engineering” June 2011, Issue 7 ,Volume 3 , pp. 47-53.
- Aida Fazliana Abdul kadir, Azahmohamed, HussainShareef, MohdZamriChewanik"Optimal placement and sizing of distributed generations in distribution systems for minimizing losses and THDv using evolutionary programming", Turkish Journal of Electrical Engineering & Computer Sciences ,(2013) 21: 2269 – 2282.
|