Power flow analysis is widely used by power distribution professional during the operation and planning of power distribution system. There are three main methods for load flow studies namely Gauss-Seidel method, Newton-Raphson method and Fast decoupled method. Different resources are also be used in distributed generation (DG), such as wind turbines, biomass, micro turbine, photovoltaic, fuel-cells, small hydroelectric plants, etc., and it ranging from sub-kW to multi-MW sizes. DG affects the flow of voltage and power conditions on the system equipment. These may affect themselves either positively or negatively depending on the distribution system operating conditions and the DG characteristics. Bacterial Foraging Optimization (BFO) is inspired by the social foraging behaviour of Escherichia coli. It is having a fast convergence and self adaptability of individual in that group searching activities. BFO is more preferred as compared to Particle Swarm Optimization (PSO) and Genetic Algorithm (GA) because it is derivate free technique. BFO is divided into four main steps chemotaxis, swarming, reproduction and elimination dispersal. In this paper, investigation is done on optimal location of DGs are realize using BFO algorithm.
Keywords |
| Power flow, DG, BFO, Newton-Raphson method. |
INTRODUCTION |
| In a three phase ac power systems reactive and active power flows from the generating station to the load through
different networks buses and branches. The flow of reactive and active power is called power flow or load flow. Power
flow studies provide a systematic mathematical approach for determination of various bus voltages, phase angle, active
and reactive power flows through different branches, generators and loads under steady state condition. Thus power
flow study is used to find the steady state operating condition of a power system [1]. Power flow analysis is widely
used by power distribution professional during the operation and planning of power distribution system [2]. Power flow
analysis or load flow analysis is very important in planning stages of new networks or addition to existing ones like
meeting increase load demand and locating new transmission sites and adding new generator sites [3]. Power flow
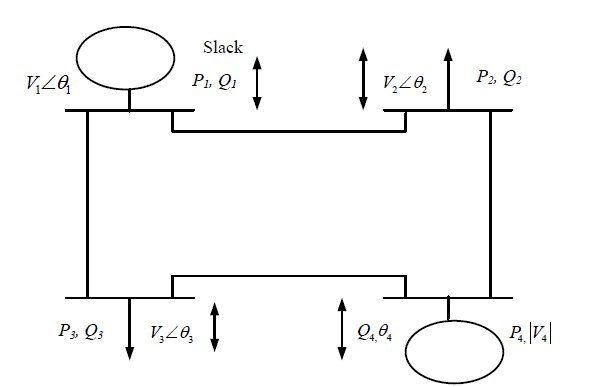
studies are based on a nodal voltage analysis of a power system. Fig. 1 shows the basic power distribution system. The
purpose of power flow studies is to plan ahead and account for various hypothetical situations. If a transmission line
within the power system properly supplying loads must be taken off line for maintenance [4]. The load flow a problem
was first solved using the simplest techniques, soon to be replaced by more sophisticated methods. Load flow analysis
is important in planning of new networks or providing addition to existing ones like adding new generator sites,
meeting increase load demand and locating new transmission sites. It is helpful in determining the as optimal capacity
as well as location of proposed generating station, substation and new lines. A load flow also helps for economic
operations. The line should not be overloaded, it means, we should not operate the close to their stability or thermal
limits. Load flow analysis is the most important of all network calculations because it concerns the network
performance in its normal operating conditions. It is performed to check the magnitude and phase angle of the voltage
at each bus and the real and reactive power flows in the system component [5]. There are three main methods for load
flow studies namely Gauss-Seidel method, Newton-Raphson method and Fast decoupled method [3]. Different
resources are also be used in DG, such as wind turbines, biomass, micro turbine, photovoltaic, fuel-cells, small
hydroelectric plants, etc., and it ranging from sub-kW to multi-MW sizes [6]. On basis of the some features of
distribution systems such as; radial structure, unbalanced distributed loads, large number of nodes, a wide range of R/X ratios; the conventional techniques developed for transmission systems generally fail on the determination of optimum
location of distributed generations. The Newton-Raphson load flow algorithm is used in this paper. |
| Dispersed generation (DG) or distributed generation or embedded generation (EG) is small-scale power generation that
is usually connected to or embedded in the distribution system. The word DG also indicates the use of technology that
is sited throughout a utility’s service to lower the cost of service. DG affects the flow of voltage and power conditions
on the system equipment. These may affect themselves either positively or negatively depending on the distribution
system operating conditions and the DG characteristics [7]. There are many benefits of DG and the reasons for
implementing DG are an energy efficiency or rational use of energy, deregulation or competition policy, diversification
of energy sources, availability of modular generating plant, of finding sites for smaller generators, shorter construction
times and lower capital costs of smaller plants and proximity of the generation plant to heavy loads, which reduces
transmission costs. Also distribution generation is accepted by many countries [8, 9]. In the present scenario of vast
load growing system, use of DG have become more advantages like reduction of distribution and transmission cost,
electricity price, reduction of sound pollution and green house gases. Other benefits include line loss reduction, peak
shaving, and better voltage profile, power quality improvement, reliving of transmission and distribution congestion
then improved network capacity, protection selectivity and network robustness. The impact of DG on power losses is
not only affected by Distribution Generation location but also depends on the network topology as well as on DG size
and type. The placement, of DG should be optimal in order to maximize the benefits of it [10]. Different protective
schemes are applied to distribution systems, the over current protection and the fuse saving or blowing schemes are the
commonly used [11]. The objective of this paper is to investigate the optimal placement of two DGs in order to obtain
minimum real powers losses using BFO algorithm. The details of BFO algorithm is given in section II. The
methodology is specified in section III, result and discussions in section IV along with conclusions in section V. |
BFO |
| BFO has provided the attention to many researchers, especially due to its biological motivation and its graceful
structure. Many researchers are trying to hybridize BFO with different algorithms in order to enhance its local and
global search properties individually [12]. Foraging theory explains how to get a patch or amount of food and decide
whether to enter and search for amount of food and when to leave that patch. BFO is inspired by the social foraging
behavior of Escherichia coli. It is having a fast convergence and self adaptability of individual in that group searching
activities. BFO is more preferred as compared to PSO and GA because it is derivate free technique. BFO is divided into
four main steps chemotaxis, swarming, reproduction and elimination dispersal. BFO is a new idea which is used to find
the best location for placement of DG [13]. During foraging of the bacteria, motion is achieved by a set of tensile
flagella. Flagella help an E. coli bacterium to swim, so two basic operations performed by a bacterium at the time of
foraging. When they rotate the flagella in the clockwise direction, each flagellum pulls on the cell. That output in the
moving of flagella independently and finally the bacterium swings with lesser number of swings whereas in a harmful place it swings frequently to find a nutrient gradient. Moving the flagella in the counterclockwise direction helps the
bacterium to move or travel at high speed so that bacteria undergo chemotaxis, where they like to move towards a
nutrient gradient and avoid noxious environment [14]. Generally the bacteria move for a longer distance in a friendly
environment. When they get food in sufficient, they are increased in length and in presence of suitable temperature they
break in the middle to from an exact replica of itself. Passino introduce an event of reproduction in BFOA. Due to the
occurrence of sudden environmental changes or attack, the chemotactic progress may be destroyed and a group of
bacteria may move to some other places. That provides the event of elimination-dispersal in the real bacterial
population, where all the bacteria in a region are killed or a group is dispersed into a new part of the environment [15]. |
METHODOLOGY |
| IEEE 14 bus data system is considered for study and analysis purposes for best possible position of DGs. For
calculating overall minimum losses by using Newton-Raphson method only i.e. by inserting two DGs manually at
different locations in the system is a difficult and inappropriate task. To overcome this difficulty a BFO algorithm is
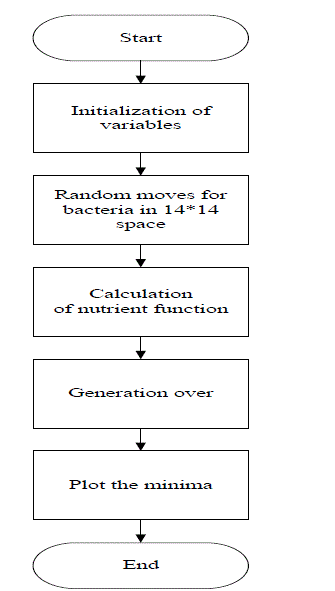
used. Overall real losses are calculated by Newton-Raphson method, when no DG is inserted in the system. Fig. 2
shows the overall steps in form of flow chart for finding minima of losses using BFO. Two DGs of same size or
capacities are inserted in the system. |
| In BFO, 50 bacteria are selected to travel at different locations. All bacteria move in random direction in search of food
(minima in losses). At every selected position of bacteria, loss is estimated. Process is repeated for the bacteria
generation which is inspired by passion, to introduce an event of reproduction in BFO. Due to the presence of sudden
environmental changes or sudden attack, the chemotactic progress may be destroyed and a group of bacteria which are
selected may move to some other places or some other may be introduced in the swarm of concern. This constitutes the
event of elimination-dispersal in the real bacterial population, where all the bacteria in a region are killed or a group is
dispersed into a new part of the environment. Locations where minima loss is obtained by the bacteria, 3D graph is generated. Thus instead of calculating loss at every location of two DGs in 14 bus system, improved system by BFO is
implemented. At particular location generated by BFO, overall losses are again calculated using Newton-Raphson
method. |
RESULT AND DISCUSSION |
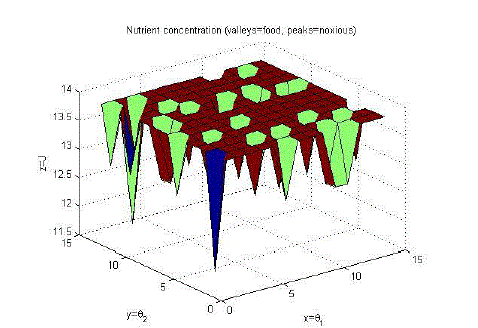
| Investigations were carried out using 14 bus data system to find the best location for placement of DGs. Fig. 3
represents the location of minima, where x= θ1 and y= θ2 represent the locations of DG1 and DG2 in the range from 1 to
14 respectively. While z=J represents value of the real losses and the locations of minima, exposed by valleys in the
graph. |
| No peaks in the graphs represents that no bacteria takes noxious value. BFO algorithm is used to find the locations and
Load flow calculations are carried out by using Newton-Raphson method to calculate the losses. Location where
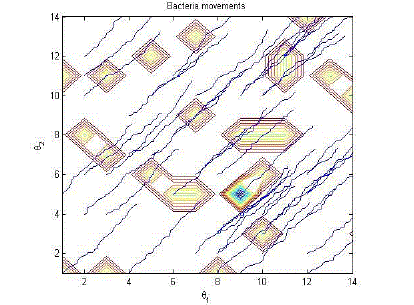
overall loss is minimum, considered as the best location for the placement of DG. Fig. 4 represents the movement of
bacteria which moves to take some values while searching for minima. After getting the best location DG are placed
which improves active power, reactive power and reduces real losses and increased efficiency. By using BFO, 20
possible minima are obtained and at every such location losses are calculated which are revealed in the Table I. Loss in
14 bus system without using DG is about 13.81 MVA, and minimum loss with inserting two DG is at location (3, 7)
which is about 10.12. DG1 and DG2 must be inserted at third and seventh location respectively. Thus loss reduction is
reduced to about 26.72 percent. This can further be reduced by using different capacities of DG. |
CONCLUSION |
| Experiment was carried out to explore the optimal location of DGs in 14 bus system. Location and capacity of DG are
the two important parameters for installation of DG in any system. The analysis of the results showed that the DG must
be placed in particular location in order to get minimum losses. Two DG of same capacities is inserted in the system.
Manually it becomes lengthy and tough procedures to insert DGs in each point and find the losses at each point. The
proposed procedure with the combination of BFO and Newton-Raphson method minimizes the labour and provides
efficient and effective results in less time with little complexity. |
Tables at a glance |
 |
| Table 1 |
|
Figures at a glance |
 |
 |
 |
 |
| Figure 1 |
Figure 2 |
Figure 3 |
Figure 4 |
|
References |
- Hota, B. S. and Mallick, A. K. “Load Flow Study in power System,” thesis bachelor of technology in Electrical engineering, Department of Electrical Engineering National Institute of Technology Rourkela, 2011.
- Available_online: http://www.reseeds.com/load%20flow%20notes.pdf.
- Ghosh, N. et.al, “A load flow based approach for optimal allocation of distribution units in the distribution network for voltage improvement and loss minimization,” International Journal of Computer Applications, vol. 50, pp. 975, 2012.
- Available_online: http://faculty.ksu.edu.sa/htalaat/EE342/PS3_281.pdf.
- Available_online: http://prr.hec.gov.pk/Chapters/543S-2.pdf.
- Kotb, M. F., “Distributed generators location and capacity effect on voltage profile improvement and power losses reduction using genetic algorithm,’’ Journal of Energy and Power Engineering, vol. 6, pp. 446, 2012.
- Subrahmanyam, B. V. and Radhakrishna, C., “Distributed generator placement and sizing in unbalanced radial distribution system,”International Journal of Electrical and Electronics Engineering, vol. 2, pp. 232, 2009.
- Gaonkar, D. N. “Distributed Generation,” InTech, pp. 289, 2010.
- Injeti, S. K. et.al, “Optimal planning of distributed generation for improved voltage stability and loss reduction,’’ International Journal of Computer Applications, vol. 15, pp. 40, 2011.
- Pires, B. A. S. et.al, “ Maximising peneration of active power by distributed generation on a real system,’’ CIRED 21st InternationalConference on Electricity Distribution Frankfurt, pp. 93, 2011.
- Yammani, C., Maheswarapu, S., and Matam, S., “Optimal placement of multi DGs in distribution system with considering the DG BusAvailable Limits,’’ Energy and Power, vol. 2, pp. 18, 2012.
- Das, S. et.al, “Bacterial foraging optimization algorithm: theoretical foundations, analysis, and applications,” Foundations of Computational Intelligence, 3, pp.23, 2009.
- Liu, Y. and Passino, K. M., “Biomimicry of social foraging bacteria for distributed optimization: models, principles, and emergentbehaviors,” Journal of Optimization Theory and Applications, vol. 115, pp. 603, 2002.
- Naziraghdam, H., “Bacretia Foraging for dispressed energy resourses, placement, considering reliability and enhancement and power loss reduction of distribution system,’’ World Applied Sciences Journal, vol. 20, pp. 1426, 2012.
- Rashtchi, V. and Darabian, M., “A New BFA-Based Approach for Optimal Sitting and Sizing of Distributed Generation in DistributionSystem,” International Journal of Automation and Control Engineering, vol. 1, pp. 9, 2012.
|